
Prometheus监控RocketMQ
本文基于官方提供的RocketMQ Exporter来监控RocketMQ集群
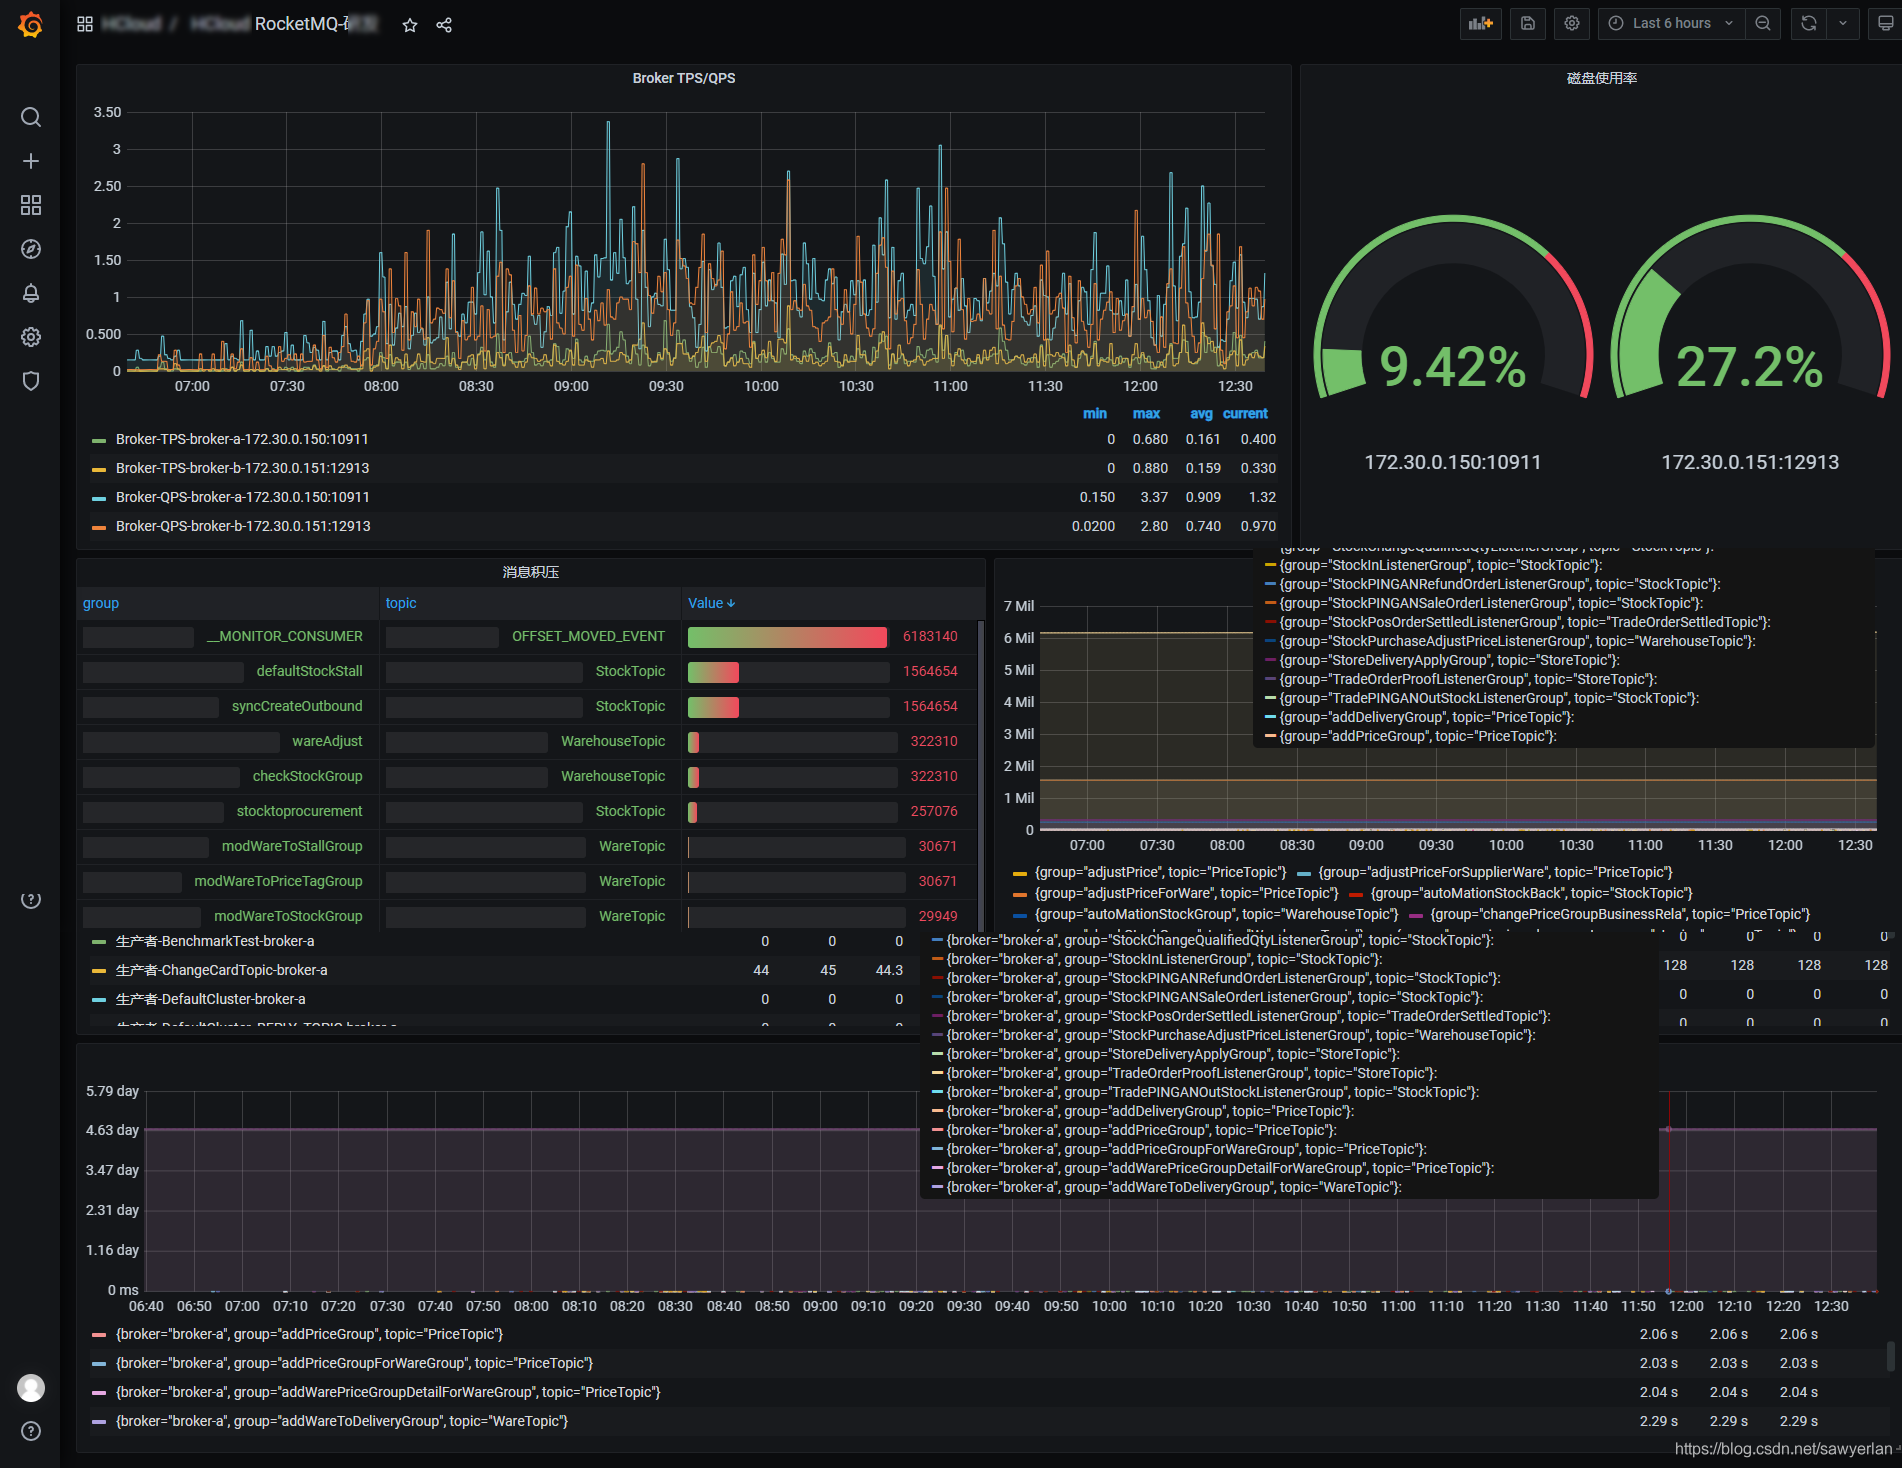
1.Broker TPS/QPS的监控
2.消息积压监控
3.消费组消费演示监控
最终的Grafana面板效果图如下:
楼主RocketMQ环境是三主三从集群(只要在其中一台部署监控即可)
配置步骤
1.安装RocketMQ Exporter
RocketMQ官方已经提供了exporter,官方链接https://github.com
但是未直接提供镜像,需要我们下载源码然后mvn package -Dmaven.test.skip=true docker:build生成镜像
以下是已经生成好的镜像可直接使用:
docker pull sawyerlan/rocketmq-exporter:latest
#https://hub.docker.com/repository/docker/sawyerlan/rocketmq-exporter
docker启动命令:
docker run --name rocketmq-exporter --restart=always -p 5557:5557 -d sawyerlan/rocketmq-exporter --rocketmq.config.namesrvAddr="10.249.1.58:9876;10.249.1.123:9876;10.249.1.6:9876"
验证是否有数据,访问http://你的ip:5557/metrics
2.配置prometheus
  - job_name: 'wms-rocketmq'
    static_configs:
    - targets: ['10.249.1.6:5557']
      labels:
        env: prod_wms
        app: rocketmq
        instance: 10.249.1.123:9876
reload 你的Prometheus使配置生效:
curl -X POST http://localhost:9090/-/reload
3.配置告警规则
groups:
- name: rocketmq
  rules:
  - alert: RocketMQ Exporter is Down
    expr: up{job="rocketmq"} == 0
    for: 20s
    labels:
      severity: disaster
    annotations:
      summary: RocketMQ {{ $labels.instance }} is down
  - alert: RocketMQ 存在消息积压
    expr: (sum(irate(rocketmq_producer_offset[1m])) by (topic)  - on(topic) group_right sum(irate(rocketmq_consumer_offset[1m])) by (group,topic)) > 5
    for: 5m
    labels:
      severity: warning
    annotations:
      summary: RocketMQ (group={{ $labels.group }} topic={{ $labels.topic }})积压数 = {{ .Value }}
  - alert: GroupGetLatencyByStoretime 消费组的消费延时时间过高
    expr: rocketmq_group_get_latency_by_storetime/1000  > 10 and rate(rocketmq_group_get_latency_by_storetime[5m]) >0
    for: 3m
    labels:
      severity: warning
    annotations:
      description: 'consumer {{$labels.group}} on {{$labels.broker}}, {{$labels.topic}} consume time lag behind message store time
        and (behind value is {{$value}}).'
      summary: 消费组的消费延时时间过高
  - alert: RocketMQClusterProduceHigh 集群TPS > 20
    expr: sum(rocketmq_producer_tps) by (cluster) >= 20
    for: 3m
    labels:
      severity: warning
    annotations:
      description: '{{$labels.cluster}} Sending tps too high. now TPS = {{ .Value }}'
      summary: cluster send tps too high
4.另外一个告警规则(楼主没用到)
groups:
- name: GaleraAlerts
  rules:
  - alert: RocketMQClusterProduceHigh
    expr: sum(rocketmq_producer_tps) by (cluster) >= 10
    for: 3m
    labels:
      severity: warning
    annotations:
      description: '{{$labels.cluster}} Sending tps too high.'
      summary: cluster send tps too high
  - alert: RocketMQClusterProduceLow
    expr: sum(rocketmq_producer_tps) by (cluster) < 1
    for: 3m
    labels:
      severity: warning
    annotations:
      description: '{{$labels.cluster}} Sending tps too low.'
      summary: cluster send tps too low
  - alert: RocketMQClusterConsumeHigh
    expr: sum(rocketmq_consumer_tps) by (cluster) >= 10
    for: 3m
    labels:
      severity: warning
    annotations:
      description: '{{$labels.cluster}} consuming tps too high.'
      summary: cluster consume tps too high
  - alert: RocketMQClusterConsumeLow
    expr: sum(rocketmq_consumer_tps) by (cluster) < 1
    for: 3m
    labels:
      severity: warning
    annotations:
      description: '{{$labels.cluster}} consuming tps too low.'
      summary: cluster consume tps too low
  - alert: ConsumerFallingBehind
    expr: (sum(rocketmq_producer_offset) by (topic) - on(topic)  group_right  sum(rocketmq_consumer_offset) by (group,topic)) - ignoring(group) group_left sum (avg_over_time(rocketmq_producer_tps[5m])) by (topic)*5*60 > 0
    for: 3m
    labels:
      severity: warning
    annotations:
      description: 'consumer {{$labels.group}} on {{$labels.topic}} lag behind
        and is falling behind (behind value {{$value}}).'
      summary: consumer lag behind
  - alert: GroupGetLatencyByStoretime
    expr: rocketmq_group_get_latency_by_storetime > 1000
    for: 3m
    labels:
      severity: warning
    annotations:
      description: 'consumer {{$labels.group}} on {{$labels.broker}}, {{$labels.topic}} consume time lag behind message store time
        and (behind value is {{$value}}).'
      summary: message consumes time lag behind message store time too much

reload使配置生效
curl -X POST http://localhost:9090/-/reload
4.配置grafana
直接导入模板14612
