
事件发生预测
突发奇想想实现一个对事件发生进行预测的程序,例如根据历史上每次出现月食的时间,推测下次出现月食的时间。下面是我的一个简单实现(对时间序列预测并不了解,所以我相信有更合适的源数据处理方法和更优秀的算法模型可以用),日后有机会再优化!😎
由于“发生”/“不发生”是一种离散的数据,我不知道有没有对应的合适的算法,想了想后,不如转化成两次事件发生相距的时间,这样作为一个连续量可能更容易被预测。
另外,查资料选择了典型时间预测方法中的 SARIMA,它适用于具有趋势 且/或 季节性成分的单变量时间序列。
输入量为事件发生间隔序列,根据此预测下一次发生距离最后一次发生多久。
代码
对序列数据读取并转化为时间间隔。
这里计算时间间隔其实有一点问题,因为获得的数据表明了,在这个序列位置 i 下,和下一个序列位置 i+1 的时间差,而在预测时,输入的数据不可以有来自未来的数据;
如果改成 gap = [0] + [y[i] - y[i - 1] for i in range(1, len(y))] 可能会好一点,表示当前位置与上一个位置的时间差;
但是想一想其实也不太行,感觉直观上更合逻辑的做法是,把当前时刻与上一次(和其他历史时刻)的时间差作为输入,而非预测的对象。
import pickle with open("data.pkl", "rb") as f: y = pickle.load(f) y.sort() gap = [y[i + 1] - y[i] for i in range(len(y) - 1)] gap = [i.total_seconds() for i in gap]
模型fit函数、可视化、性能指标计算
from statsmodels.tsa.statespace.sarimax import SARIMAX from random import random import numpy as np import matplotlib.pyplot as plt def predict(y, order, seasonal_order, draw=True): model = SARIMAX(y, order=order, seasonal_order=seasonal_order) model_fit = model.fit(disp=False) yhat = model_fit.predict(0, len(y)) if draw: y = np.array(y) yhat = np.array(yhat) a_day = 3600 * 24 plt.plot(y) plt.scatter(range(len(y)), y) plt.plot(yhat) plt.scatter(range(len(yhat)), yhat) plt.plot(y + a_day, linestyle="dashed") plt.plot(y - a_day, linestyle="dashed") return yhat def rmse(y, yhat): return np.mean(np.square(np.array(y) - np.array(yhat[: len(y)]))) def mean_error(y, yhat): y = np.array(y) yhat = np.array(yhat)[: len(y)] return np.mean(np.abs(y - yhat))
SARIMAX 模型有 order, seasonal_order 两个参数需要确定,为了选择比较合适的参数,这里(想不到什么很好的方法)使用遍历,比较出性能最佳的参数。
class Compare: "保存最佳参数结果,对新的参数运行并比较" def __init__(self, data) -> None: self.data = data self.error = np.inf self.best_order = None self.best_seasonal_order = None def test(self, order, seasonal_order): try: yhat = predict( self.data, order=order, seasonal_order=seasonal_order, draw=False, ) e = mean_error(gap, yhat) / 24 / 60 / 60 if e < self.error: self.error = e self.best_order = order self.best_seasonal_order = seasonal_order print("update best, loss", e) else: print("Loss", e) except Exception as e: print("Exception", e) c = Compare(gap) for i1 in range(0, 6): for i2 in range(0, 3): for i3 in range(0, 3): for i4 in range(0, 3): for i5 in range(0, 3): for i6 in range(0, 3): for i7 in range(0, 5): c.test((i1, i2, i3), (i4, i5, i6, i7))
最后得到的最佳参数为 (5, 1, 1), (0, 0, 2, 3),此时预测平均偏差在 0.6961620395764679 (天)
predict(gap, (5, 1, 1), (0, 0, 2, 3))
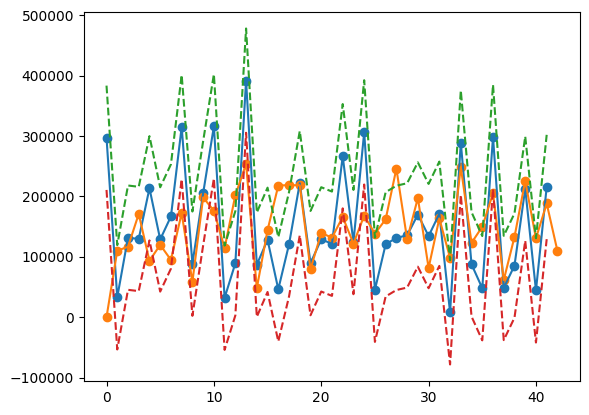
虚线表示以1天为宽度的上下边界,橙色的是预测的结果,如果以 1 天的误差为容忍上限的话,其实预测准确度也还行,毕竟平均误差在 0.696 天。
预测下一次发生相距时间
order, seasonal_order = (5, 1, 1), (0, 0, 2, 3) model = SARIMAX(gap, order=order, seasonal_order=seasonal_order) model_fit = model.fit(disp=False) yhat = model_fit.predict(len(gap), len(gap)) # next value print(yhat / 24 / 60 / 60)
参考资料
动手实战 | Statsmodels 中经典的11种时间序列预测方法 - 知乎
statsmodels.tsa.statespace.sarimax.SARIMAXResults - statsmodels 0.15.0 (+112)


【推荐】国内首个AI IDE,深度理解中文开发场景,立即下载体验Trae
【推荐】编程新体验,更懂你的AI,立即体验豆包MarsCode编程助手
【推荐】抖音旗下AI助手豆包,你的智能百科全书,全免费不限次数
【推荐】轻量又高性能的 SSH 工具 IShell:AI 加持,快人一步
· 全程不用写代码,我用AI程序员写了一个飞机大战
· DeepSeek 开源周回顾「GitHub 热点速览」
· 记一次.NET内存居高不下排查解决与启示
· MongoDB 8.0这个新功能碉堡了,比商业数据库还牛
· .NET10 - 预览版1新功能体验(一)