
pandas
打开excle和csv文件
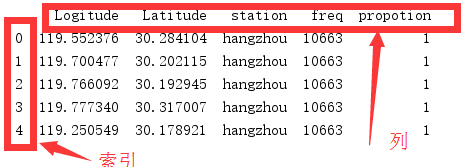
excle文件内容
Logitude	Latitude	station	freq	propotion
119.552376	30.2841038	hangzhou	10663	1
119.7004773	30.202115	hangzhou	10663	1
119.7660918	30.1929452	hangzhou	10663	1
119.77734	30.3170072	hangzhou	10663	1
119.2505493	30.1789208	hangzhou	10663	1
119.2055565	30.16166	hangzhou	10663	1
119.1099468	29.8293896	hangzhou	10663	1
120.1191603	30.1114958	hangzhou	10663	1
120.1722768	30.0505436	hangzhou	10663	1
120.1872744	30.0246524	hangzhou	10663	1
119.8310814	30.4248872	hangzhou	10663	1
120.1785258	30.2188364	hangzhou	10663	1
119.8579521	29.9615426	hangzhou	10663	1
118.5425376	29.4329306	hangzhou	10663	1
119.727348	29.9750276	hangzhou	10663	1
119.9448132	30.4103234	hangzhou	10663	1
119.7061014	30.2387942	hangzhou	10663	1
119.7798396	29.8067348	hangzhou	10663	1
 pd.read_excel(io, sheetname=0, header=0, skiprows=None, skip_footer=0, index_col=None, names=None, parse_cols=None, parse_dates=False, date_parser=None, na_values=None, thousands=None, convert_float=True, has_index_names=None, converters=None, dtype=None, true_values=None, false_values=None, engine=None, squeeze=False, **kwds)
 '''
 该函数主要的参数为io、sheetname、header、names、encoding。
 io:excel文件,可以是文件路径、文件网址、file-like对象、xlrd workbook;
 sheetname:返回指定的sheet,参数可以是字符串(sheet名)、整型(sheet索引)、list(元素为字符串和整型,返回字典{'key':'sheet'})、none(返回字典,全部sheet);
 header:指定数据表的表头,参数可以是int、list of ints,即为索引行数为表头;
 names:返回指定name的列,参数为array-like对象。
 encoding:关键字参数,指定以何种编码读取。
 该函数返回pandas中的DataFrame或dict of DataFrame对象,利用DataFrame的相关操作即可读取相应的数据。
 '''
一些打开exlce常用操作
df = pd.read_excel('小区表.xlsx')  #打开文件,返回DataFrame格式,如果没指定行索引,默认在前面加索引
print(df.head())  #显示head数据,默认首5行。同理还有显示尾部数据tail()
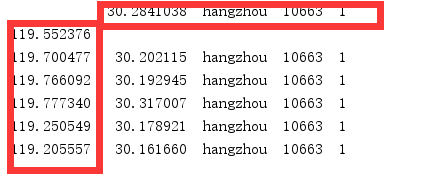
df = pd.read_excel('小区表.xlsx',sheet_name=0,header=1,index_col = 0)
# index_col指定行索引,默认为None。0为第一列做为行索引
# header指定列索引,默认为0,指定行为索引列
# sheet_name指定表,可以是表名
print(df.head())
看下效果:
读取csv文件与读取excle大体一致
pd.read_csv('filename.csv') #这里要注意不能指定sheet。
一些函数的使用
1、获取行索引和列索引
print(df.columns)  #查询所有列索引
print(df.columns[:3])  #支持切片操作
print(df.index) #查询所有行索引,同样支持切片操作

#
Index(['Logitude', 'Latitude', 'station', 'freq', 'propotion'], dtype='object')
Index(['Logitude', 'Latitude', 'station'], dtype='object')
RangeIndex(start=0, stop=18, step=1)
2、取数据
print( df.values)  #查询所有行的数据,返回嵌套列表的形式,不包括行索引
print(df['station'])  #根据列名取1列的值
print(df[:3])   #用数字切片方法,取出前三行

#df.loc[x,y] #x带表行,y带表列。x可以切片(以数字切片,只建立在默认用数字的索引情况下,才能这样操作),返回dataframe对象。
print(df.loc[:2])  #取出前3行(0,1,2),所有列
print(df.loc[:2,['propotion','station']])  #取出前3行,取出多列
print(df.loc[[1,2,4],['propotion','station']])  #根据列表的方法取出数据
print(df.loc[df['Latitude'] == 30.202115])   #筛选数据


print(df.iloc[2])  #取出第三行数据
print(df.iloc[3:5,1:3])  #根据切片,取出3、4行,第1、2列数据
print(df.iloc[[1,3,5],[2,4]])  #根据列表的方法取出数据
print(df.iloc[1,1])  #取一个单元格的数据
#loc与iloc区别是,loc列名或者行名来切片或者通过列表取数据,iloc以数字(或者说位置)切片或者通过列表的方式取数据
3、筛选数据
print(df[df.Logitude > 120])  #判断列Logitude大于120的数据,同理还有<,<=,>= ,!=,==
print(df.loc[df.Logitude > 120])  #判断列Logitude大于120的数据
print(df.loc[df.Logitude > 120,'Latitude'])  #筛选出Logitude大于120,且是Latitude列的数据
df2 = df.copy()  #如果不想改变原来的结构,可以拷贝一份再进行修改
print(df.loc[df.Logitude.isin([119.1099468,12345])])  #用isin来判断,相当于python内置的in方法
4、修改数据
df2 = df.copy()
df2['freq'] = 10713  #修改一列的值
df2.at[:3,1:3] = 'test'  #通过名字或者位置来修改数据
df2.at[:3,['freq','propotion']] = 'one'  #通过名字或者位置来修改数据
df.loc[:1] = 5   #也可以通过loc方法来修改数据
df2.iat[1,3] = 'columns'  #通过位置来修改

#对筛选出来的数据做修改
 df.loc[(df.["propotion"] >= 1) & (df["propotion"] <3), 'station'] = 'beijing'  #筛选出propotion>1,propotion<3的数据。并对筛选出来的数据修改station列的值为'beijing'


df.columns = df.columns.str.replace(' ','')  #把列名中有空格的去掉
df['station'] = df['station'].str.upper()  #对station列转为大写,可以使用str的所有方法
#修改列名
df.rename(columns={'total_bill': 'total', 'tip': 'pit', 'sex': 'xes'}, inplace=True)
插入数据
#插入列
df['D'] = 'd'  #最右侧插入列,直接创建
df.insert(0,'A','a') #其他位置插入列,用insert方法

#插入行
# 在行末尾插入数据
insertRow = pd.DataFrame([[0,0,0,0,0]],columns=df.columns)#生成要插入行的dataframe数据
df = df.append(insertRow,ignore_index=True)  #用append方法插入数据,记得ignore_index = True,否则索引不会自动递增
print(df)

#在中间插入数据,采用分段的方法
insertRow = pd.DataFrame([[0,0,0,0,0]],columns=df.columns)#生成要插入行的dataframe数据
above = df.loc[:2]
below = df.loc[3:]
newdata = above.append(insertRow,ignore_index=True).append(below,ignore_index=True)
print(newdata)

#也可以用.concat()的方法来进行拼接,注意ignore_index=True
newdata1 = pd.concat([above,insertRow,below],ignore_index=True)
print(newdata1)
对数据中存在空行,空列,空单元格进行处理。
为了数据直观,我们现在对数据进行修改
Logitude	Latitude	station		asd	freq	propotion

119.8579521	29.9615426	hangzhou			10663	1

118.5425376	29.4329306	hangzhou			10663	1
现在我们需对上面进行删除空行和空列
#删除空行和空列
print(df)
del_empty_lines = df.dropna(how='all')   #删除空行,all表示有全空行就删除
del_empty_columns = df.dropna(axis=1,how='all')  #指定axis删除空列,有全空列就删除

print(del_empty_lines)
print(del_empty_columns)

#如果行中有空的数据就删除该行,同理删除列
print(df)
del_empty_lines = df.dropna(how='any')   #删除空行,any表示该行有空的数据就删除该行,默认是any
del_empty_columns = df.dropna(axis=1,how='any')  #指定axis删除空列,any表示该列有空的数据(空的单元格)就删除该列

print(del_empty_lines)
print(del_empty_columns)


#对空的数据进行填充
df = df.fillna(False)  #对空(NaN)数据进行填充


#判断数据是否为空
pd.isna(df)
判断dataframe、列、行是否为空
注意:
在pandas中我们不能用if df:pass 这种方法来判断是否为空

正确的做法应该是用any,all,empty函数来判断

#If we only have NaNs in our DataFrame, it is not considered empty! We will need to drop the NaNs to make the DataFrame empt
print(df['asd'].dropna().empty)  # 判断列或者dataframe是否为空,False表示不为空.先删除nan数据再判断

DataFrame.any(axis=None, bool_only=None, skipna=None, level=None, **kwargs)
Parameters:
axis : {index (0), columns (1)}
skipna : boolean, default True
Exclude NA/null values. If an entire row/column is NA, the result will be NA
level : int or level name, default None
If the axis is a MultiIndex (hierarchical), count along a particular level, collapsing into a Series
bool_only : boolean, default None
Include only boolean columns. If None, will attempt to use everything, then use only boolean data. Not implemented for Series.
Returns:
any : Series or DataFrame (if level specified)
一些常用函数
Function	Description
count	Number of non-NA observations
sum	Sum of values
mean	Mean of values
mad	Mean absolute deviation
median	Arithmetic median of values
min	Minimum
max	Maximum
mode	Mode
abs	Absolute Value
prod	Product of values
std	Bessel-corrected sample standard deviation
var	Unbiased variance
sem	Standard error of the mean
skew	Sample skewness (3rd moment)
kurt	Sample kurtosis (4th moment)
quantile	Sample quantile (value at %)
cumsum	Cumulative sum
cumprod	Cumulative product
cummax	Cumulative maximum
cummin	Cumulative minimum
 df["total"] = df["propotion"]+df["freq"]   #在最后添加求和列,并对propotion和freq相加

#对列操作比较简单
print(df["propotion"].sum())  #对propotion列相加,其他比如min,mean使用方法类似
print(df[["propotion","asd"]].sum())  #对多列分别求和,第1种写法
print(df.loc[:,["propotion","asd"]].sum()) #对多列分别求和,第2种写法

#如果我们要对结果添加到最后行,需要一些额外的步骤
sum_row = df[["propotion","asd"]].sum()
df_sum = pd.DataFrame(data=sum_row).T #生成dataframe对象,并对行和列翻转
print(df_sum)
df_sum = df_sum.reindex(columns = df.columns) #填充丢失的列

df_final = df.append(df_sum,ignore_index = True) #现在我们有格式良好的生成dataframe对象,用append方法添加

print(df_final)  #可以得到最后求总和的dataframe对象
分组
print(df.groupby('station'))  #此时生成的是一个可迭代的对象,可以对分组出来的数据进行求和(sum)等操作

for st in df.groupby('station'):  #根据station来进行分组
    print(st[0],st[1])   #st为一个元组,st[0]是station列的行数据,st[1]分组出来的数据
写入excle
DataFrame.to_excel(excel_writer, sheet_name='Sheet1', na_rep='', float_format=None, columns=None, header=True, index=True, index_label=None, startrow=0, startcol=0, engine=None, merge_cells=True, encoding=None, inf_rep='inf', verbose=True, freeze_panes=None)
'''
该函数主要参数为:excel_writer。
excel_writer:写入的目标excel文件,可以是文件路径、ExcelWriter对象;
sheet_name:被写入的sheet名称,string类型,默认为'sheet1';
na_rep:缺失值表示,string类型;
header:是否写表头信息,布尔或list of string类型,默认为True;
index:是否写行号,布尔类型,默认为True;
encoding:指定写入编码,string类型。


writer = pd.ExcelWriter('output1.xlsx')  #生成一个ExcelWriter对象

for st in df.groupby('station'):  #根据station来进行分组
    st[1].to_excel(writer,st[0],index=False)   #st为一个元组,st[0]是station分组的名字,st[1]分组出来的数据,为dataframe格式
    #index= False 表示不写行号
writer.save()


写入csv文件比较简单
df.to_csv(filename)  #不需要ExcelWriter,不需要表名
new_match_old['PRB大于80%的次数'] = new_match_old.loc[:,'prb>80'] #复制列
