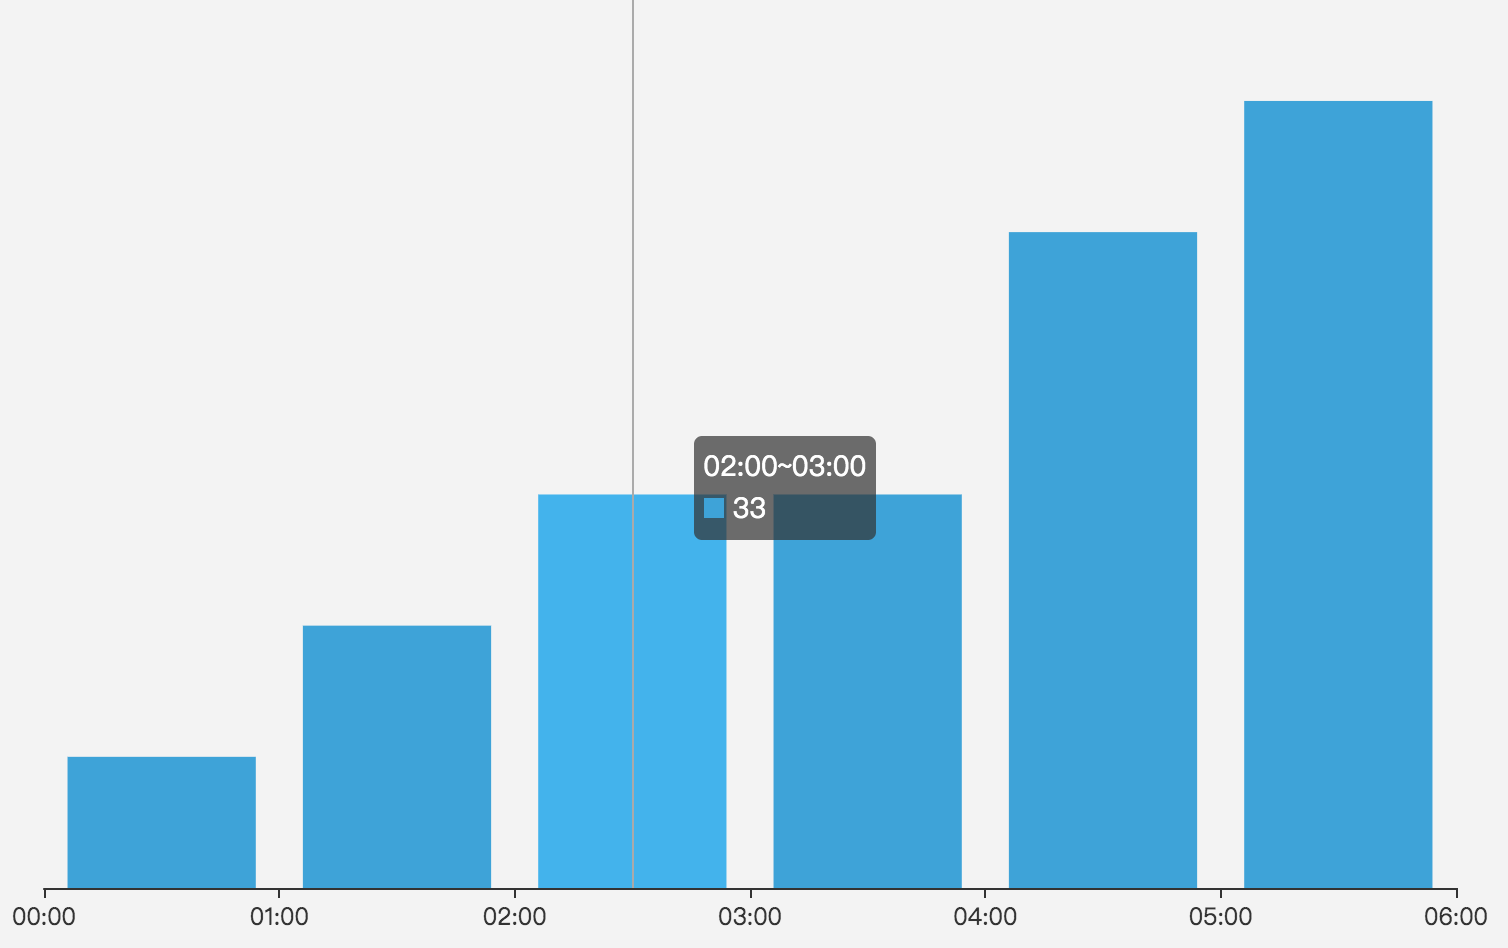
echarts区间柱形图
功能需求:有时候往往需要一个范围区间显示一个值。
解决思路:一般正常设置,只能一个刻度对应一个值。那么则需要使用两个x轴来解决即可。
效果展示:

代码实现:
const time = ['00:00', '01:00', '02:00', '03:00', '04:00', '05:00'];
const time2 = [...time, '06:00'];
const barData =  [11,22,33,33,55,66];

option = {
    tooltip: {
        formatter(item) {
            const html = `<div>
                            <div>${time2[item[0].dataIndex]}~${time2[item[0].dataIndex + 1]||''}</div>
                                <div><span style="width:10px;height:10px;display: inline-block;background:${
                                    item[0].color
                                }"></span> ${item[0].data}</div>
                        </div>`;
            return html;
        },
        trigger: 'axis',
    },
    xAxis: [
        { data: time, show: false },
        {
            data: time2,
            position: 'bottom',
            boundaryGap: false,
            axisPointer: { show: false },
        },
    ],
    yAxis: { show: false, boundaryGap: [0.1, 0.1] },
    grid: { left: 20, right: 20, top: 50, bottom: 20 },
    series: [
        { data:barData, type: 'bar'},
    ],
};


