echarts 中 柱图 、折线图、柱图层叠
app.title = '折柱混合';

option = {
    tooltip: {
        trigger: 'axis',
        axisPointer: {
            type: 'cross',
            crossStyle: {
                color: '#999'
            }
        }
    },
    toolbox: {
        feature: {
            dataView: {show: true, readOnly: false},
            magicType: {show: true, type: ['line', 'bar']},
            restore: {show: true},
            saveAsImage: {show: true}
        }
    },
    legend: {
        bottom:-5,//位置
        data:['提交总数','合格数','合格率']
    },
    xAxis: [
        {
            type: 'category',
            data: ['整机产品','信息系统','合格数'],
            axisPointer: {
                type: 'shadow'
            }
        }
    ],
    yAxis: [
        {
            type: 'value',
            "splitLine": {     //网格线
          "show": false
        },
         "axisTick":{       //y轴刻度线
          "show":false
        },
        "axisLine":{       //y轴
          "show":false

        },
            interval: 50
        },
        {
            type: 'value',
            interval: 20,
              "splitLine": {     //网格线
          "show": false
        },
         "axisTick":{       //y轴刻度线
          "show":false
        },
        "axisLine":{       //y轴
          "show":false

        },
            axisLabel: {
                formatter: '{value} %'
            }
        }
    ],
    color: ['#1e90ff', '#ff7f50', '#b8b8b8'],
    series: [

        {
            name:'提交总数',
           itemStyle: {
                   normal: {
                       label: {
                           show: true,		//开启显示
                           position: 'top',	//在上方显示
                           textStyle: {	    //数值样式
                               color: 'black',
                               fontSize: 14
                           }
                       }
                   }
               },
            type:'bar',
            barGap:'0',
            data:[753,657,654]
        },
        {
            name:'合格数',
           itemStyle: {
                   normal: {
                       label: {
                           show: true,		//开启显示
                           position: 'top',	//在上方显示
                           textStyle: {	    //数值样式
                               color: 'black',
                               fontSize: 14
                           }
                       }
                   }
               },
            type:'bar',
            data:[352,875,453]
        },
        {
            name:'合格率',
            itemStyle : { normal: {label : {show: true}}},
            type:'line',
            yAxisIndex: 1,
            data:[50,55,54]
        }
    ]
};
效果图:
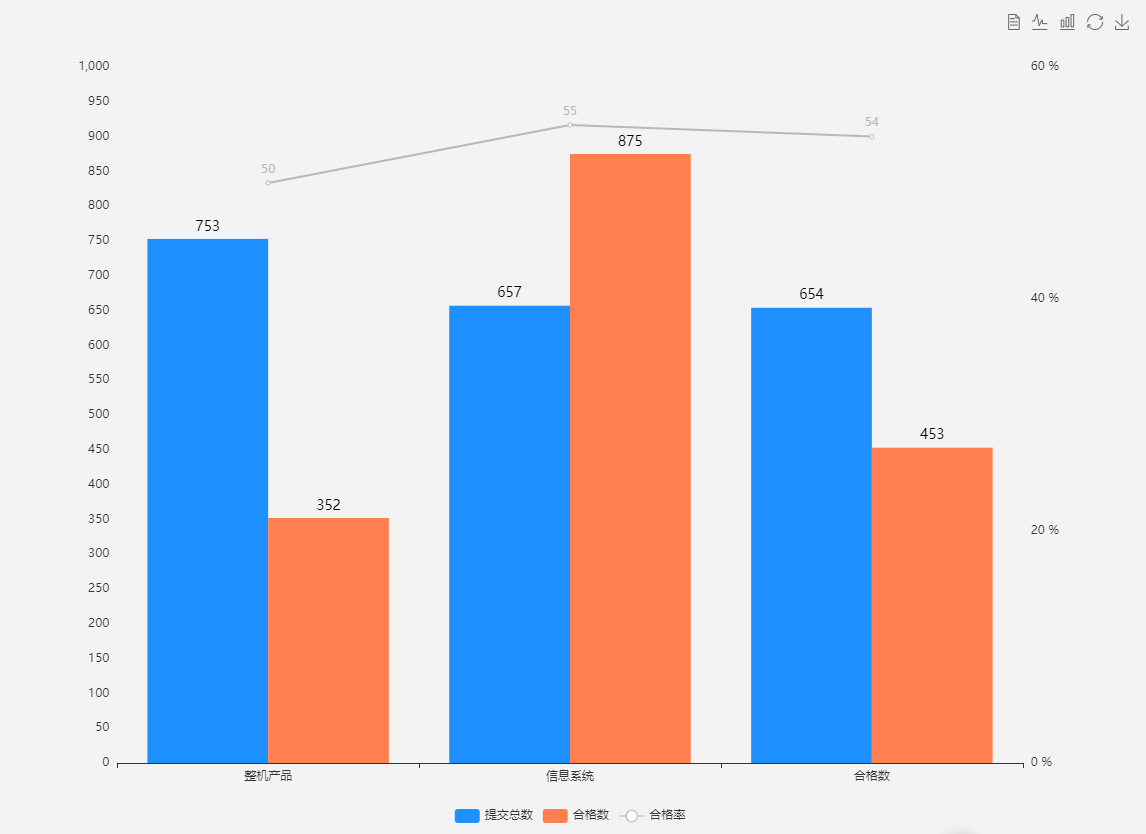
总结:
1. legend 的位置
2. y轴 和x 轴 去掉网格线 和 y轴刻度线 y轴
3.折现图节点显示数据
4.柱图数据在柱子上面
5.自定义柱子和折现的颜色
app.title = '饼图';
var option = {
          title: {
            text: '质量情况',
            left: 'center'
          },
          tooltip: {
            trigger: 'item',
            formatter: "{a} <br/>{b}: {c} ({d}%)"
          },
          legend: {
            // orient: 'vertical',
            // top: 'middle',
            bottom: 10,
            left: 'center',
            data: ['技术', '管理', '已双', '归零']
          },
          series: [
            {
              name: '归零百分比',
              type: 'pie',
              radius: '45%',//饼图的半径大小
              center: ['50%', '50%'],//饼图的位置
              selectedMode: 'single',
              label: {            //饼图图形上的文本标签
                normal: {
                  show: true,
                  position: 'outer', //标签的位置
                  textStyle: {
                    fontWeight: 300,
                    fontSize: 16    //文字的字体大小
                  },
                  formatter: '{d}%'
                }
              },
              data: ['13','24','65','43'],
              itemStyle: {
                normal: {//设置饼图各块之间的间隙
                  borderWidth: 2,
                  borderColor: '#ffffff',
                  color: function (params) {
                    //自定义颜色
                    var colorList = [
                      '#00FFFF', '#00FF00', '#FFFF00', '#FF8C00',
                    ];
                    return colorList[params.dataIndex]
                  }
                },
                emphasis: {
                  shadowBlur: 10,
                  shadowOffsetX: 0,
                  shadowColor: 'rgba(0, 0, 0, 0.5)'
                }
              }
            }
          ]
        };
        // 使用刚指定的配置项和数据显示图表。
        myChart.setOption(option, true);
        $(window).resize(function () {
          myChart.resize();
        });
效果图:
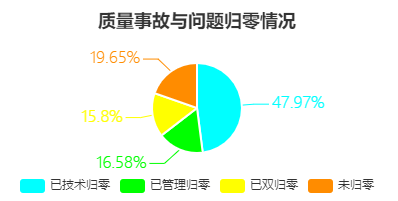
总结:
1. 饼图各块的间隙
2. 饼图数据的显示
3. 层叠柱图
app.title = '堆叠柱状图';

option = {
    tooltip : {
        trigger: 'axis',
        axisPointer : {            // 坐标轴指示器,坐标轴触发有效
            type : 'shadow'        // 默认为直线,可选为:'line' | 'shadow'
        }
    },
    legend: {
        bottom:'0%',
        itemGap: 100,//间距
        data:['邮件营销','联盟广告','视频广告']
    },
    grid: {
        left: '3%',
        right: '4%',
        bottom: '3%',
        containLabel: true
    },
    xAxis : [
        {
            type : 'category',
            data : ['周一','周二','周三','周四','周五','周六','周日']
        }
    ],
    yAxis : [
        {
            type : 'value'
        }
    ],
    series : [

        {
            name:'邮件营销',
            type:'bar',
            stack: '广告',
            itemStyle: {
                normal: {
                  label: {
                    show: true,		//开启显示
                //   // position: 'inner',	//在上方显示
                //     textStyle: {	    //数值样式
                //       color: 'black',
                //       fontSize: 14
                //     }
                  }
                }
            },
            data:[120, 132, 101, 134, 90, 230, 210]
        },
        {
            name:'联盟广告',
            type:'bar',
            stack: '广告',
            itemStyle: {
                normal: {
                  label: {
                    show: true,		//开启显示
                  }
                }
            },
            data:[220, 182, 191, 234, 290, 330, 310]
        },
        {
            name:'视频广告',
            type:'bar',
            stack: '广告',
            itemStyle: {
                normal: {
                  label: {
                    show: true,		//开启显示
                  }
                }
            },
            data:[150, 232, 201, 154, 190, 330, 410]
        }
    ]
};
效果图:
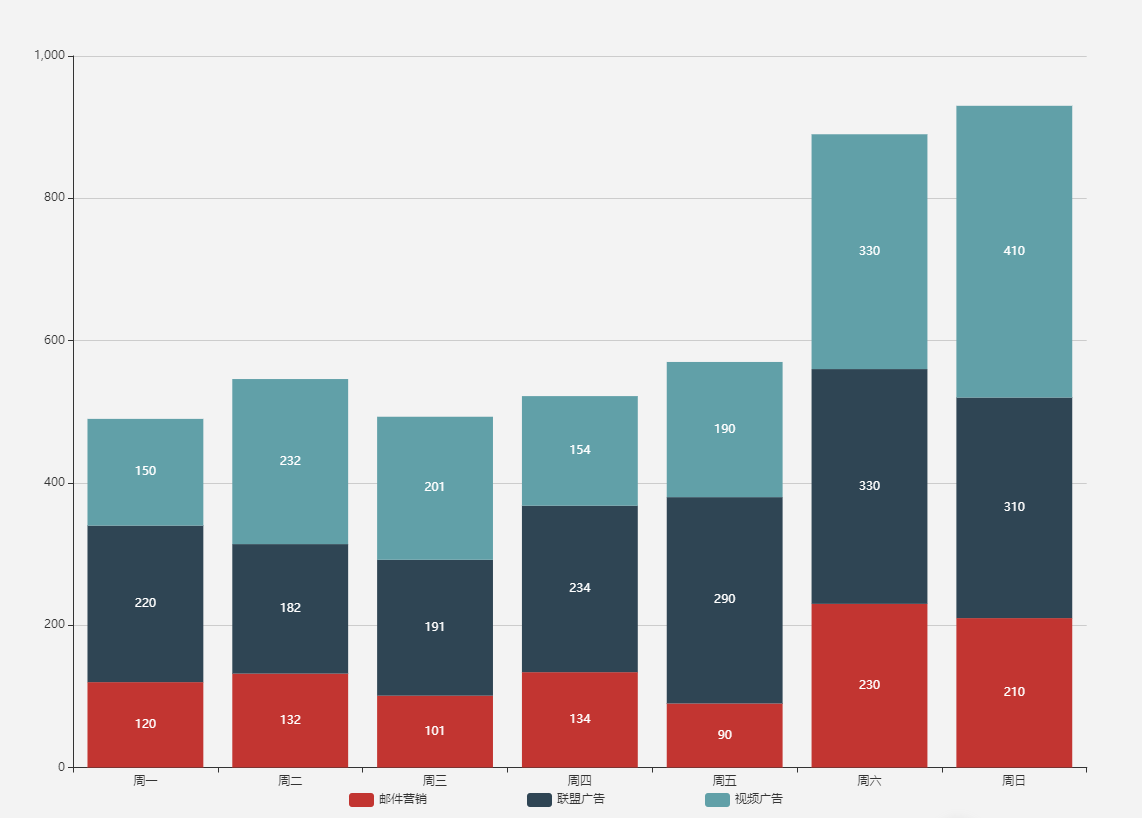
总结:
1.层叠
2.数据显示在柱子上
页面参数配置
theme = {
// 全图默认背景
// backgroundColor: ‘rgba(0,0,0,0)’,
// 默认色板
color: ['#ff7f50', '#87cefa', '#da70d6', '#32cd32', '#6495ed',
'#ff69b4', '#ba55d3', '#cd5c5c', '#ffa500', '#40e0d0',
'#1e90ff', '#ff6347', '#7b68ee', '#00fa9a', '#ffd700',
'#6699FF', '#ff6666', '#3cb371', '#b8860b', '#30e0e0'],
// 图表标题
title: {
x: 'left', // 水平安放位置,默认为左对齐,可选为:
// 'center' ¦ 'left' ¦ 'right'
// ¦ {number}(x坐标,单位px)
y: 'top', // 垂直安放位置,默认为全图顶端,可选为:
// 'top' ¦ 'bottom' ¦ 'center'
// ¦ {number}(y坐标,单位px)
//textAlign: null // 水平对齐方式,默认根据x设置自动调整
backgroundColor: 'rgba(0,0,0,0)',
borderColor: '#ccc', // 标题边框颜色
borderWidth: 0, // 标题边框线宽,单位px,默认为0(无边框)
padding: 5, // 标题内边距,单位px,默认各方向内边距为5,
// 接受数组分别设定上右下左边距,同css
itemGap: 10, // 主副标题纵向间隔,单位px,默认为10,
textStyle: {
fontSize: 18,
fontWeight: 'bolder',
color: '#333' // 主标题文字颜色
},
subtextStyle: {
color: '#aaa' // 副标题文字颜色
}
},
// 图例
legend: {
orient: 'horizontal', // 布局方式,默认为水平布局,可选为:
// 'horizontal' ¦ 'vertical'
x: 'center', // 水平安放位置,默认为全图居中,可选为:
// 'center' ¦ 'left' ¦ 'right'
// ¦ {number}(x坐标,单位px)
y: 'top', // 垂直安放位置,默认为全图顶端,可选为:
// 'top' ¦ 'bottom' ¦ 'center'
// ¦ {number}(y坐标,单位px)
backgroundColor: 'rgba(0,0,0,0)',
borderColor: '#ccc', // 图例边框颜色
borderWidth: 0, // 图例边框线宽,单位px,默认为0(无边框)
padding: 5, // 图例内边距,单位px,默认各方向内边距为5,
// 接受数组分别设定上右下左边距,同css
itemGap: 10, // 各个item之间的间隔,单位px,默认为10,
// 横向布局时为水平间隔,纵向布局时为纵向间隔
itemWidth: 20, // 图例图形宽度
itemHeight: 14, // 图例图形高度
textStyle: {
color: '#333' // 图例文字颜色
}
},
// 值域
dataRange: {
orient: 'vertical', // 布局方式,默认为垂直布局,可选为:
// 'horizontal' ¦ 'vertical'
x: 'left', // 水平安放位置,默认为全图左对齐,可选为:
// 'center' ¦ 'left' ¦ 'right'
// ¦ {number}(x坐标,单位px)
y: 'bottom', // 垂直安放位置,默认为全图底部,可选为:
// 'top' ¦ 'bottom' ¦ 'center'
// ¦ {number}(y坐标,单位px)
backgroundColor: 'rgba(0,0,0,0)',
borderColor: '#ccc', // 值域边框颜色
borderWidth: 0, // 值域边框线宽,单位px,默认为0(无边框)
padding: 5, // 值域内边距,单位px,默认各方向内边距为5,
// 接受数组分别设定上右下左边距,同css
itemGap: 10, // 各个item之间的间隔,单位px,默认为10,
// 横向布局时为水平间隔,纵向布局时为纵向间隔
itemWidth: 20, // 值域图形宽度,线性渐变水平布局宽度为该值 * 10
itemHeight: 14, // 值域图形高度,线性渐变垂直布局高度为该值 * 10
splitNumber: 5, // 分割段数,默认为5,为0时为线性渐变
color: ['#1e90ff', '#f0ffff'],//颜色
//text:['高','低'], // 文本,默认为数值文本
textStyle: {
color: '#333' // 值域文字颜色
}
},
toolbox: {
orient: 'horizontal', // 布局方式,默认为水平布局,可选为:
// 'horizontal' ¦ 'vertical'
x: 'right', // 水平安放位置,默认为全图右对齐,可选为:
// 'center' ¦ 'left' ¦ 'right'
// ¦ {number}(x坐标,单位px)
y: 'top', // 垂直安放位置,默认为全图顶端,可选为:
// 'top' ¦ 'bottom' ¦ 'center'
// ¦ {number}(y坐标,单位px)
color: ['#1e90ff', '#22bb22', '#4b0082', '#d2691e'],
backgroundColor: 'rgba(0,0,0,0)', // 工具箱背景颜色
borderColor: '#ccc', // 工具箱边框颜色
borderWidth: 0, // 工具箱边框线宽,单位px,默认为0(无边框)
padding: 5, // 工具箱内边距,单位px,默认各方向内边距为5,
// 接受数组分别设定上右下左边距,同css
itemGap: 10, // 各个item之间的间隔,单位px,默认为10,
// 横向布局时为水平间隔,纵向布局时为纵向间隔
itemSize: 16, // 工具箱图形宽度
featureImageIcon: {}, // 自定义图片icon
featureTitle: {
mark: '辅助线开关',
markUndo: '删除辅助线',
markClear: '清空辅助线',
dataZoom: '区域缩放',
dataZoomReset: '区域缩放后退',
dataView: '数据视图',
lineChart: '折线图切换',
barChart: '柱形图切换',
restore: '还原',
saveAsImage: '保存为图片'
}
},
// 提示框
tooltip: {
trigger: 'item', // 触发类型,默认数据触发,见下图,可选为:'item' ¦ 'axis'
showDelay: 20, // 显示延迟,添加显示延迟可以避免频繁切换,单位ms
hideDelay: 100, // 隐藏延迟,单位ms
transitionDuration: 0.4, // 动画变换时间,单位s
backgroundColor: 'rgba(0,0,0,0.7)', // 提示背景颜色,默认为透明度为0.7的黑色
borderColor: '#333', // 提示边框颜色
borderRadius: 4, // 提示边框圆角,单位px,默认为4
borderWidth: 0, // 提示边框线宽,单位px,默认为0(无边框)
padding: 5, // 提示内边距,单位px,默认各方向内边距为5,
// 接受数组分别设定上右下左边距,同css
axisPointer: { // 坐标轴指示器,坐标轴触发有效
type: 'line', // 默认为直线,可选为:'line' | 'shadow'
lineStyle: { // 直线指示器样式设置
color: '#48b',
width: 2,
type: 'solid'
},
shadowStyle: { // 阴影指示器样式设置
width: 'auto', // 阴影大小
color: 'rgba(150,150,150,0.3)' // 阴影颜色
}
},
textStyle: {
color: '#fff'
}
},
// 区域缩放控制器
dataZoom: {
orient: 'horizontal', // 布局方式,默认为水平布局,可选为:
// 'horizontal' ¦ 'vertical'
// x: {number}, // 水平安放位置,默认为根据grid参数适配,可选为:
// {number}(x坐标,单位px)
// y: {number}, // 垂直安放位置,默认为根据grid参数适配,可选为:
// {number}(y坐标,单位px)
// width: {number}, // 指定宽度,横向布局时默认为根据grid参数适配
// height: {number}, // 指定高度,纵向布局时默认为根据grid参数适配
backgroundColor: 'rgba(0,0,0,0)', // 背景颜色
dataBackgroundColor: '#eee', // 数据背景颜色
fillerColor: 'rgba(144,197,237,0.2)', // 填充颜色
handleColor: 'rgba(70,130,180,0.8)' // 手柄颜色
},
// 网格
grid: {
x: 80,
y: 60,
x2: 80,
y2: 60,
// width: {totalWidth} - x - x2,
// height: {totalHeight} - y - y2,
backgroundColor: 'rgba(0,0,0,0)',
borderWidth: 1,
borderColor: '#ccc'
},
// 类目轴
categoryAxis: {
position: 'bottom', // 位置
nameLocation: 'end', // 坐标轴名字位置,支持'start' | 'end'
boundaryGap: true, // 类目起始和结束两端空白策略
axisLine: { // 坐标轴线
show: true, // 默认显示,属性show控制显示与否
lineStyle: { // 属性lineStyle控制线条样式
color: '#48b',
width: 2,
type: 'solid'
}
},
axisTick: { // 坐标轴小标记
show: true, // 属性show控制显示与否,默认不显示
interval: 'auto',
// onGap: null,
inside: false, // 控制小标记是否在grid里
length: 5, // 属性length控制线长
lineStyle: { // 属性lineStyle控制线条样式
color: '#333',
width: 1
}
},
axisLabel: { // 坐标轴文本标签,详见axis.axisLabel
show: true,
interval: 'auto',
rotate: 0,
margin: 8,
// formatter: null,
textStyle: { // 其余属性默认使用全局文本样式,详见TEXTSTYLE
color: '#333'
}
},
splitLine: { // 分隔线
show: true, // 默认显示,属性show控制显示与否
// onGap: null,
lineStyle: { // 属性lineStyle(详见lineStyle)控制线条样式
color: ['#ccc'],
width: 1,
type: 'solid'
}
},
splitArea: { // 分隔区域
show: false, // 默认不显示,属性show控制显示与否
// onGap: null,
areaStyle: { // 属性areaStyle(详见areaStyle)控制区域样式
color: ['rgba(250,250,250,0.3)', 'rgba(200,200,200,0.3)']
}
}
},
// 数值型坐标轴默认参数
valueAxis: {
position: 'left', // 位置
nameLocation: 'end', // 坐标轴名字位置,支持'start' | 'end'
nameTextStyle: {}, // 坐标轴文字样式,默认取全局样式
boundaryGap: [0, 0], // 数值起始和结束两端空白策略
splitNumber: 5, // 分割段数,默认为5
axisLine: { // 坐标轴线
show: true, // 默认显示,属性show控制显示与否
lineStyle: { // 属性lineStyle控制线条样式
color: '#48b',
width: 2,
type: 'solid'
}
},
axisTick: { // 坐标轴小标记
show: false, // 属性show控制显示与否,默认不显示
inside: false, // 控制小标记是否在grid里
length: 5, // 属性length控制线长
lineStyle: { // 属性lineStyle控制线条样式
color: '#333',
width: 1
}
},
axisLabel: { // 坐标轴文本标签,详见axis.axisLabel
show: true,
rotate: 0,
margin: 8,
// formatter: null,
textStyle: { // 其余属性默认使用全局文本样式,详见TEXTSTYLE
color: '#333'
}
},
splitLine: { // 分隔线
show: true, // 默认显示,属性show控制显示与否
lineStyle: { // 属性lineStyle(详见lineStyle)控制线条样式
color: ['#ccc'],
width: 1,
type: 'solid'
}
},
splitArea: { // 分隔区域
show: false, // 默认不显示,属性show控制显示与否
areaStyle: { // 属性areaStyle(详见areaStyle)控制区域样式
color: ['rgba(250,250,250,0.3)', 'rgba(200,200,200,0.3)']
}
}
},
polar: {
center: ['50%', '50%'], // 默认全局居中
radius: '75%',
startAngle: 90,
splitNumber: 5,
name: {
show: true,
textStyle: { // 其余属性默认使用全局文本样式,详见TEXTSTYLE
color: '#333'
}
},
axisLine: { // 坐标轴线
show: true, // 默认显示,属性show控制显示与否
lineStyle: { // 属性lineStyle控制线条样式
color: '#ccc',
width: 1,
type: 'solid'
}
},
axisLabel: { // 坐标轴文本标签,详见axis.axisLabel
show: false,
textStyle: { // 其余属性默认使用全局文本样式,详见TEXTSTYLE
color: '#333'
}
},
splitArea: {
show: true,
areaStyle: {
color: ['rgba(250,250,250,0.3)', 'rgba(200,200,200,0.3)']
}
},
splitLine: {
show: true,
lineStyle: {
width: 1,
color: '#ccc'
}
}
},
// 柱形图默认参数
bar: {
barMinHeight: 0, // 最小高度改为0
// barWidth: null, // 默认自适应
barGap: '30%', // 柱间距离,默认为柱形宽度的30%,可设固定值
barCategoryGap: '20%', // 类目间柱形距离,默认为类目间距的20%,可设固定值
itemStyle: {
normal: {
// color: '各异',
barBorderColor: '#fff', // 柱条边线
barBorderRadius: 0, // 柱条边线圆角,单位px,默认为0
barBorderWidth: 1, // 柱条边线线宽,单位px,默认为1
label: {
show: false
// position: 默认自适应,水平布局为'top',垂直布局为'right',可选为
// 'inside'|'left'|'right'|'top'|'bottom'
// textStyle: null // 默认使用全局文本样式,详见TEXTSTYLE
}
},
emphasis: {
// color: '各异',
barBorderColor: 'rgba(0,0,0,0)', // 柱条边线
barBorderRadius: 0, // 柱条边线圆角,单位px,默认为0
barBorderWidth: 1, // 柱条边线线宽,单位px,默认为1
label: {
show: false
// position: 默认自适应,水平布局为'top',垂直布局为'right',可选为
// 'inside'|'left'|'right'|'top'|'bottom'
// textStyle: null // 默认使用全局文本样式,详见TEXTSTYLE
}
}
}
},
// 折线图默认参数
line: {
itemStyle: {
normal: {
// color: 各异,
label: {
show: false
// position: 默认自适应,水平布局为'top',垂直布局为'right',可选为
// 'inside'|'left'|'right'|'top'|'bottom'
// textStyle: null // 默认使用全局文本样式,详见TEXTSTYLE
},
lineStyle: {
width: 2,
type: 'solid',
shadowColor: 'rgba(0,0,0,0)', //默认透明
shadowBlur: 5,
shadowOffsetX: 3,
shadowOffsetY: 3
}
},
emphasis: {
// color: 各异,
label: {
show: false
// position: 默认自适应,水平布局为'top',垂直布局为'right',可选为
// 'inside'|'left'|'right'|'top'|'bottom'
// textStyle: null // 默认使用全局文本样式,详见TEXTSTYLE
}
}
},
//smooth : false,
//symbol: null, // 拐点图形类型
symbolSize: 2, // 拐点图形大小
//symbolRotate : null, // 拐点图形旋转控制
showAllSymbol: false // 标志图形默认只有主轴显示(随主轴标签间隔隐藏策略)
},
// K线图默认参数
k: {
// barWidth : null // 默认自适应
// barMaxWidth : null // 默认自适应
itemStyle: {
normal: {
color: '#fff', // 阳线填充颜色
color0: '#00aa11', // 阴线填充颜色
lineStyle: {
width: 1,
color: '#ff3200', // 阳线边框颜色
color0: '#00aa11' // 阴线边框颜色
}
},
emphasis: {
// color: 各异,
// color0: 各异
}
}
},
// 散点图默认参数
scatter: {
//symbol: null, // 图形类型
symbolSize: 4, // 图形大小,半宽(半径)参数,当图形为方向或菱形则总宽度为symbolSize * 2
//symbolRotate : null, // 图形旋转控制
large: false, // 大规模散点图
largeThreshold: 2000,// 大规模阀值,large为true且数据量>largeThreshold才启用大规模模式
itemStyle: {
normal: {
// color: 各异,
label: {
show: false
// position: 默认自适应,水平布局为'top',垂直布局为'right',可选为
// 'inside'|'left'|'right'|'top'|'bottom'
// textStyle: null // 默认使用全局文本样式,详见TEXTSTYLE
}
},
emphasis: {
// color: '各异'
label: {
show: false
// position: 默认自适应,水平布局为'top',垂直布局为'right',可选为
// 'inside'|'left'|'right'|'top'|'bottom'
// textStyle: null // 默认使用全局文本样式,详见TEXTSTYLE
}
}
}
},
// 雷达图默认参数
radar: {
itemStyle: {
normal: {
// color: 各异,
label: {
show: false
},
lineStyle: {
width: 2,
type: 'solid'
}
},
emphasis: {
// color: 各异,
label: {
show: false
}
}
},
//symbol: null, // 拐点图形类型
symbolSize: 2 // 可计算特性参数,空数据拖拽提示图形大小
//symbolRotate : null, // 图形旋转控制
},
// 饼图默认参数
pie: {
center: ['50%', '50%'], // 默认全局居中
radius: [0, '75%'],
clockWise: false, // 默认逆时针
startAngle: 90,
minAngle: 0, // 最小角度改为0
selectedOffset: 10, // 选中是扇区偏移量
itemStyle: {
normal: {
// color: 各异,
borderColor: '#fff',
borderWidth: 1,
label: {
show: true,
position: 'outer'
// textStyle: null // 默认使用全局文本样式,详见TEXTSTYLE
},
labelLine: {
show: true,
length: 20,
lineStyle: {
// color: 各异,
width: 1,
type: 'solid'
}
}
},
emphasis: {
// color: 各异,
borderColor: 'rgba(0,0,0,0)',
borderWidth: 1,
label: {
show: false
// position: 'outer'
// textStyle: null // 默认使用全局文本样式,详见TEXTSTYLE
},
labelLine: {
show: false,
length: 20,
lineStyle: {
// color: 各异,
width: 1,
type: 'solid'
}
}
}
}
},
map: {
mapType: 'china', // 各省的mapType暂时都用中文
mapLocation: {
x: 'center',
y: 'center'
// width // 自适应
// height // 自适应
},
showLegendSymbol: true, // 显示图例颜色标识(系列标识的小圆点),存在legend时生效
itemStyle: {
normal: {
// color: 各异,
borderColor: '#fff',
borderWidth: 1,
areaStyle: {
color: '#ccc'//rgba(135,206,250,0.8)
},
label: {
show: false,
textStyle: {
color: 'rgba(139,69,19,1)'
}
}
},
emphasis: { // 也是选中样式
// color: 各异,
borderColor: 'rgba(0,0,0,0)',
borderWidth: 1,
areaStyle: {
color: 'rgba(255,215,0,0.8)'
},
label: {
show: false,
textStyle: {
color: 'rgba(139,69,19,1)'
}
}
}
}
},
force: {
// 数据map到圆的半径的最小值和最大值
minRadius: 10,
maxRadius: 20,
density: 1.0,
attractiveness: 1.0,
// 初始化的随机大小位置
initSize: 300,
// 向心力因子,越大向心力越大
centripetal: 1,
// 冷却因子
coolDown: 0.99,
// 分类里如果有样式会覆盖节点默认样式
itemStyle: {
normal: {
// color: 各异,
label: {
show: false
// textStyle: null // 默认使用全局文本样式,详见TEXTSTYLE
},
nodeStyle: {
brushType: 'both',
color: '#f08c2e',
strokeColor: '#5182ab'
},
linkStyle: {
strokeColor: '#5182ab'
}
},
emphasis: {
// color: 各异,
label: {
show: false
// textStyle: null // 默认使用全局文本样式,详见TEXTSTYLE
},
nodeStyle: {},
linkStyle: {}
}
}
},
chord: {
radius: ['65%', '75%'],
center: ['50%', '50%'],
padding: 2,
sort: 'none', // can be 'none', 'ascending', 'descending'
sortSub: 'none', // can be 'none', 'ascending', 'descending'
startAngle: 90,
clockWise: false,
showScale: false,
showScaleText: false,
itemStyle: {
normal: {
label: {
show: true
// textStyle: null // 默认使用全局文本样式,详见TEXTSTYLE
},
lineStyle: {
width: 0,
color: '#000'
},
chordStyle: {
lineStyle: {
width: 1,
color: '#666'
}
}
},
emphasis: {
lineStyle: {
width: 0,
color: '#000'
},
chordStyle: {
lineStyle: {
width: 2,
color: '#333'
}
}
}
}
},
island: {
r: 15,
calculateStep: 0.1 // 滚轮可计算步长 0.1 = 10%
},
markPoint: {
symbol: 'pin', // 标注类型
symbolSize: 10, // 标注大小,半宽(半径)参数,当图形为方向或菱形则总宽度为symbolSize * 2
//symbolRotate : null, // 标注旋转控制
itemStyle: {
normal: {
// color: 各异,
// borderColor: 各异, // 标注边线颜色,优先于color
borderWidth: 2, // 标注边线线宽,单位px,默认为1
label: {
show: true,
position: 'inside' // 可选为'left'|'right'|'top'|'bottom'
// textStyle: null // 默认使用全局文本样式,详见TEXTSTYLE
}
},
emphasis: {
// color: 各异
label: {
show: true
// position: 'inside' // 'left'|'right'|'top'|'bottom'
// textStyle: null // 默认使用全局文本样式,详见TEXTSTYLE
}
}
}
},
markLine: {
// 标线起始和结束的symbol介绍类型,如果都一样,可以直接传string
symbol: ['circle', 'arrow'],
// 标线起始和结束的symbol大小,半宽(半径)参数,当图形为方向或菱形则总宽度为symbolSize * 2
symbolSize: [2, 4],
// 标线起始和结束的symbol旋转控制
//symbolRotate : null,
itemStyle: {
normal: {
// color: 各异, // 标线主色,线色,symbol主色
// borderColor: 随color, // 标线symbol边框颜色,优先于color
borderWidth: 2, // 标线symbol边框线宽,单位px,默认为2
label: {
show: false,
// 可选为 'start'|'end'|'left'|'right'|'top'|'bottom'
position: 'inside',
textStyle: { // 默认使用全局文本样式,详见TEXTSTYLE
color: '#333'
}
},
lineStyle: {
// color: 随borderColor, // 主色,线色,优先级高于borderColor和color
// width: 随borderWidth, // 优先于borderWidth
type: 'solid',
shadowColor: 'rgba(0,0,0,0)', //默认透明
shadowBlur: 5,
shadowOffsetX: 3,
shadowOffsetY: 3
}
},
emphasis: {
// color: 各异
label: {
show: false
// position: 'inside' // 'left'|'right'|'top'|'bottom'
// textStyle: null // 默认使用全局文本样式,详见TEXTSTYLE
},
lineStyle: {}
}
}
},
textStyle: {
decoration: 'none',
fontFamily: 'Arial, Verdana, sans-serif',
fontFamily2: '微软雅黑', // IE8- 字体模糊并且不支持不同字体混排,额外指定一份
fontSize: 12,
fontStyle: 'normal',
fontWeight: 'normal'
},
// 默认标志图形类型列表
symbolList: [
'circle', 'rectangle', 'triangle', 'diamond',
'emptyCircle', 'emptyRectangle', 'emptyTriangle', 'emptyDiamond'
],
loadingText: 'Loading...',
// 可计算特性配置,孤岛,提示颜色
calculable: false, // 默认关闭可计算特性
calculableColor: 'rgba(255,165,0,0.6)', // 拖拽提示边框颜色
calculableHolderColor: '#ccc', // 可计算占位提示颜色
nameConnector: ' & ',
valueConnector: ' : ',
animation: true,
animationThreshold: 2500, // 动画元素阀值,产生的图形原素超过2500不出动画
addDataAnimation: true, // 动态数据接口是否开启动画效果
animationDuration: 2000,
animationEasing: 'ExponentialOut' //BounceOut
};
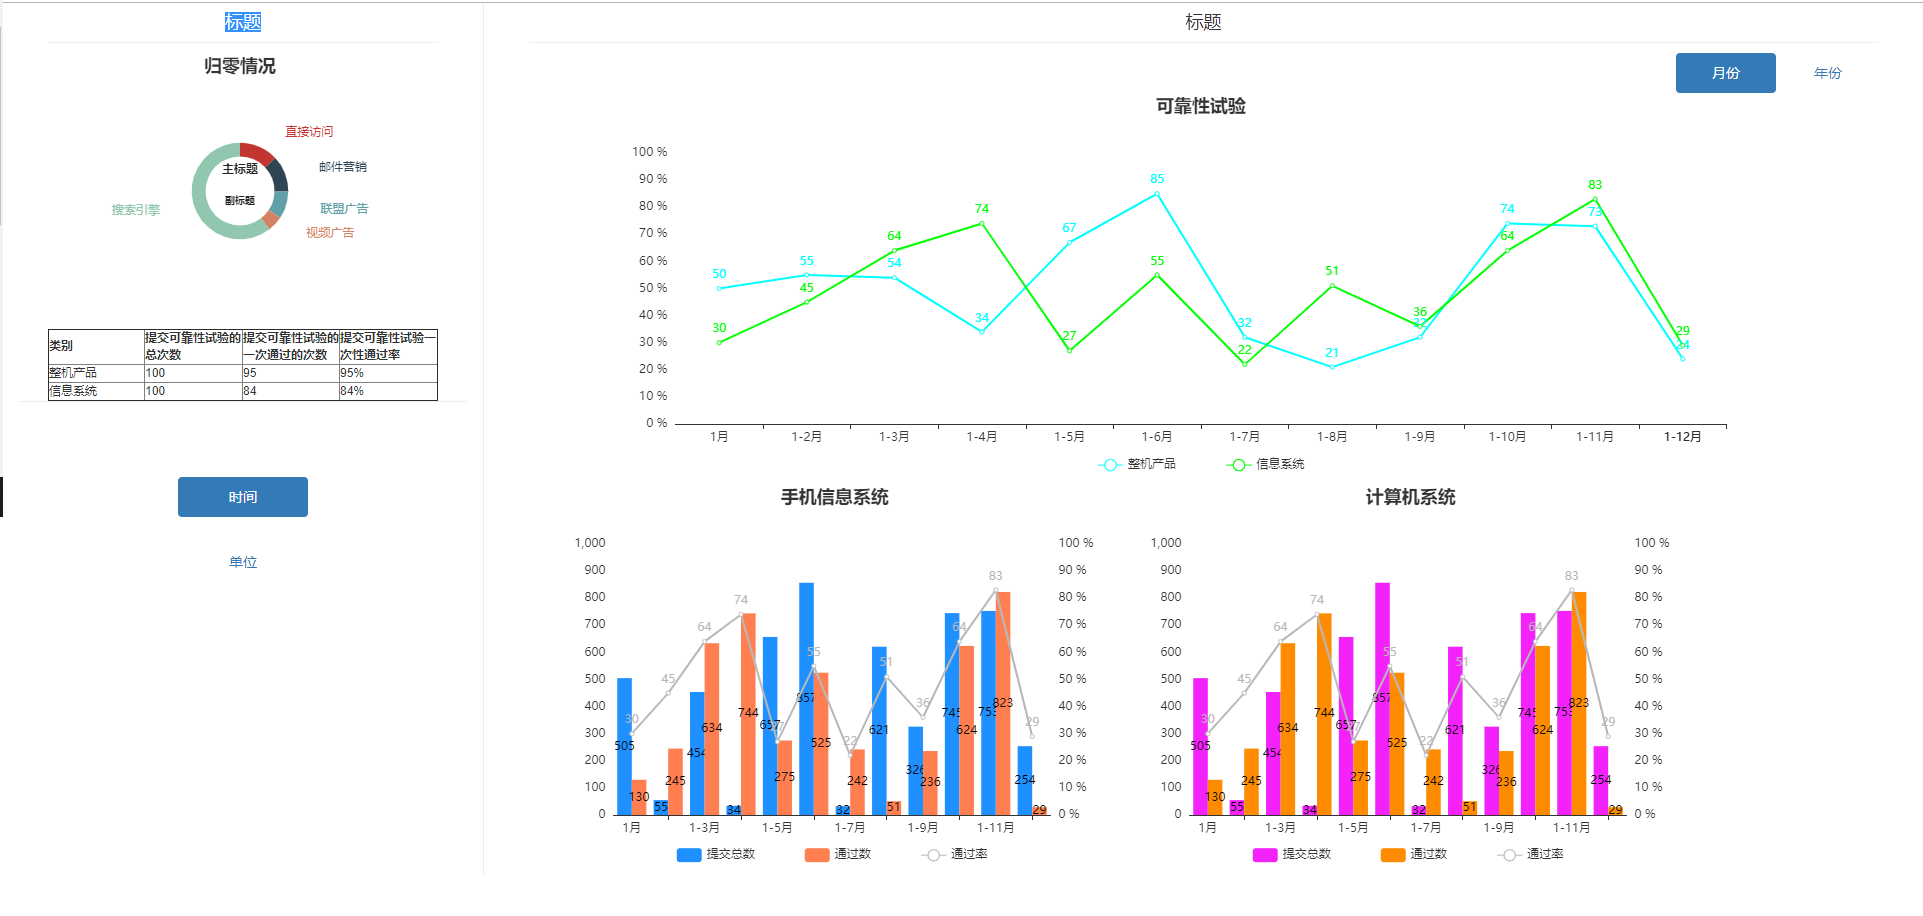
完整的案列1:
页面html
<!DOCTYPE html>
<html lang="zh-CN" xmlns:th="http://www.thymeleaf.org">
<head>
<th:block th:include="include :: header('饼图穿透')"/>
<style type="text/css">
.page-header {
padding: 0;
margin: 0 0 10px;
color: #333;
}
.left-bottom {
margin-top: 50px;
}
.left-bottom > ul > li {
margin-top: 25px;
}
.right-top-tab > li {
width: 100px;
}
/*!*定义类名为.thead-blue的样式*!*/
/*.table .thead-blue th {*/
/* color: #fff;*/
/* background-color: #3195f1;*/
/* border-color: #0d7adf;*/
/*}*/
</style>
</head>
<body class="gray-bg">
<div class="container-div ui-layout-center">
<div class="row">
<div class="col-sm-12">
<!--左-->
<div class="col-sm-3">
<!--上-->
<div class="col-sm-12">
<div class="col-sm-12">
<div class="page-header text-center">
<h4>标题</h4>
</div>
<div>
<div id="div_circular" style="height: 90%"></div><!--echarts图-->
</div>
<div>
<table id="top_table" border="1" style="font-size: 10px;">
<thead>
<tr>
<th style="width: 100px;">类别</th>
<th style="width: 100px;">提交可靠性试验的总次数</th>
<th style="width: 100px;">提交可靠性试验的一次通过的次数</th>
<th style="width: 100px;">提交可靠性试验一次性通过率</th>
</tr>
</thead>
<tbody>
<tr>
<td>整机产品</td>
<td>100</td>
<td>95</td>
<td>95%</td>
</tr>
<tr>
<td>信息系统</td>
<td>100</td>
<td>84</td>
<td>84%</td>
</tr>
</tbody>
</table>
</div>
</div>
</div>
<!--下-->
<div class="col-sm-12" style="border-top:1px solid #eee;">
<div class="left-bottom" align="center">
<ul class="nav nav-pills nav-stacked" style="width: 130px">
<li class="active"><a href="#div_timeTab" data-toggle="tab">时间</a></li>
<li><a href="#div_unitTab" data-toggle="tab">单位</a></li>
</ul>
</div>
</div>
</div>
<!--右-->
<div class="col-sm-9" style="border-left:1px solid #eee;">
<div class="col-sm-12">
<div class="tab-content">
<!--时间-->
<div id="div_timeTab" class="active tab-pane">
<div class="col-sm-12">
<div class="page-header text-center">
<h4>标题</h4>
</div>
</div>
<div class="col-sm-12">
<ul class="nav nav-pills pull-right text-center right-top-tab">
<li class="active"><a href="#div_monthTab" data-toggle="tab">月份</a></li>
<li><a href="#div_yearTab" data-toggle="tab">年份</a></li>
</ul>
<div id="mytab-content" class="tab-content">
<div id="div_monthTab" class="tab-pane fade in active">
<div class="col-sm-12" id="div_month1"></div>
<div class="col-sm-12">
<div class="col-sm-6" id="div_month2"></div>
<div class="col-sm-6" id="div_month3"></div>
</div>
</div>
<div id="div_yearTab" class="tab-pane fade">
<div class="col-sm-12" id="div_year" style="margin-top: 10px;"></div>
</div>
</div>
</div>
</div>
<!--单位-->
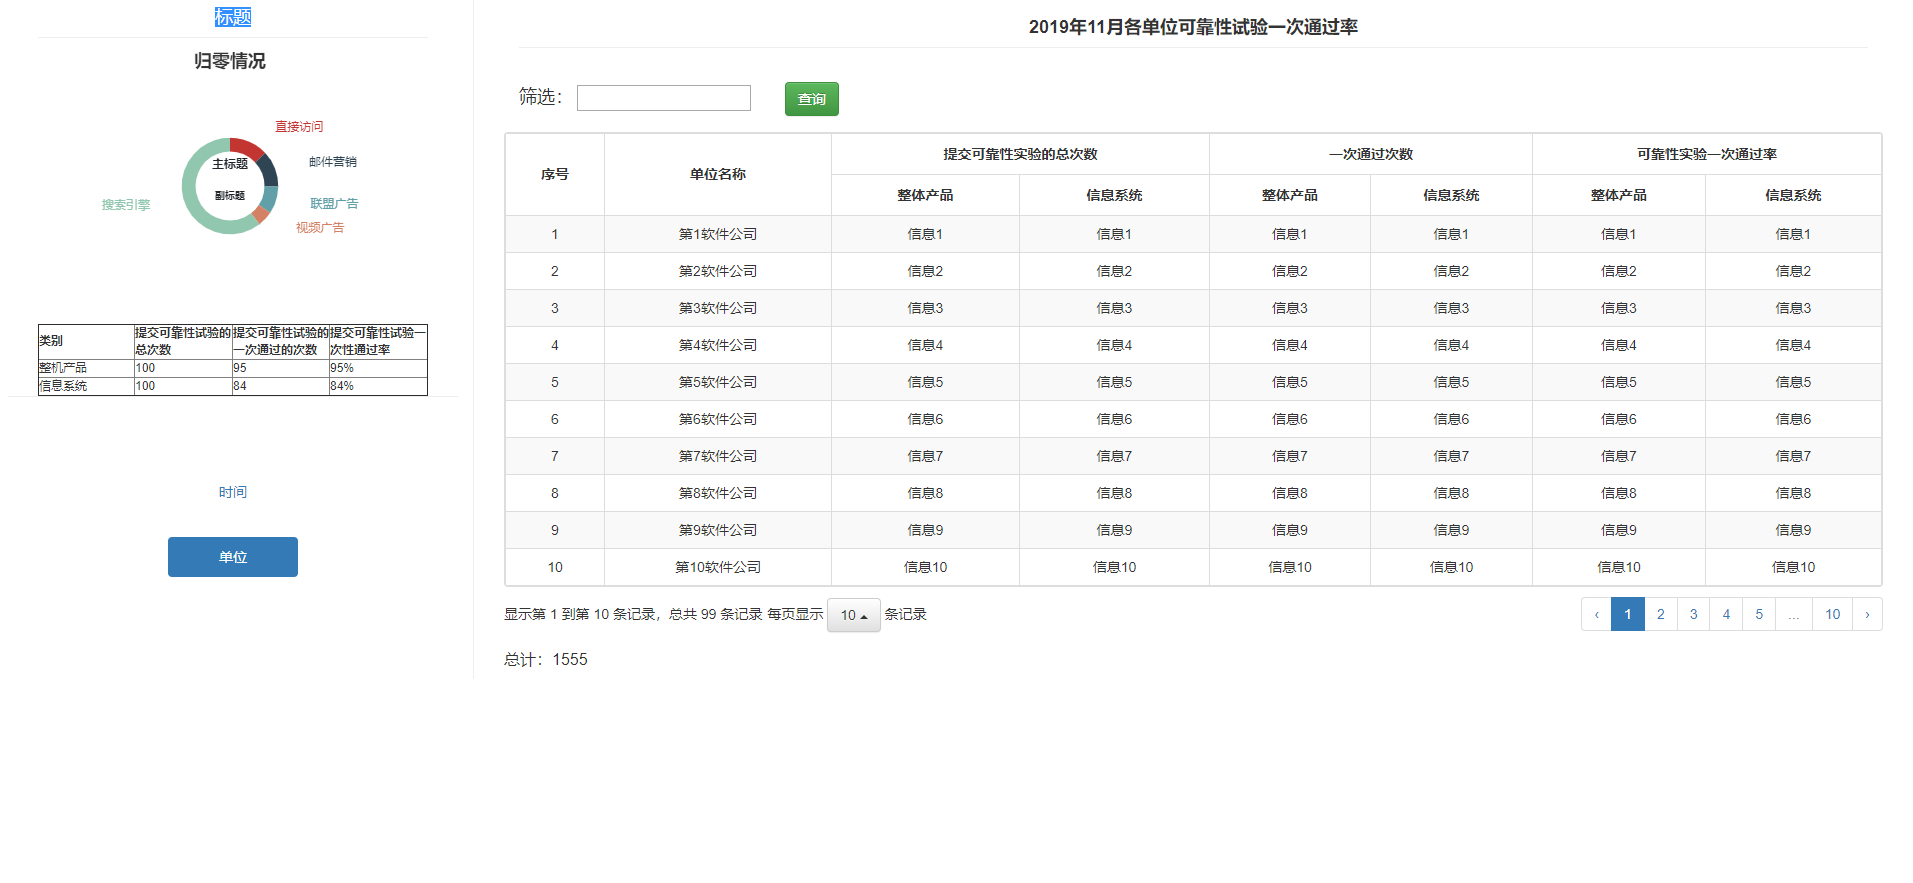
<div id="div_unitTab" class="tab-pane">
<div class="col-sm-12">
<div class="page-header text-center">
<h4 id="h4_title" style="font-weight:bold;">2019年11月各单位可靠性试验一次通过率</h4>
</div>
</div>
<div class="col-sm-12" style="margin-bottom: 10px;margin-top: 20px;">
<label><h4>筛选:</h4></label>
<input type="text" id="input_tname">
<button class="btn btn-success" id="button_query" style="margin-left: 30px;">查询</button>
</div>
<table id="div_table"></table>
<table class="table-count" style="margin-top: 3px;margin-bottom:8px;">
<tr>
<td style="font-size: 16px;">总计:<span id="span_count">1555</span></td>
</tr>
</table>
</div>
</div>
</div>
</div>
</div>
</div>
</div>
<th:block th:include="include :: footer"/>
<script th:src="@{/common/echarts/echarts.js}"></script>
<script th:src="@{/js/report/columnar.js}"></script>
</body>
</html>
echarts 对应js:
$(function () {
//动态赋值宽和高
$("#div_circular").css("height", $(window).height() * 0.30).css("width", $(window).width() * 0.20);
$("#div_month1").css("height", $(window).height() * 0.85 / 2).css("width", $(window).width() * 0.70);
$("#div_month2").css("height", $(window).height() * 0.85 / 2).css("width", $(window).width() * 0.60 / 2);
$("#div_month3").css("height", $(window).height() * 0.85 / 2).css("width", $(window).width() * 0.60 / 2);
$("#div_year").css("height", $(window).height() * 0.85).css("width", $(window).width() * 0.70);
$(window).resize(function () {
$("#div_month1").css("height", $(window).height() * 0.85 / 2).css("width", $(window).width() * 0.70);
$("#div_month2").css("height", $(window).height() * 0.85 / 2).css("width", $(window).width() * 0.60 / 2);
$("#div_month3").css("height", $(window).height() * 0.85 / 2).css("width", $(window).width() * 0.60 / 2);
$("#div_year").css("height", $(window).height() * 0.85).css("width", $(window).width() * 0.70);
$("#div_circular").css("height", $(window).height() * 0.30).css("width", $(window).width() * 0.20);
});
initTopEcharts();//初始化echarts
initMonth1Echarts();
initMonth2Echarts();
initMonth3Echarts();
initEcharts();//年份
initTable();//初始化表格
});
//echarts 左上图表
function initTopEcharts() {
var myChart = echarts.init(document.getElementById('div_circular'));
$.ajax({
type: 'post',//请求方式
url: ctx + '/report/echarts/dataEchartsYear',//url
//data:{'norm':"净利润",'year':year(),'currentmonth':currentmonth(),'lastmonth':lastmonth()},
success: function (resp) {
if (resp.success) {
var tatilData = [];
var data = resp.data;
for (var i = 0; i < data.length; i++) {
tatilData.push(data[i].name)
}
var option = {
tooltip: {show: false},
title: {
text: '归零情况',
left: 'center'
},
grid: {
top: '1',
left: '4',
right: '4',
bottom: '5',
containLabel: true
},
// legend: {
// orient: 'vertical',
// x: 'left',
// data:['直接访问','邮件营销','联盟广告','视频广告','搜索引擎']
// },
graphic: [{ // 环形图中间添加文字
type: 'text', // 通过不同top值可以设置上下显示
left: 'center',
top: '40%',
style: {
text: "主标题", //(自己设置显示内容),
textAlign: 'center',
fill: '#212529', // 文字的颜色
fontFamily: 'Microsoft YaHei',
fontSize: 12,
fontStyle: 'bold'
}
}, {
type: 'text',
left: 'center',
top: '52%',
style: {
text: "副标题",
textAlign: 'center',
fill: "c51200",
fontFamily: 'Microsoft YaHei',
fontSize: 10,
fontStyle: 'bold'
}
}],
series: [{
type: 'pie',
radius: ['25%', '35%'],
center: ['50%', '50%'],//饼图的位置
legendHoverLink: false,
hoverAnimation: false,
avoidLabelOverlap: false,
label: {
normal: {
//show: false,
//position: 'center'
}
},
labelLine: {
normal: {
show: false
}
},
data: [
{value: 335, name: '直接访问'},
{value: 310, name: '邮件营销'},
{value: 234, name: '联盟广告'},
{value: 135, name: '视频广告'},
{value: 1548, name: '搜索引擎'}
]
}]
};
// 使用刚指定的配置项和数据显示图表。
myChart.setOption(option, true);
$(window).resize(function () {
myChart.resize();
});
} else {
alert(resp.message);
}
}
})
}
//echarts month1 上图表
function initMonth1Echarts() {
var myChart = echarts.init(document.getElementById('div_month1'));
$.ajax({
type: 'post',//请求方式
url: ctx + '/report/echarts/dataEchartsYear',//url
//data:{'norm':"净利润",'year':year(),'currentmonth':currentmonth(),'lastmonth':lastmonth()},
success: function (resp) {
if (resp.success) {
var tatilData = [];
var data = resp.data;
for (var i = 0; i < data.length; i++) {
tatilData.push(data[i].name)
}
var option = {
title: {
text: '可靠性试验',
left: 'center'
},
tooltip: {
trigger: 'axis',
axisPointer: {// 坐标轴指示器,坐标轴触发有效
type: 'cross', // 默认为直线,可选为:'line' | 'shadow'
crossStyle: {
color: '#999'
}
}
},
legend: [
{
bottom: '2%',//位置
x: 'center',//居中
itemGap: 50,//间距
data: ['整机产品', '信息系统']
}
],
xAxis: [
{
type: 'category',
data: ['1月', '1-2月', '1-3月', '1-4月', '1-5月', '1-6月', '1-7月', '1-8月', '1-9月', '1-10月', '1-11月', '1-12月'],
axisPointer: {
type: 'shadow'
},
axisLabel: {
interval: 0,
rotate: 0//旋转度数
}
}
],
yAxis: {
type: 'value',
interval: 10,
"splitLine": { //网格线
"show": false
},
"axisTick": { //y轴刻度线
"show": false
},
"axisLine": { //y轴
"show": false
},
axisLabel: {
formatter: '{value} %'
}
},
color: ['#00FFFF', '#00FF00'],
series: [
{
name: '整机产品',
itemStyle: {normal: {label: {show: true}}},
type: 'line',
yAxisIndex: 0,
data: [50, 55, 54, 34, 67, 85, 32, 21, 32, 74, 73, 24]
},
{
name: '信息系统',
itemStyle: {normal: {label: {show: true}}},
type: 'line',
yAxisIndex: 0,
data: [30, 45, 64, 74, 27, 55, 22, 51, 36, 64, 83, 29]
}
]
};
// 使用刚指定的配置项和数据显示图表。
myChart.setOption(option, true);
$(window).resize(function () {
myChart.resize();
});
} else {
alert(resp.message);
}
}
})
}
//echarts month2 图表
function initMonth2Echarts() {
var myChart = echarts.init(document.getElementById('div_month2'));
$.ajax({
type: 'post',//请求方式
url: ctx + '/report/echarts/dataEchartsYear',//url
//data:{'norm':"净利润",'year':year(),'currentmonth':currentmonth(),'lastmonth':lastmonth()},
success: function (resp) {
if (resp.success) {
var tatilData = [];
var data = resp.data;
for (var i = 0; i < data.length; i++) {
tatilData.push(data[i].name)
}
var option = {
title: {
text: ' 手机信息系统',
left: 'center'
},
tooltip: {
trigger: 'axis',
axisPointer: {
type: 'cross',
crossStyle: {
color: '#999'
}
}
},
// toolbox: {
// feature: {
// dataView: {show: true, readOnly: false},
// magicType: {show: true, type: ['line', 'bar']},
// restore: {show: true},
// saveAsImage: {show: true}
// }
// },
legend: {
bottom: '2%',//位置
x: 'center',//居中
itemGap: 50,//间距
data: ['提交总数', '通过数', '通过率']
},
xAxis: [
{
type: 'category',
data: ['1月', '1-2月', '1-3月', '1-4月', '1-5月', '1-6月', '1-7月', '1-8月', '1-9月', '1-10月', '1-11月', '1-12月'],
axisPointer: {
type: 'shadow'
}
}
],
yAxis: [
{
type: 'value',
"splitLine": { //网格线
"show": false
},
"axisTick": { //y轴刻度线
"show": false
},
"axisLine": { //y轴
"show": false
},
interval: 100
},
{
type: 'value',
interval: 10,
"splitLine": { //网格线
"show": false
},
"axisTick": { //y轴刻度线
"show": false
},
"axisLine": { //y轴
"show": false
},
axisLabel: {
formatter: '{value} %'
}
}
],
color: ['#1e90ff', '#ff7f50', '#b8b8b8'],
series: [
{
name: '提交总数',
itemStyle: {
normal: {
label: {
show: true, //开启显示
//position: 'top', //在上方显示
textStyle: { //数值样式
color: 'black',
fontSize: 12
}
}
}
},
type: 'bar',
barGap: '0',
data: [505, 55, 454, 34, 657, 857, 32, 621, 326, 745, 753, 254]
},
{
name: '通过数',
itemStyle: {
normal: {
label: {
show: true, //开启显示
textStyle: { //数值样式
color: 'black',
fontSize: 12
}
}
}
},
type: 'bar',
data: [130, 245, 634, 744, 275, 525, 242, 51, 236, 624, 823, 29]
},
{
name: '通过率',
itemStyle: {normal: {label: {show: true}}},
type: 'line',
yAxisIndex: 1,
data: [30, 45, 64, 74, 27, 55, 22, 51, 36, 64, 83, 29]
}
]
};
// 使用刚指定的配置项和数据显示图表。
myChart.setOption(option, true);
$(window).resize(function () {
myChart.resize();
});
} else {
alert(resp.message);
}
}
})
}
// //echarts month13 图表
function initMonth3Echarts() {
var myChart = echarts.init(document.getElementById('div_month3'));
$.ajax({
type: 'post',//请求方式
url: ctx + '/report/echarts/dataEchartsYear',//url
//data:{'norm':"净利润",'year':year(),'currentmonth':currentmonth(),'lastmonth':lastmonth()},
success: function (resp) {
if (resp.success) {
var tatilData = [];
var data = resp.data;
for (var i = 0; i < data.length; i++) {
tatilData.push(data[i].name)
}
var option = {
title: {
text: ' 计算机系统',
left: 'center'
},
tooltip: {
trigger: 'axis',
axisPointer: {
type: 'cross',
crossStyle: {
color: '#999'
}
}
},
// toolbox: {
// feature: {
// dataView: {show: true, readOnly: false},
// magicType: {show: true, type: ['line', 'bar']},
// restore: {show: true},
// saveAsImage: {show: true}
// }
// },
legend: {
bottom: '2%',//位置
x: 'center',//居中
itemGap: 50,//间距
data: ['提交总数', '通过数', '通过率']
},
xAxis: [
{
type: 'category',
data: ['1月', '1-2月', '1-3月', '1-4月', '1-5月', '1-6月', '1-7月', '1-8月', '1-9月', '1-10月', '1-11月', '1-12月'],
axisPointer: {
type: 'shadow'
}
}
],
yAxis: [
{
type: 'value',
"splitLine": { //网格线
"show": false
},
"axisTick": { //y轴刻度线
"show": false
},
"axisLine": { //y轴
"show": false
},
interval: 100
},
{
type: 'value',
interval: 10,
"splitLine": { //网格线
"show": false
},
"axisTick": { //y轴刻度线
"show": false
},
"axisLine": { //y轴
"show": false
},
axisLabel: {
formatter: '{value} %'
}
}
],
color: ['#f321fa', '#FF8C00', '#b8b8b8'],
series: [
{
name: '提交总数',
itemStyle: {
normal: {
label: {
show: true, //开启显示
//position: 'top', //在上方显示
textStyle: { //数值样式
color: 'black',
fontSize: 12
}
}
}
},
type: 'bar',
barGap: '0',
data: [505, 55, 454, 34, 657, 857, 32, 621, 326, 745, 753, 254]
},
{
name: '通过数',
itemStyle: {
normal: {
label: {
show: true, //开启显示
textStyle: { //数值样式
color: 'black',
fontSize: 12
}
}
}
},
type: 'bar',
data: [130, 245, 634, 744, 275, 525, 242, 51, 236, 624, 823, 29]
},
{
name: '通过率',
itemStyle: {normal: {label: {show: true}}},
type: 'line',
yAxisIndex: 1,
data: [30, 45, 64, 74, 27, 55, 22, 51, 36, 64, 83, 29]
}
]
};
// 使用刚指定的配置项和数据显示图表。
myChart.setOption(option, true);
$(window).resize(function () {
myChart.resize();
});
} else {
alert(resp.message);
}
}
})
}
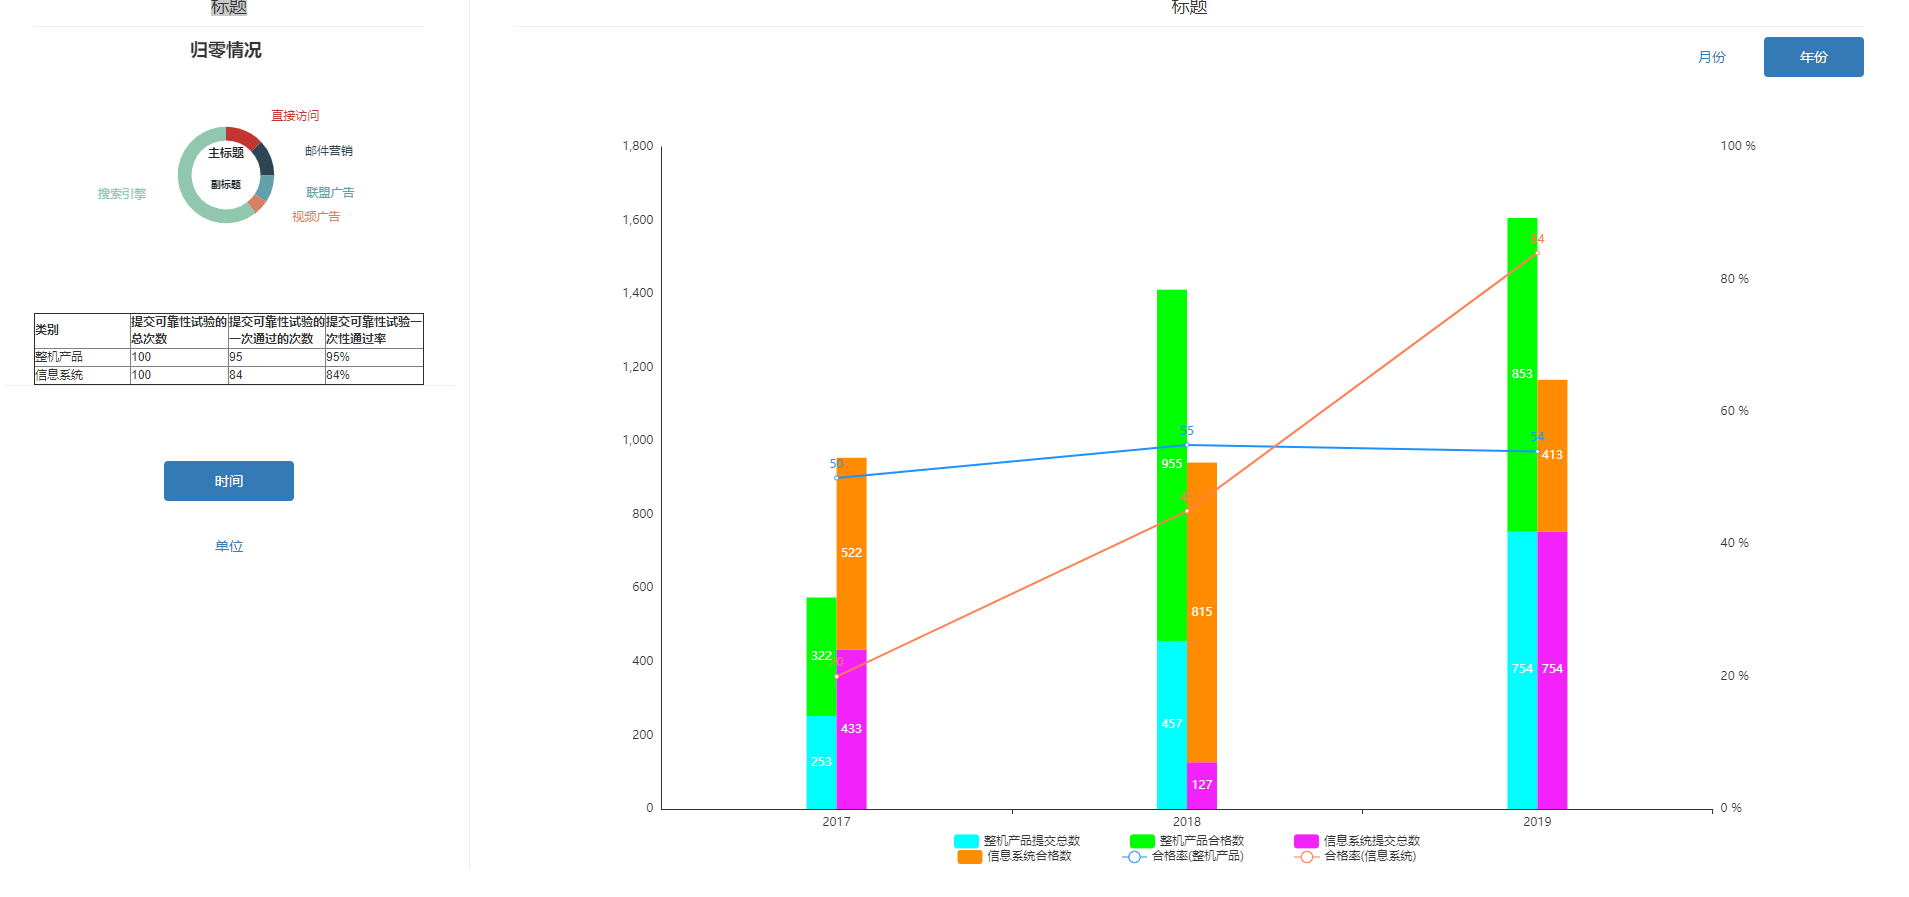
//年份
function initEcharts() {
var myChart = echarts.init(document.getElementById('div_year'));
$.ajax({
type: 'post',//请求方式
url: ctx + '/report/echarts/dataEcharts',//url
//data:{'norm':"净利润",'year':year(),'currentmonth':currentmonth(),'lastmonth':lastmonth()},
success: function (resp) {
if (resp.success) {
var tatilData = [];
var data = resp.data;
for (var i = 0; i < data.length; i++) {
tatilData.push(data[i].name)
}
var option = {
tooltip: {
trigger: 'axis',
axisPointer: {// 坐标轴指示器,坐标轴触发有效
type: 'cross', // 默认为直线,可选为:'line' | 'shadow'
crossStyle: {
color: '#999'
}
}
},
// toolbox: {
// feature: {
// dataView: {show: true, readOnly: false},
// magicType: {show: true, type: ['line', 'bar']},
// restore: {show: true},
// saveAsImage: {show: true}
// }
// },
// legend: [
// {
// bottom: '3%',//位置
// x: 'center',//居中
// itemGap: 50,//间距
// data: ['已技术归零', '已管理归零', '已双归零', '未归零']
// },
// {
// bottom: '0%',//位置
// x: 'center',//居中
// itemGap: 30,//间距
// data: ['占比(已技术归零)', '占比(已管理归零)', '占比(已双归零)', '占比(未归零)']
// }
// ],
legend: [
{
bottom: '2%',//位置
x: 'center',//居中
itemGap: 50,//间距
data: ['整机产品提交总数', '整机产品合格数', '信息系统提交总数']
},
{
bottom: '0%',//位置
x: 'center',//居中
itemGap: 50,//间距
data: ['信息系统合格数', '合格率(整机产品)', '合格率(信息系统)']
}
],
xAxis: [
{
type: 'category',
data: ['2017', '2018', '2019'],
axisPointer: {
type: 'shadow'
}
}
],
yAxis: [
{
type: 'value',
"splitLine": { //网格线
"show": false
},
"axisTick": { //y轴刻度线
"show": false
},
"axisLine": { //y轴
"show": true
},
interval: 200
},
{
type: 'value',
interval: 20,
"splitLine": { //网格线
"show": false
},
"axisTick": { //y轴刻度线
"show": false
},
"axisLine": { //y轴
"show": false
},
axisLabel: {
formatter: '{value} %'
}
}
],
color: ['#00FFFF', '#00FF00', '#f321fa', '#FF8C00', '#1e90ff', '#ff7f50', '#b8b8b8', '#b5423d'],
series: [
{
name: '整机产品提交总数',
stack: '整机产品',
barWidth: 30,//柱图宽度
itemStyle: {
normal: {
label: {
show: true, //开启显示
}
}
},
type: 'bar',
barGap: '0',
data: [253, 457, 754]
},
{
name: '整机产品合格数',
stack: '整机产品',
barWidth: 30,//柱图宽度
itemStyle: {
normal: {
label: {
show: true, //开启显示
}
}
},
type: 'bar',
data: [322, 955, 853]
},
{
name: '信息系统提交总数',
stack: '信息系统',
barWidth: 30,//柱图宽度
itemStyle: {
normal: {
label: {
show: true, //开启显示
}
}
},
type: 'bar',
barGap: '0',
data: [433, 127, 754]
},
{
name: '信息系统合格数',
stack: '信息系统',
barWidth: 30,//柱图宽度
itemStyle: {
normal: {
label: {
show: true, //开启显示
}
}
},
type: 'bar',
data: [522, 815, 413]
},
{
name: '合格率(整机产品)',
itemStyle: {normal: {label: {show: true}}},
type: 'line',
yAxisIndex: 1,
data: [50, 55, 54]
},
{
name: '合格率(信息系统)',
itemStyle: {normal: {label: {show: true}}},
type: 'line',
yAxisIndex: 1,
data: [20, 45, 84]
}
]
};
// 使用刚指定的配置项和数据显示图表。
myChart.setOption(option, true);
$(window).resize(function () {
myChart.resize();
});
} else {
alert(resp.message);
}
}
})
}
/* 初始table */
function initTable() {
// 初始化Table
var oTable = new tableInit();
oTable.init();
}
// 重置table数据
function resetScheduleLists() {
var oTable = new tableInit();
// 调度
oTable.resetScheduleLists();
}
/**
* 初始化 table 数据
*/
var tableInit = function () {
var tableVal = {};
// 重置表单数据
tableVal.resetScheduleLists = function () {
$('#div_table').bootstrapTable('destroy');
tableVal.init();
};
// 初始化表单数据
tableVal.init = function () {
var $table = $('#div_table');
$table.bootstrapTable({
url: ctx + '/report/echarts/dataTable',//url
method: 'post',//请求方式
undefinedText: '',// 当数据为undefined时显示的字符,默认是'-'
toolbar: 'false', // 工具按钮用哪个容器
toolbarAlign: 'false', // 工具按钮的位置
striped: false, // 是否显示行间隔色
striped: true, //是否显示行间隔色
queryParams: tableVal.queryParams, // 传递参数(*)
pagination: true,//是否分页
sidePagination: "client",//分页方式:client客户端分页,server服务端分页(*)
uniqueId: "tid", // 每一行的唯一标识,一般为主键列
showColumns: false,// 是否显示列的按钮
theadClasses: "thead-dark",//这里设置表头样式
classes: "table table-bordered table-striped table-sm table-dark",
pageSize: 10,
pageList: [10, 15, 30],
columns: [
[
{
title: '序号', valign: 'middle', halign: "center", align: 'center', rowspan: 2, formatter: function (value, row, index) {
return index + 1;
}
},
{field: 'tname', title: '单位名称', rowspan: 2, valign: 'middle', halign: "center", align: 'center'},
{title: '提交可靠性实验的总次数', colspan: 2, align: 'center', valign: 'middle', halign: "center", align: 'center'},
{title: '一次通过次数', colspan: 2, align: 'center', valign: 'middle', halign: "center", align: 'center'},
{title: '可靠性实验一次通过率', colspan: 2, align: 'center', valign: 'middle', halign: "center", align: 'center'},
],
[
{field: 'str1', title: '整体产品', align: 'center', halign: "center"},
{field: 'str2', title: '信息系统', align: 'center', halign: "center"},
{field: 'str3', title: '整体产品', align: 'center', halign: "center"},
{field: 'str4', title: '信息系统', align: 'center', halign: "center"},
{field: 'str5', title: '整体产品', align: 'center', halign: "center"},
{field: 'str6', title: '信息系统', align: 'center', halign: "center"}
]
],
responseHandler: function (resp) {
if (resp.success) {
return resp.data;
// return {rows: resp.data.rows, total: resp.data.total};
} else {
CommonJS.modal.msgError(resp.message);
}
return resp;
}
});
}
tableVal.getParams = function () {
var parameter = {
//名称
tname: $("#input_tname").val(),
};
return CommonJS.removeEmptyValue(parameter);
};
tableVal.getParams2 = function () {
var parameter = CommonJS.getParameterByFrom();
return CommonJS.removeEmptyValue(parameter);
};
// 得到查询的参数
tableVal.queryParams = function (params) {
// 定义返回对象
var parameter = tableVal.getParams();
parameter.pageNum = Math.round((params.offset + params.limit) / params.limit);
parameter.pageSize = params.limit;
// return JSON.stringify(parameter);
return parameter;
};
return tableVal;
}
/* 点击查询事件 */
$('#button_query').click(function () {
resetScheduleLists();
});
/*
合并行
@param data 原始数据(在服务端完成排序)
@param fieldName 合并属性名称数组
@param colspan 列数
@param target 目标表格对象
*/
function mergeCells(data, fieldName, colspan, target) {
if (data.length == 0) {
alert("不能传入空数据");
return;
}
var numArr = [];
var value = data[0][fieldName];
var num = 0;
for (var i = 0; i < data.length; i++) {
if (value != data[i][fieldName]) {
numArr.push(num);
value = data[i][fieldName];
num = 1;
continue;
}
num++;
}
if (typeof (value) != "undefined" && value != "") {
numArr.push(num);
}
var merIndex = 0;
for (var i = 0; i < numArr.length; i++) {
$(target).bootstrapTable('mergeCells',
{
index: merIndex,
field: fieldName,
colspan: colspan,
rowspan: numArr[i]
})
merIndex += numArr[i];
}
}
/**
* 合并列
* @param data 原始数据(在服务端完成排序)
* @param fieldName 合并属性数组
* @param target 目标表格对象
*/
function mergeColspan(data, fieldNameArr, target) {
if (data.length == 0) {
alert("不能传入空数据");
return;
}
if (fieldNameArr.length == 0) {
alert("请传入属性值");
return;
}
var num = -1;
var index = 0;
for (var i = 0; i < data.length; i++) {
num++;
for (var v in fieldNameArr) {
index = 1;
if (data[i][fieldNameArr[v]] != data[i][fieldNameArr[0]]) {
index = 0;
break;
}
}
if (index == 0) {
continue;
}
$(target).bootstrapTable('mergeCells', {index: num, field: fieldNameArr[0], colspan: fieldNameArr.length, rowspan: 1});
}
}
// function initEcharts(){
// var myChart = echarts.init(document.getElementById('div_bt'));
// var option = {
// title: {
// text: '质量事故与问题归零情况',
// left: 'center'
// },
// legend: {
// // orient: 'vertical',
// // top: 'middle',
// bottom: 10,
// left: 'center',
// data: ['已技术归零', '已管理归零', '已双归零', '未归零']
// },
// series: [
// {
// type: 'pie',
// radius: '65%',
// center: ['50%', '50%'],
// selectedMode: 'single',
// data: [
// {value: 1548, name: '已技术归零'},
// {value: 535, name: '已管理归零'},
// {value: 510, name: '已双归零'},
// {value: 634, name: '未归零'}
// ],
// itemStyle: {
// emphasis: {
// shadowBlur: 10,
// shadowOffsetX: 0,
// shadowColor: 'rgba(0, 0, 0, 0.5)'
// }
// }
// }
// ]
// };
// myChart.setOption(option, true);
// $(window).resize(function () {
// myChart.resize();
// });
// }
完整的案列2:
页面html
<!DOCTYPE html>
<html lang="zh-CN" xmlns:th="http://www.thymeleaf.org">
<head>
  <th:block th:include="include :: header('饼图穿透')"/>
  <style type="text/css">
    .page-header {
      padding: 0;
      margin: 0 0 10px;
      color: #333;
    }

    .left-bottom {
      margin-top: 50px;
    }

    .left-bottom > ul > li {
      margin-top: 25px;
    }

    .right-top-tab > li {
      width: 100px;
    }
    /*!*定义类名为.thead-blue的样式*!*/
    /*.table .thead-blue th {*/
    /*  color: #fff;*/
    /*  background-color: #3195f1;*/
    /*  border-color: #0d7adf;*/
    /*}*/
  </style>

</head>

<body class="gray-bg">
<div class="container-div ui-layout-center">
  <div class="col-sm-12">
    <!--左-->
    <div class="col-sm-3">
      <!--上-->
      <!--      <div class="col-sm-12">-->
      <!--        <div class="page-header text-center">-->
      <!--          <h4 id="h4_title3" style="font-weight:bold;"></h4>-->
      <!--        </div>-->
      <!--      </div>-->
      <div class="col-sm-12" style="margin-top: 10px;">
        <div id="div_pie"></div><!--echarts图-->
      </div>
      <!--下-->
      <div class="col-sm-12" style="border-top:1px solid #eee;">
        <div class="left-bottom" align="center">
          <ul class="nav nav-pills nav-stacked" style="width: 130px">
            <li class="active"><a href="#div_timeTab" data-toggle="tab">时间</a></li>
            <li><a href="#div_unitTab" data-toggle="tab">单位</a></li>
          </ul>
        </div>
      </div>
    </div>
    <!--右-->
    <div class="col-sm-9" style="border-left:1px solid #eee;">
      <div class="col-sm-12">
        <div class="tab-content">
          <!--时间-->
          <div id="div_timeTab" class="active tab-pane">
            <div class="col-sm-12">
              <div class="page-header text-center">
                <h4 id="h4_title2" style="font-weight:bold;"></h4>
              </div>
            </div>
            <div class="col-sm-12">
              <ul class="nav nav-pills pull-right text-center right-top-tab">
                <li class="active"><a href="#div_monthTab" data-toggle="tab" id="month">月份</a></li>
                <li><a href="#div_yearTab" data-toggle="tab" id="year">年份</a></li>
              </ul>
              <div id="mytab-content" class="tab-content">
                <div id="div_monthTab" class="tab-pane fade in active">
                  <div class="col-sm-12" id="div_month" style="margin-top: 10px;"></div>
                </div>
                <div id="div_yearTab" class="tab-pane fade">
                  <div class="col-sm-12" id="div_year" style="margin-top: 10px;"></div>
                </div>
              </div>
            </div>
          </div>
          <!--单位-->
          <div id="div_unitTab" class="tab-pane">
            <div class="col-sm-12">
              <div class="page-header text-center">
                <h4 id="h4_title" style="font-weight:bold;"></h4>
              </div>
            </div>
            <div class="col-sm-12" style="margin-bottom: 10px;margin-top: 20px;">
              <label><h4>筛选:</h4></label>
              <input type="text" id="input_tname">
              <button class="btn btn-success" id="button_query" style="margin-left: 30px;">查询</button>
            </div>
            <table id="div_table"></table>
            <table class="table-count" style="margin-top: 3px;margin-bottom:8px;">
              <tr>
                <td style="font-size: 16px;">总计:<span id="span_count">1555</span></td>
              </tr>
            </table>
          </div>
        </div>
      </div>
    </div>
  </div>
</div>
<th:block th:include="include :: footer"/>
<script th:src="@{/common/echarts/echarts.js}"></script>
<script th:src="@{/js/report/pieEchart.js}"></script>
</body>
</html>
页面对应js
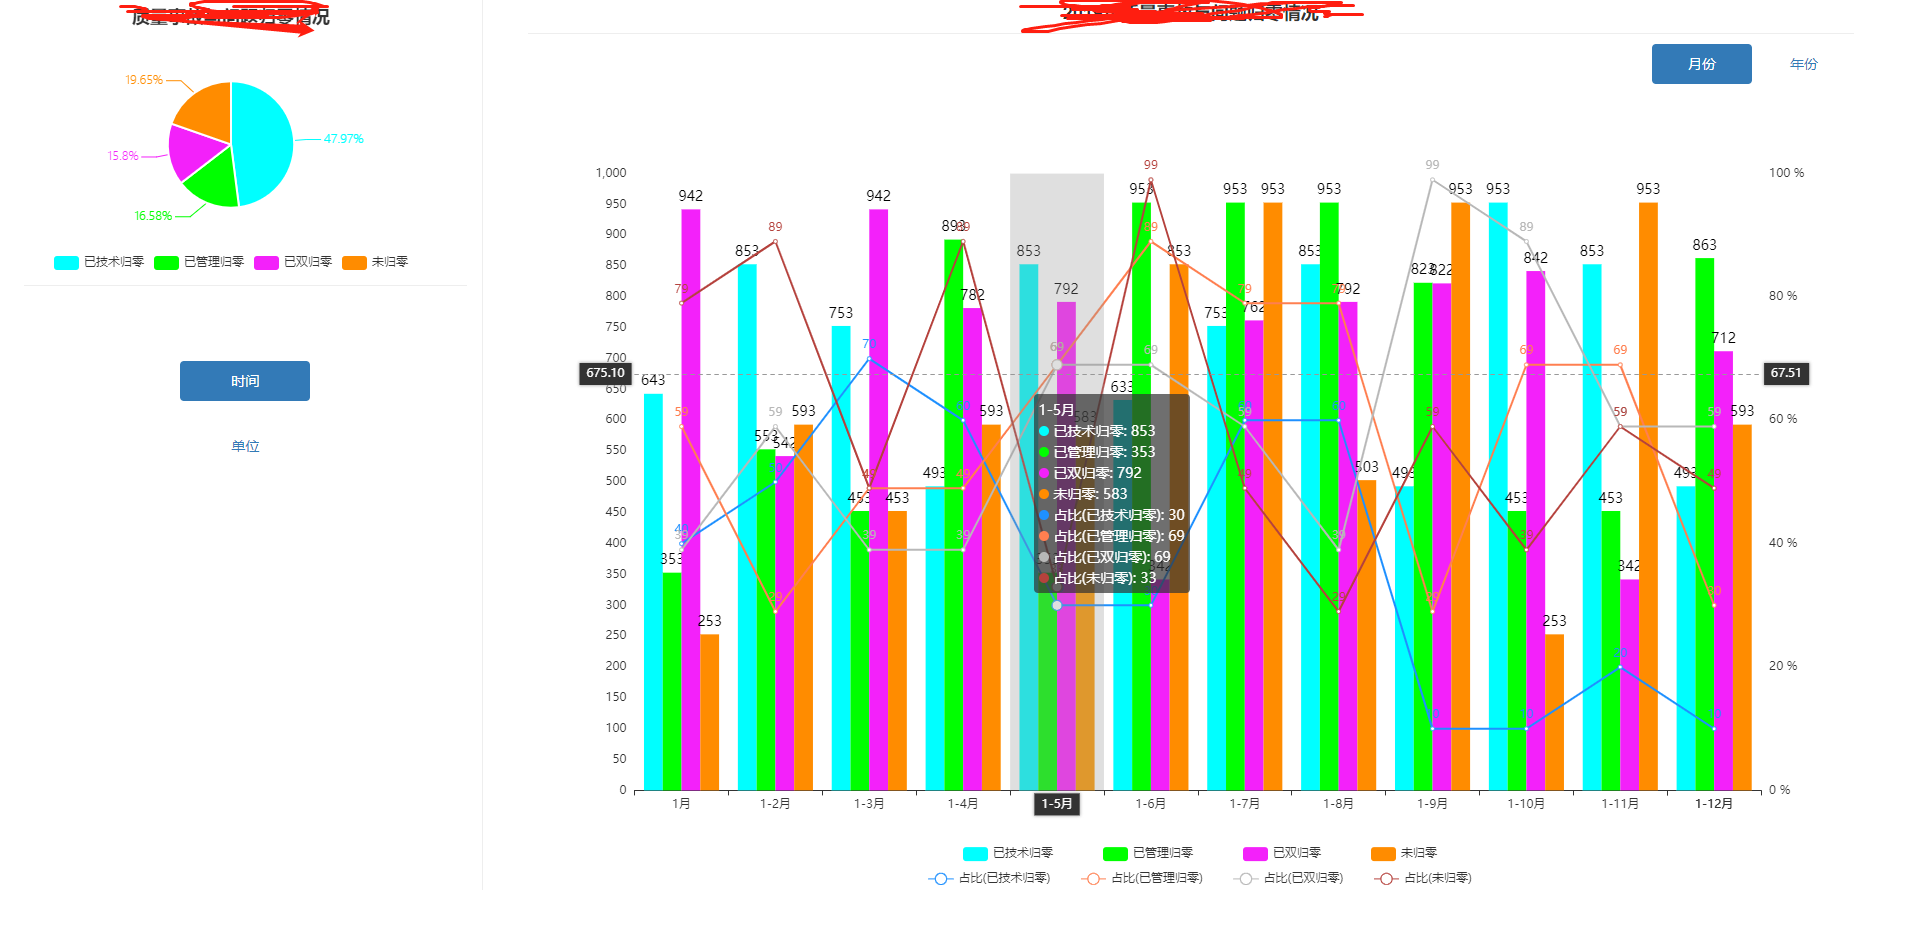
$(function () { $("#div_month").css("height", $(window).height() * 0.85).css("width", $(window).width() * 0.70); $("#div_year").css("height", $(window).height() * 0.85).css("width", $(window).width() * 0.70); $("#div_pie").css("height", $(window).height() * 0.30).css("width", $(window).width() * 0.20); // $("#table-count").css("height", $(window).height() * 0.10); $(window).resize(function () { $("#div_month").css("height", $(window).height() * 0.85).css("width", $(window).width() * 0.70); $("#div_year").css("height", $(window).height() * 0.85).css("width", $(window).width() * 0.70); $("#div_pie").css("height", $(window).height() * 0.30).css("width", $(window).width() * 0.20); }); initEcharts();//初始化echarts(左上角饼图) initTable();//初始化表格(单位) initColumnMonthEcharts();//月份的柱图 initColumnYearEcharts(); }); //echarts 图表 function initEcharts() { var myChart = echarts.init(document.getElementById('div_pie')); $.ajax({ type: 'post',//请求方式 url: ctx + '/report/echarts/dataEcharts',//url //data:{'norm':"净利润",'year':year(),'currentmonth':currentmonth(),'lastmonth':lastmonth()}, success: function (resp) { $("#h4_title3").html('质量事故与问题归零情况'); if (resp.success) { var tatilData = []; var data = resp.data; for (var i = 0; i < data.length; i++) { tatilData.push(data[i].name) } var option = { title: { text: '质量事故与问题归零情况', left: 'center' }, tooltip: { trigger: 'item', formatter: "{a} <br/>{b}: {c} ({d}%)" }, // grid: { // top: 'center', // left: 'center', // right: 'center', // bottom: 'center', // containLabel: true // }, // legend: [ // { // // orient: 'vertical', // // top: 'middle', // bottom: 8, // x: 'center', // data: ['已技术归零', '已管理归零'] // }, // { // // orient: 'vertical', // // top: 'middle', // bottom: 26, // x: 'center', // data: ['已双归零', '未归零'] // } // ], legend: [ { //orient: 'vertical', // top: 'middle', bottom: 10, left: 'center', data: ['已技术归零', '已管理归零', '已双归零', '未归零'] } ], calculable: true, series: [ { name: '归零百分比', type: 'pie', radius: '45%',//饼图的半径大小 center: ['50%', '50%'],//饼图的位置 minAngle: 0, // 最小角度改为0 selectedOffset: 10, // 选中是扇区偏移量 selectedMode: 'single', label: { //饼图图形上的文本标签 normal: { show: true, length: 2,//标签线长度 position: 'outer', //标签的位置(圈外-outer, 圈中-inner) textStyle: { fontWeight: 120, fontSize: 12 //文字的字体大小 }, formatter: '{d}%' // 显示的数据 } }, // label: { // normal: { // position: 'inner', // show: false, // textStyle: { // fontWeight: 120, // fontSize: 12 //文字的字体大小 // }, // formatter: '{d}%' // } // }, data: data, itemStyle: { normal: {//设置饼图各块之间的间隙 borderWidth: 2, borderColor: '#ffffff', color: function (params) { //自定义颜色 var colorList = [ '#00FFFF', '#00FF00', '#f321fa', '#FF8C00', ]; return colorList[params.dataIndex] } }, emphasis: { shadowBlur: 10, shadowOffsetX: 0, shadowColor: 'rgba(0, 0, 0, 0.5)' } } } ] }; // 使用刚指定的配置项和数据显示图表。 myChart.setOption(option, true); $(window).resize(function () { myChart.resize(); }); } else { alert(resp.message); } } }) } /* 初始table */ function initTable() { // 初始化Table var oTable = new tableInit(); oTable.init(); } // 重置table数据 function resetScheduleLists() { var oTable = new tableInit(); // 调度 oTable.resetScheduleLists(); } //当浏览器大小变化时 动态修改table 高度 // $(window).resize(function () { // $('#div_table').bootstrapTable('resetView', { // height: $(window).height() - 355 // }); // }); /** * 初始化 table 数据 */ var tableInit = function () { var tableVal = {}; // 重置表单数据 tableVal.resetScheduleLists = function () { $('#div_table').bootstrapTable('destroy'); tableVal.init(); }; $("#h4_title").html(year() + '年各单位质量事故与问题归零情况'); // 初始化表单数据 tableVal.init = function () { var $table = $('#div_table'); $table.bootstrapTable({ url: ctx + '/report/echarts/dataTable',//url method: 'post',//请求方式 undefinedText: '',// 当数据为undefined时显示的字符,默认是'-' toolbar: 'false', // 工具按钮用哪个容器 toolbarAlign: 'false', // 工具按钮的位置 striped: false, // 是否显示行间隔色 striped: true, //是否显示行间隔色 queryParams: tableVal.queryParams, // 传递参数(*) pagination: true,//是否分页 sidePagination: "client",//分页方式:client客户端分页,server服务端分页(*) uniqueId: "tid", // 每一行的唯一标识,一般为主键列 showColumns: false,// 是否显示列的按钮 pageSize: 15, columns: [ [ { title: '序号', valign: 'middle', halign: "center", align: 'center', rowspan: 2, formatter: function (value, row, index) { return index + 1; } }, {field: 'tname', title: '单位名称', rowspan: 2, valign: 'middle', halign: "center", align: 'center'}, {title: '问题发生率', colspan: 3, align: 'center', valign: 'middle', halign: "center", align: 'center'}, {title: 'A类问题发生率', colspan: 3, align: 'center', valign: 'middle', halign: "center", align: 'center'}, {title: 'B类问题发生率', colspan: 3, align: 'center', valign: 'middle', halign: "center", align: 'center'}, {title: 'C类问题发生率', colspan: 3, align: 'center', valign: 'middle', halign: "center", align: 'center'} ], [ {field: 'str1', title: '整体产品', align: 'center', halign: "center"}, {field: 'str2', title: '信息系统', align: 'center', halign: "center"}, {field: 'str3', title: '元器件', align: 'center', halign: "center"}, {field: 'str4', title: '整体产品', align: 'center', halign: "center"}, {field: 'str5', title: '信息系统', align: 'center', halign: "center"}, {field: 'str6', title: '元器件', align: 'center', halign: "center"}, {field: 'str7', title: '整体产品', align: 'center', halign: "center"}, {field: 'str8', title: '信息系统', align: 'center', halign: "center"}, {field: 'str9', title: '元器件', align: 'center', halign: "center"}, {field: 'str10', title: '整体产品', align: 'center', halign: "center"}, {field: 'str11', title: '信息系统', align: 'center', halign: "center"}, {field: 'str12', title: '元器件', align: 'center', halign: "center"} ] ], responseHandler: function (resp) { if (resp.success) { return resp.data; // return {rows: resp.data.rows, total: resp.data.total}; } else { CommonJS.modal.msgError(resp.message); } return resp; }, onLoadSuccess: function (data) { $("#div_table>thead").css("background", "#337ab7"); $("#div_table>thead").css("color", "white") // $("#div_table").on('load-success.bs.table', function (data) { // $('#div_table').bootstrapTable('resetView', { // height: $(window).height() - 355 // }); // }); } }); } tableVal.getParams = function () { var parameter = { //名称 tname: $("#input_tname").val(), }; return CommonJS.removeEmptyValue(parameter); }; tableVal.getParams2 = function () { var parameter = CommonJS.getParameterByFrom(); return CommonJS.removeEmptyValue(parameter); }; // 得到查询的参数 tableVal.queryParams = function (params) { // 定义返回对象 var parameter = tableVal.getParams(); parameter.pageNum = Math.round((params.offset + params.limit) / params.limit); parameter.pageSize = params.limit; // return JSON.stringify(parameter); return parameter; }; return tableVal; } /* 点击查询事件 */ $('#button_query').click(function () { resetScheduleLists(); }); //月份h4 赋值 $("#month").click(function () { $("#h4_title2").html(year() + '年质量事故与问题归零情况'); }) //年份h4 赋值 $("#year").click(function () { $("#h4_title2").html((year() - 2) + '-' + year() + '年质量事故与问题归零情况'); }) //月份柱图 function initColumnMonthEcharts() { var myChart = echarts.init(document.getElementById('div_month')); $.ajax({ type: 'post',//请求方式 url: ctx + '/report/echarts/dataEchartsMonth',//url //data:{'norm':"净利润",'year':year(),'currentmonth':currentmonth(),'lastmonth':lastmonth()}, success: function (resp) { if (resp.success) { var tatilData = []; var yjsglData = []; var yglglData = []; var ysglData = []; var wglData = []; var yjsglzbData = []; var yglglzbData = []; var ysglzbData = []; var wglzbData = []; var data = resp.data; for (var i = 0; i < data.length; i++) { tatilData.push(data[i].month) yjsglData.push(data[i].yjsgl); yglglData.push(data[i].yglgl); ysglData.push(data[i].ysgl); wglData.push(data[i].wgl); yjsglzbData.push(data[i].yjsglzb); yglglzbData.push(data[i].yglglzb); ysglzbData.push(data[i].ysglzb); wglzbData.push(data[i].wglzb); } $("#h4_title2").html(year() + '年质量事故与问题归零情况'); var option = { // title: { // text: year() + '年质量事故与问题归零情况', // left: 'center' // }, grid: { top: '10%', left: '4%', right: '4%', bottom: '10%', containLabel: true }, tooltip: { trigger: 'axis', axisPointer: { type: 'cross', crossStyle: { color: '#999' } } }, //右上角导出切换图标 // toolbox: { // feature: { // dataView: {show: true, readOnly: false}, // magicType: {show: true, type: ['line', 'bar']}, // restore: {show: true}, // saveAsImage: {show: true} // } // }, legend: [ { bottom: '3%',//位置 x: 'center',//居中 itemGap: 50,//间距 data: ['已技术归零', '已管理归零', '已双归零', '未归零'] }, { bottom: '0%',//位置 x: 'center',//居中 itemGap: 30,//间距 data: ['占比(已技术归零)', '占比(已管理归零)', '占比(已双归零)', '占比(未归零)'] } ], xAxis: [ { type: 'category', data: ['1月', '1-2月', '1-3月', '1-4月', '1-5月', '1-6月', '1-7月', '1-8月', '1-9月', '1-10月', '1-11月', '1-12月'], axisPointer: { type: 'shadow' }, axisLabel: { interval: 0, rotate: 0//旋转度数 } } ], yAxis: [ { type: 'value', "splitLine": { //网格线 "show": false }, "axisTick": { //y轴刻度线 "show": false }, "axisLine": { //y轴 "show": false }, interval: 50 }, { type: 'value', interval: 20, "splitLine": { //网格线 "show": false }, "axisTick": { //y轴刻度线 "show": false }, "axisLine": { //y轴 "show": false }, axisLabel: { formatter: '{value} %' } } ], color: ['#00FFFF', '#00FF00', '#f321fa', '#FF8C00', '#1e90ff', '#ff7f50', '#b8b8b8', '#b5423d'], series: [ { name: '已技术归零', itemStyle: { normal: { label: { show: true, //开启显示 position: 'top', //在上方显示 textStyle: { //数值样式 color: 'black', fontSize: 14 } } } }, type: 'bar', barGap: '0', data: yjsglData }, { name: '已管理归零', itemStyle: { normal: { label: { show: true, //开启显示 position: 'top', //在上方显示 textStyle: { //数值样式 color: 'black', fontSize: 14 } } } }, type: 'bar', data: yglglData }, { name: '已双归零', itemStyle: { normal: { label: { show: true, //开启显示 position: 'top', //在上方显示 textStyle: { //数值样式 color: 'black', fontSize: 14 } } } }, type: 'bar', data: ysglData }, { name: '未归零', itemStyle: { normal: { label: { show: true, //开启显示 position: 'top', //在上方显示 textStyle: { //数值样式 color: 'black', fontSize: 14 } } } }, type: 'bar', data: wglData }, { name: '占比(已技术归零)', itemStyle: {normal: {label: {show: true}}}, type: 'line', yAxisIndex: 1, data: yjsglzbData }, { name: '占比(已管理归零)', itemStyle: {normal: {label: {show: true}}}, type: 'line', yAxisIndex: 1, data: yglglzbData }, { name: '占比(已双归零)', itemStyle: {normal: {label: {show: true}}}, type: 'line', yAxisIndex: 1, data: ysglzbData }, { name: '占比(未归零)', itemStyle: {normal: {label: {show: true}}}, type: 'line', yAxisIndex: 1, data: wglzbData } ] }; // 使用刚指定的配置项和数据显示图表。 myChart.setOption(option, true); // 浏览器窗口发生改变刷新Echarts图 $(window).resize(function () { myChart.resize(); }); } else { alert(resp.message); } } }) } //年份柱图 function initColumnYearEcharts() { var myChart = echarts.init(document.getElementById('div_year')); $.ajax({ type: 'post',//请求方式 url: ctx + '/report/echarts/dataEchartsYear',//url //data:{'norm':"净利润",'year':year(),'currentmonth':currentmonth(),'lastmonth':lastmonth()}, success: function (resp) { if (resp.success) { var tatilData = []; var yjsglData = []; var yglglData = []; var ysglData = []; var wglData = []; var yjsglzbData = []; var yglglzbData = []; var ysglzbData = []; var wglzbData = []; var data = resp.data; for (var i = 0; i < data.length; i++) { tatilData.push(data[i].year); yjsglData.push(data[i].yjsgl); yglglData.push(data[i].yglgl); ysglData.push(data[i].ysgl); wglData.push(data[i].wgl); yjsglzbData.push(data[i].yjsglzb); yglglzbData.push(data[i].yglglzb); ysglzbData.push(data[i].ysglzb); wglzbData.push(data[i].wglzb); } var option = { // title: { // text: (year() - 2) + '-' + year() + '年质量事故与问题归零情况', // left: 'center' // }, grid: { top: '10%', left: '4%', right: '4%', bottom: '10%', containLabel: true }, tooltip: { trigger: 'axis', axisPointer: { type: 'cross', crossStyle: { color: '#999' } } }, //右上角导出切换图标 // toolbox: { // feature: { // dataView: {show: true, readOnly: false}, // magicType: {show: true, type: ['line', 'bar']}, // restore: {show: true}, // saveAsImage: {show: true} // } // }, legend: [ { bottom: '3%',//位置 x: 'center',//居中 itemGap: 50,//间距 data: ['已技术归零', '已管理归零', '已双归零', '未归零'] }, { bottom: '0%',//位置 x: 'center',//居中 itemGap: 30,//间距 data: ['占比(已技术归零)', '占比(已管理归零)', '占比(已双归零)', '占比(未归零)'] } ], xAxis: [ { type: 'category', data: tatilData, axisPointer: { type: 'shadow' } } ], yAxis: [ { type: 'value', "splitLine": { //网格线 "show": false }, "axisTick": { //y轴刻度线 "show": false }, "axisLine": { //y轴 "show": false }, interval: 50 }, { type: 'value', interval: 20, "splitLine": { //网格线 "show": false }, "axisTick": { //y轴刻度线 "show": false }, "axisLine": { //y轴 "show": false }, axisLabel: { formatter: '{value} %' } } ], color: ['#00FFFF', '#00FF00', '#f321fa', '#FF8C00', '#1e90ff', '#ff7f50', '#b8b8b8', '#b5423d'], series: [ { name: '已技术归零', itemStyle: { normal: { label: { show: true, //开启显示 position: 'top', //在上方显示 textStyle: { //数值样式 color: 'black', fontSize: 14 } } } }, type: 'bar', barWidth: '20',//柱图宽度 barGap: '0', data: yjsglData }, { name: '已管理归零', itemStyle: { normal: { label: { show: true, //开启显示 position: 'top', //在上方显示 textStyle: { //数值样式 color: 'black', fontSize: 14 } } } }, type: 'bar', barWidth: '20',//柱图宽度 data: yglglData }, { name: '已双归零', itemStyle: { normal: { label: { show: true, //开启显示 position: 'top', //在上方显示 textStyle: { //数值样式 color: 'black', fontSize: 14 } } } }, type: 'bar', barWidth: '20',//柱图宽度 data: ysglData }, { name: '未归零', itemStyle: { normal: { label: { show: true, //开启显示 position: 'top', //在上方显示 textStyle: { //数值样式 color: 'black', fontSize: 14 } } } }, type: 'bar', barWidth: '20',//柱图宽度 data: wglData }, { name: '占比(已技术归零)', itemStyle: { normal: { label: { show: true, position: 'left', //在上方显示 textStyle: { //数值样式 color: 'black', fontSize: 14 } } } }, type: 'line', yAxisIndex: 1, data: yjsglzbData }, { name: '占比(已管理归零)', itemStyle: {normal: {label: {show: true}}}, type: 'line', yAxisIndex: 1, data: yglglzbData }, { name: '占比(已双归零)', itemStyle: {normal: {label: {show: true}}}, type: 'line', yAxisIndex: 1, data: ysglzbData }, { name: '占比(未归零)', itemStyle: {normal: {label: {show: true}}}, type: 'line', yAxisIndex: 1, data: wglzbData } ] }; // 使用刚指定的配置项和数据显示图表。 myChart.setOption(option, true); $(window).resize(function () { myChart.resize(); }); } else { alert(resp.message); } } }) } /* * 获取当前年 */ function year() { var date = new Date; var year = date.getFullYear(); return year; } // $("#div_yearTab").click(function () { // var myChart = echarts.init(document.getElementById('div_year')); // var option = { // title: { // text: '2017-2019年质量事故与问题归零情况', // left: 'center' // }, // tooltip: { // trigger: 'axis', // axisPointer: { // type: 'cross', // crossStyle: { // color: '#999' // } // } // }, // //右上角导出切换图标 // // toolbox: { // // feature: { // // dataView: {show: true, readOnly: false}, // // magicType: {show: true, type: ['line', 'bar']}, // // restore: {show: true}, // // saveAsImage: {show: true} // // } // // }, // legend: { // bottom: -5,//位置 // data: ['已技术归零', '已管理归零', '已双归零', '未归零', '占比(已技术归零)', '占比(已管理归零)', '占比(已双归零)', '占比(未归零)'] // }, // xAxis: [ // { // type: 'category', // data: ['2017', '2018', '2019'], // axisPointer: { // type: 'shadow' // } // } // ], // yAxis: [ // { // type: 'value', // "splitLine": { //网格线 // "show": false // }, // "axisTick": { //y轴刻度线 // "show": false // }, // "axisLine": { //y轴 // "show": false // // }, // interval: 50 // }, // { // type: 'value', // interval: 20, // "splitLine": { //网格线 // "show": false // }, // "axisTick": { //y轴刻度线 // "show": false // }, // "axisLine": { //y轴 // "show": false // // }, // axisLabel: { // formatter: '{value} %' // } // } // ], // color: ['#00FFFF', '#00FF00', '#FFFF00', '#FF8C00', '#1e90ff', '#ff7f50', '#b8b8b8', '#b5423d'], // series: [ // // { // name: '已技术归零', // itemStyle: { // normal: { // label: { // show: true, //开启显示 // position: 'top', //在上方显示 // textStyle: { //数值样式 // color: 'black', // fontSize: 14 // } // } // } // }, // type: 'bar', // barGap: '0', // data: [753, 657, 654] // }, // { // name: '已管理归零', // itemStyle: { // normal: { // label: { // show: true, //开启显示 // position: 'top', //在上方显示 // textStyle: { //数值样式 // color: 'black', // fontSize: 14 // } // } // } // }, // type: 'bar', // data: [352, 875, 453] // }, // { // name: '已双归零', // itemStyle: { // normal: { // label: { // show: true, //开启显示 // position: 'top', //在上方显示 // textStyle: { //数值样式 // color: 'black', // fontSize: 14 // } // } // } // }, // type: 'bar', // data: [312, 475, 653] // }, // { // name: '未归零', // itemStyle: { // normal: { // label: { // show: true, //开启显示 // position: 'top', //在上方显示 // textStyle: { //数值样式 // color: 'black', // fontSize: 14 // } // } // } // }, // type: 'bar', // data: [252, 975, 353] // }, // { // name: '占比(已技术归零)', // itemStyle: {normal: {label: {show: true}}}, // type: 'line', // yAxisIndex: 1, // data: [75, 96, 24] // }, // { // name: '占比(已管理归零)', // itemStyle: {normal: {label: {show: true}}}, // type: 'line', // yAxisIndex: 1, // data: [54, 75, 14] // }, // { // name: '占比(已双归零)', // itemStyle: {normal: {label: {show: true}}}, // type: 'line', // yAxisIndex: 1, // data: [70, 85, 44] // }, { // name: '占比(未归零)', // itemStyle: {normal: {label: {show: true}}}, // type: 'line', // yAxisIndex: 1, // data: [30, 65, 54] // } // ] // }; // // 使用刚指定的配置项和数据显示图表。 // myChart.setOption(option, true); // $(window).resize(function () { // myChart.resize(); // }); // })
参考博客:https://blog.csdn.net/qweasdzxc_1092665276/article/details/85000602
致敬:2020年的自己
--------------------------------------------
即使不为了什么远大理想,为了好好生活,你也得努力奋斗啊,不然别说什么风花雪月了,柴米油盐也能让你一筹莫展。

