学习devexpresschartControl控件
devexpress官网chart:https://documentation.devexpress.com/WindowsForms/8117/Controls-and-Libraries/Chart-Control


1 XYDiagram diagram = chart.Diagram as XYDiagram;
2 if (diagram != null) {
3     // Access diagram properties, for example, rotate the diagram.
4     diagram.Rotated = true;
5     // Access properties of objects that belong to the diagram,
6     // for example, axes and panes.
7     diagram.AxisY.Title.Text = "Population mid-year, millions";
8     diagram.DefaultPane.Weight = 2;
9 }

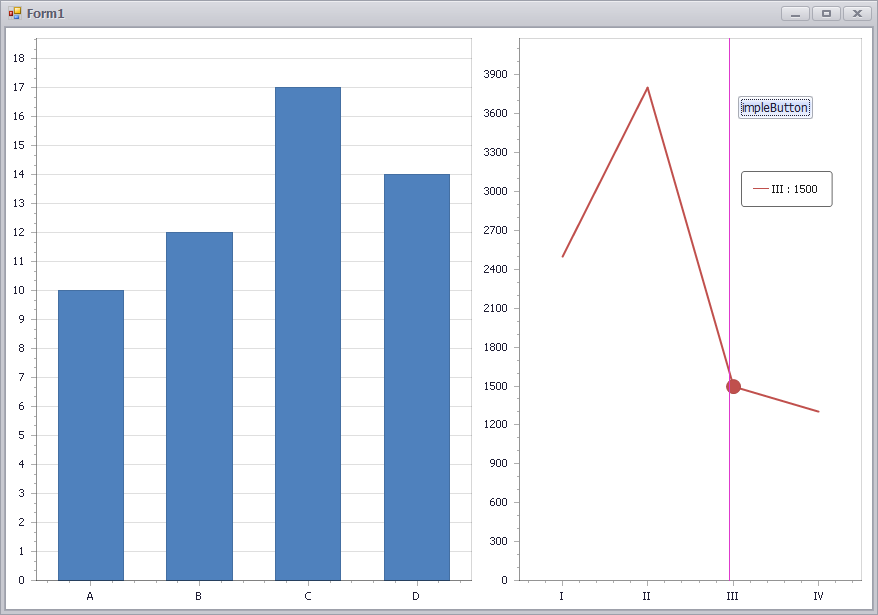
 1 using System;
 2 using System.Drawing;
 3 using System.Windows.Forms;
 4 using DevExpress.XtraCharts;
 5 // ...
 6
 7 private void Form1_Load(object sender, EventArgs e) {
 8     // Create a new chart.
 9     ChartControl chartControl1 = new ChartControl();
10
11     // Create two series.
12     Series series1 = new Series("Series 1", ViewType.Bar);
13     Series series2 = new Series("Series 2", ViewType.Line);
14
15     // Add points to them, with their arguments different.
16     series1.Points.Add(new SeriesPoint("A", 10));
17     series1.Points.Add(new SeriesPoint("B", 12));
18     series1.Points.Add(new SeriesPoint("C", 17));
19     series1.Points.Add(new SeriesPoint("D", 14));
20     series2.Points.Add(new SeriesPoint("I", 2500));
21     series2.Points.Add(new SeriesPoint("II", 3800));
22     series2.Points.Add(new SeriesPoint("III", 1500));
23     series2.Points.Add(new SeriesPoint("IV", 1300));
24
25     // Add both series to the chart.
26     chartControl1.Series.AddRange(new Series[] { series1, series2 });
27
28     // Hide the legend (optional).
29     chartControl1.Legend.Visible = false;
30
31     // Cast the chart's diagram to the XYDiagram type,
32     // to access its axes and panes.
33     XYDiagram diagram = (XYDiagram)chartControl1.Diagram;
34
35     // Add secondary axes to the diagram, and adjust their options.
36     diagram.SecondaryAxesX.Add(new SecondaryAxisX("My Axis X"));
37     diagram.SecondaryAxesY.Add(new SecondaryAxisY("My Axis Y"));
38     diagram.SecondaryAxesX[0].Alignment = AxisAlignment.Near;
39     diagram.SecondaryAxesY[0].Alignment = AxisAlignment.Near;
40
41     // Add a new additional pane to the diagram.
42     diagram.Panes.Add(new XYDiagramPane("My Pane"));
43
44     // Assign both the additional pane and, if required,
45     // the secondary axes to the second series.
46     LineSeriesView myView = (LineSeriesView)series2.View;
47     myView.AxisX = diagram.SecondaryAxesX[0];
48     myView.AxisY = diagram.SecondaryAxesY[0];
49     // Note that the created pane has the zero index in the collection,
50     // because the existing Default pane is a separate entity.
51     myView.Pane = diagram.Panes[0];
52
53     // Customize the layout of the diagram's panes.
54     diagram.PaneDistance = 10;
55     diagram.PaneLayoutDirection = PaneLayoutDirection.Horizontal;
56     diagram.DefaultPane.SizeMode = PaneSizeMode.UseWeight;
57     diagram.DefaultPane.Weight = 1.2;
58
59     // Add the chart to the form.
60     chartControl1.Dock = DockStyle.Fill;
61     this.Controls.Add(chartControl1);
62 }

Adding Panes:https://documentation.devexpress.com/WindowsForms/5880/Controls-and-Libraries/Chart-Control/Fundamentals/Chart-Elements/Diagram/Panes/Adding-Panes#Examples

 1 using System;
 2 using System.Drawing;
 3 using System.Windows.Forms;
 4 using DevExpress.XtraCharts;
 5 // ...
 6
 7 private void Form1_Load(object sender, EventArgs e) {
 8     // Create a new chart.
 9     ChartControl chartControl1 = new ChartControl();
10
11     // Create two series.
12     Series series1 = new Series("Series 1", ViewType.Bar);
13     Series series2 = new Series("Series 2", ViewType.Line);
14
15     // Add points to them, with their arguments different.
16     series1.Points.Add(new SeriesPoint("A", 10));
17     series1.Points.Add(new SeriesPoint("B", 12));
18     series1.Points.Add(new SeriesPoint("C", 17));
19     series1.Points.Add(new SeriesPoint("D", 14));
20     series2.Points.Add(new SeriesPoint("I", 2500));
21     series2.Points.Add(new SeriesPoint("II", 3800));
22     series2.Points.Add(new SeriesPoint("III", 1500));
23     series2.Points.Add(new SeriesPoint("IV", 1300));
24
25     // Add both series to the chart.
26     chartControl1.Series.AddRange(new Series[] { series1, series2 });
27
28     // Hide the legend (optional).
29     chartControl1.Legend.Visible = false;
30
31     // Cast the chart's diagram to the XYDiagram type,
32     // to access its axes and panes.
33     XYDiagram diagram = (XYDiagram)chartControl1.Diagram;
34
35     // Add secondary axes to the diagram, and adjust their options.
36     diagram.SecondaryAxesX.Add(new SecondaryAxisX("My Axis X"));
37     diagram.SecondaryAxesY.Add(new SecondaryAxisY("My Axis Y"));
38     diagram.SecondaryAxesX[0].Alignment = AxisAlignment.Near;
39     diagram.SecondaryAxesY[0].Alignment = AxisAlignment.Near;
40
41     // Add a new additional pane to the diagram.
42     diagram.Panes.Add(new XYDiagramPane("My Pane"));
43
44     // Assign both the additional pane and, if required,
45     // the secondary axes to the second series.
46     LineSeriesView myView = (LineSeriesView)series2.View;
47     myView.AxisX = diagram.SecondaryAxesX[0];
48     myView.AxisY = diagram.SecondaryAxesY[0];
49     // Note that the created pane has the zero index in the collection,
50     // because the existing Default pane is a separate entity.
51     myView.Pane = diagram.Panes[0];
52
53     // Customize the layout of the diagram's panes.
54     diagram.PaneDistance = 10;
55     diagram.PaneLayoutDirection = PaneLayoutDirection.Horizontal;
56     diagram.DefaultPane.SizeMode = PaneSizeMode.UseWeight;
57     diagram.DefaultPane.Weight = 1.2;
58
59     // Add the chart to the form.
60     chartControl1.Dock = DockStyle.Fill;
61     this.Controls.Add(chartControl1);
62 }


