
九、Ceph的Dashboard和监控
Ceph dashboard 是通过一个web 界面,对已经运行的ceph 集群进行状态查看及功能配置等功能,早期ceph 使用的是第三方的dashboard 组件。
Ceph 的监控可视化界面方案很多----grafana、Kraken。但是从Luminous开始,Ceph 提供了原生的Dashboard功能,通过Dashboard可以获取Ceph集群的各种基本状态信息。 mimic版 (nautilus版) dashboard 安装。如果是 (nautilus版) 需要安装 ceph-mgr-dashboard 。
Ceph-Dash 是用Python 开发的一个Ceph 的监控面板,用来监控Ceph 的运行状态。同时提供REST API 来访问状态数据。
优点:
易部署
轻量级
灵活(可以自定义开发功能)
缺点:
功能相对简单
1)启用dashboard插件
https://docs.ceph.com/en/mimic/mgr/
https://docs.ceph.com/en/latest/mgr/dashboard/
https://packages.debian.org/unstable/ceph-mgr-dashboard #15 版本有依赖需要单独解决 Ceph mgr 是一个多插件( 模块化) 的组件, 其组件可以单独的启用或关闭。
新版本需要安装dashboard 安保,而且必须安装在mgr 节点,否则报错如下
The following packages have unmet dependencies:
ceph-mgr-dashboard : Depends: ceph-mgr (= 15.2.13-1~bpo10+1) but it is not going to be
installed
E: Unable to correct problems, you have held broken packages.
在ceph-mgr1上部署dashboard
root@ceph-mgr1:~# apt-cache madison ceph-mgr-dashboard
root@ceph-mgr1:~# apt install ceph-mgr-dashboard
在ceph集群管理端ceph-deploy上查看ceph的模块信息
cephadmin@ceph-deploy:~$ ceph mgr module -h #查看帮助
cephadmin@ceph-deploy:~$ ceph mgr module ls #列出所有模块
{
    "always_on_modules": [
        "balancer",
        "crash",
        "devicehealth",
        "orchestrator",
        "pg_autoscaler",
        "progress",
        "rbd_support",
        "status",
        "telemetry",
        "volumes"
    ],
    "enabled_modules": [
        "iostat",
        "nfs",
        "restful"
    ],
    "disabled_modules": [   #没有启用的模块
        {
            "name": "alerts",
            "can_run": true,
            "error_string": "",
         ......
         },
         ......
         {
            "name": "dashboard",  #模块名称
            "can_run": true,      #是否可以启用
            "error_string": ""
         ......
         }
......
在ceph管理端ceph-deploy上启用dashboard模块
cephadmin@ceph-deploy:~$ ceph mgr module enable dashboard
cephadmin@ceph-deploy:~$ ceph mgr module ls | less

{
    "always_on_modules": [
        "balancer",
        "crash",
        "devicehealth",
        "orchestrator",
        "pg_autoscaler",
        "progress",
        "rbd_support",
        "status",
        "telemetry",
        "volumes"
    ],
    "enabled_modules": [
        "dashboard",   #dashboard模块已经启用了
        "iostat",
        "nfs",
        "restful"
    ],
Ceph dashboard 在mgr 节点进行开启设置,并且可以配置开启或者关闭SSL,如下:
在集群管理端ceph-deploy上操作
#关闭ssl
cephadmin@ceph-deploy:~$ ceph config set mgr mgr/dashboard/ssl false
#设置dashboard的监听地址,这里设置为ceph-mgr1的地址
cephadmin@ceph-deploy:~$ ceph config set mgr mgr/dashboard/ceph-mgr1/server_addr 172.168.32.102
#指定dashboard的监听端口为9009
cephadmin@ceph-deploy:~$ ceph config set mgr mgr/dashboard/ceph-mgr1/server_port 9009
#验证集群状态,第一次启用dashboard 插件需要等一段时间(几分钟),再去被启用的节点验证。
cephadmin@ceph-deploy:~/ceph-cluster$ ceph -s
  cluster:
    id:     c31ea2e3-47f7-4247-9d12-c0bf8f1dfbfb
    health: HEALTH_OK

  services:
    mon: 3 daemons, quorum ceph-mon01,ceph-mon02,ceph-mon03 (age 19h)
    mgr: ceph-mgr01(active, since 2s), standbys: ceph-mgr02
    mds: 2/2 daemons up, 2 standby
    osd: 16 osds: 16 up (since 32h), 16 in (since 32h)
    rgw: 2 daemons active (2 hosts, 1 zones)

  data:
    volumes: 1/1 healthy
    pools:   9 pools, 241 pgs
    objects: 279 objects, 13 KiB
    usage:   664 MiB used, 799 GiB / 800 GiB avail
    pgs:     241 active+clean

#在ceph-mgr01上查看端口与进程
COMMAND    PID USER   FD   TYPE DEVICE SIZE/OFF NODE NAME
ceph-mgr 24275 ceph   32u  IPv4 358492      0t0  TCP ceph-mgr01:9009 (LISTEN)
ceph集群报错:
Module 'dashboard' has failed: error('No socket could be created',)
#需要检查mgr 服务是否正常运行,可以重启一遍mgr 服务
dashboard的访问验证
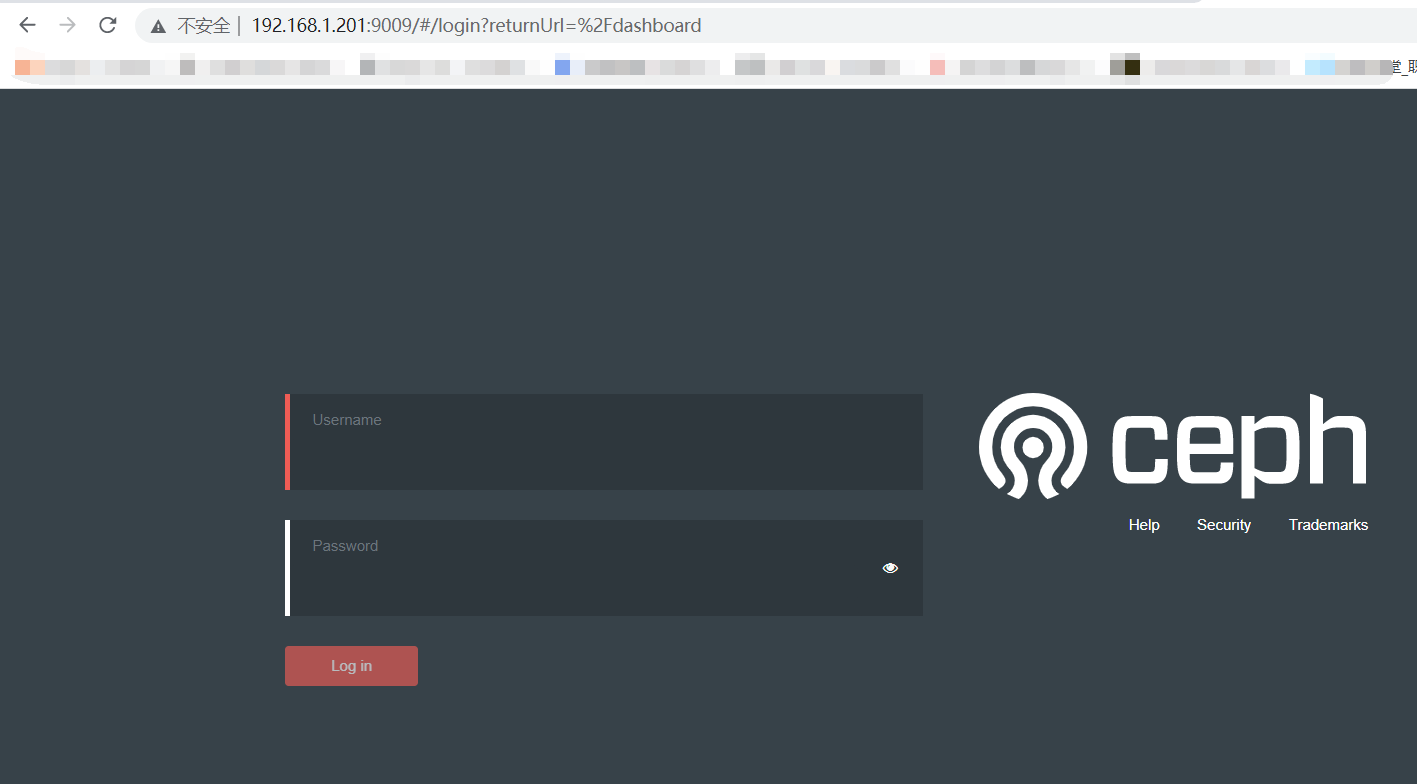
#创建登录的密码文件
cephadmin@ceph-deploy:~/ceph-cluster$ touch dashboard-passwd
#向密码文件中写入密码
cephadmin@ceph-deploy:~/ceph-cluster$ echo 123456 > dashboard-passwd
#设备zhai用户并导入密码密码
cephadmin@ceph-deploy:~/ceph-cluster$ ceph dashboard set-login-credentials zhai -i dashboard-passwd
******************************************************************
***          WARNING: this command is deprecated.              ***
*** Please use the ac-user-* related commands to manage users. ***
******************************************************************
Username and password updated
使用账户和密码登录
dashboard的命令格式
cephadmin@ceph-deploy:~/ceph-cluster$ceph dashboard set-login-credentials -h #命令格式
 Monitor commands:
 =================
dashboard set-login-credentials <username>          Set the login credentials. Password read from -i <file>


#修改zhai的dashboard的密码为123456789
cephadmin@ceph-deploy:~/ceph-cluster$ echo 123456789 > dashboard-passwd
cephadmin@ceph-deploy:~/ceph-cluster$ ceph dashboard set-login-credentials zhai -i dashboard-passwd
******************************************************************
***          WARNING: this command is deprecated.              ***
*** Please use the ac-user-* related commands to manage users. ***
******************************************************************
Username and password updated
#重新登录成功
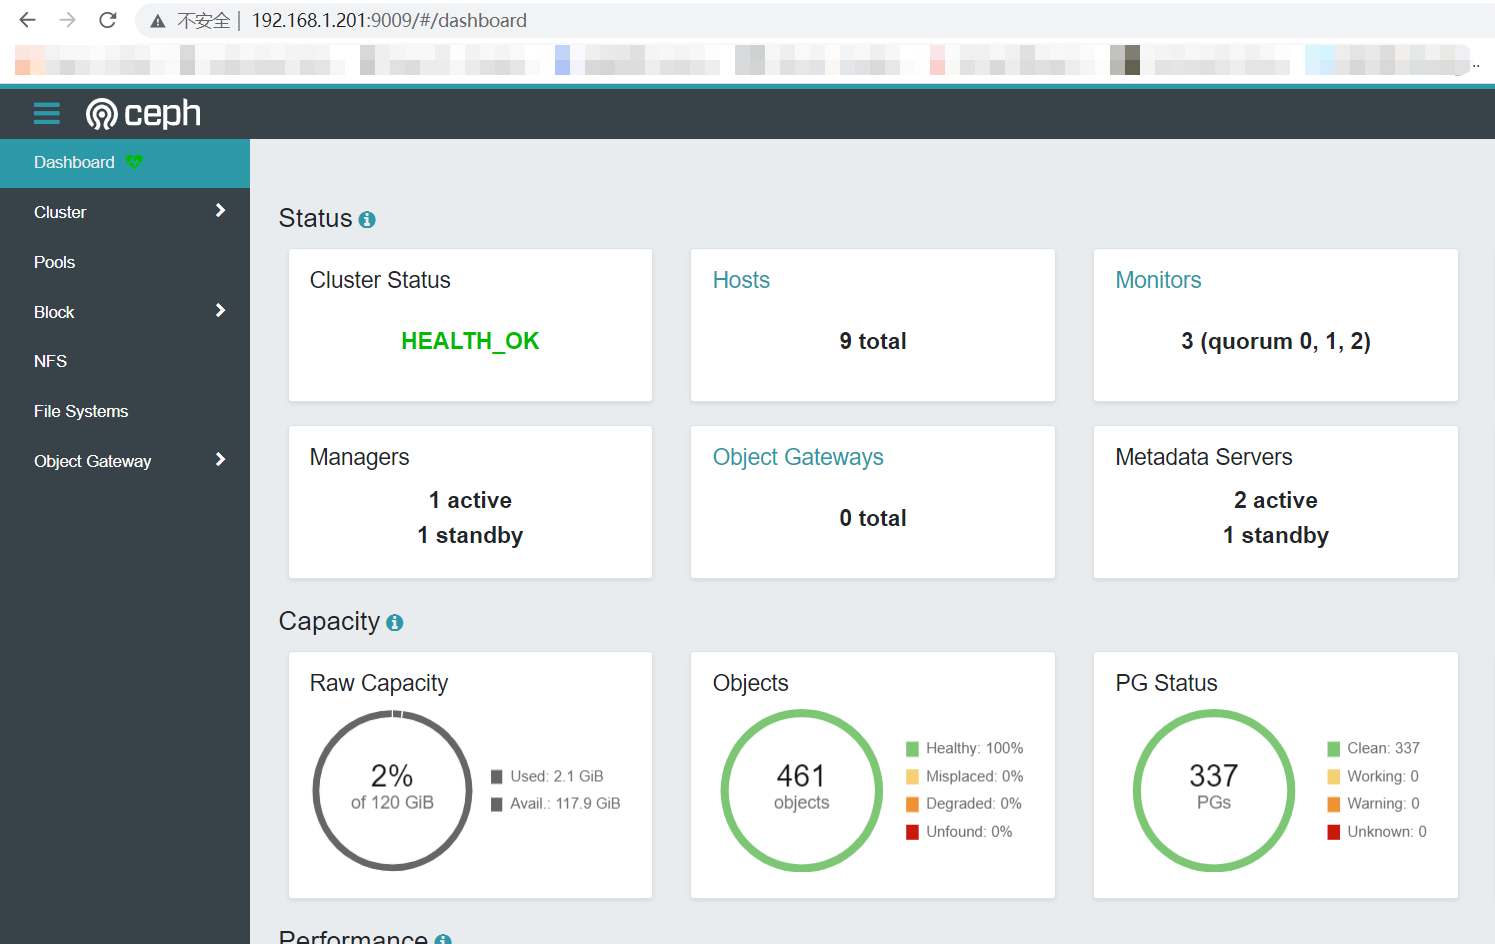
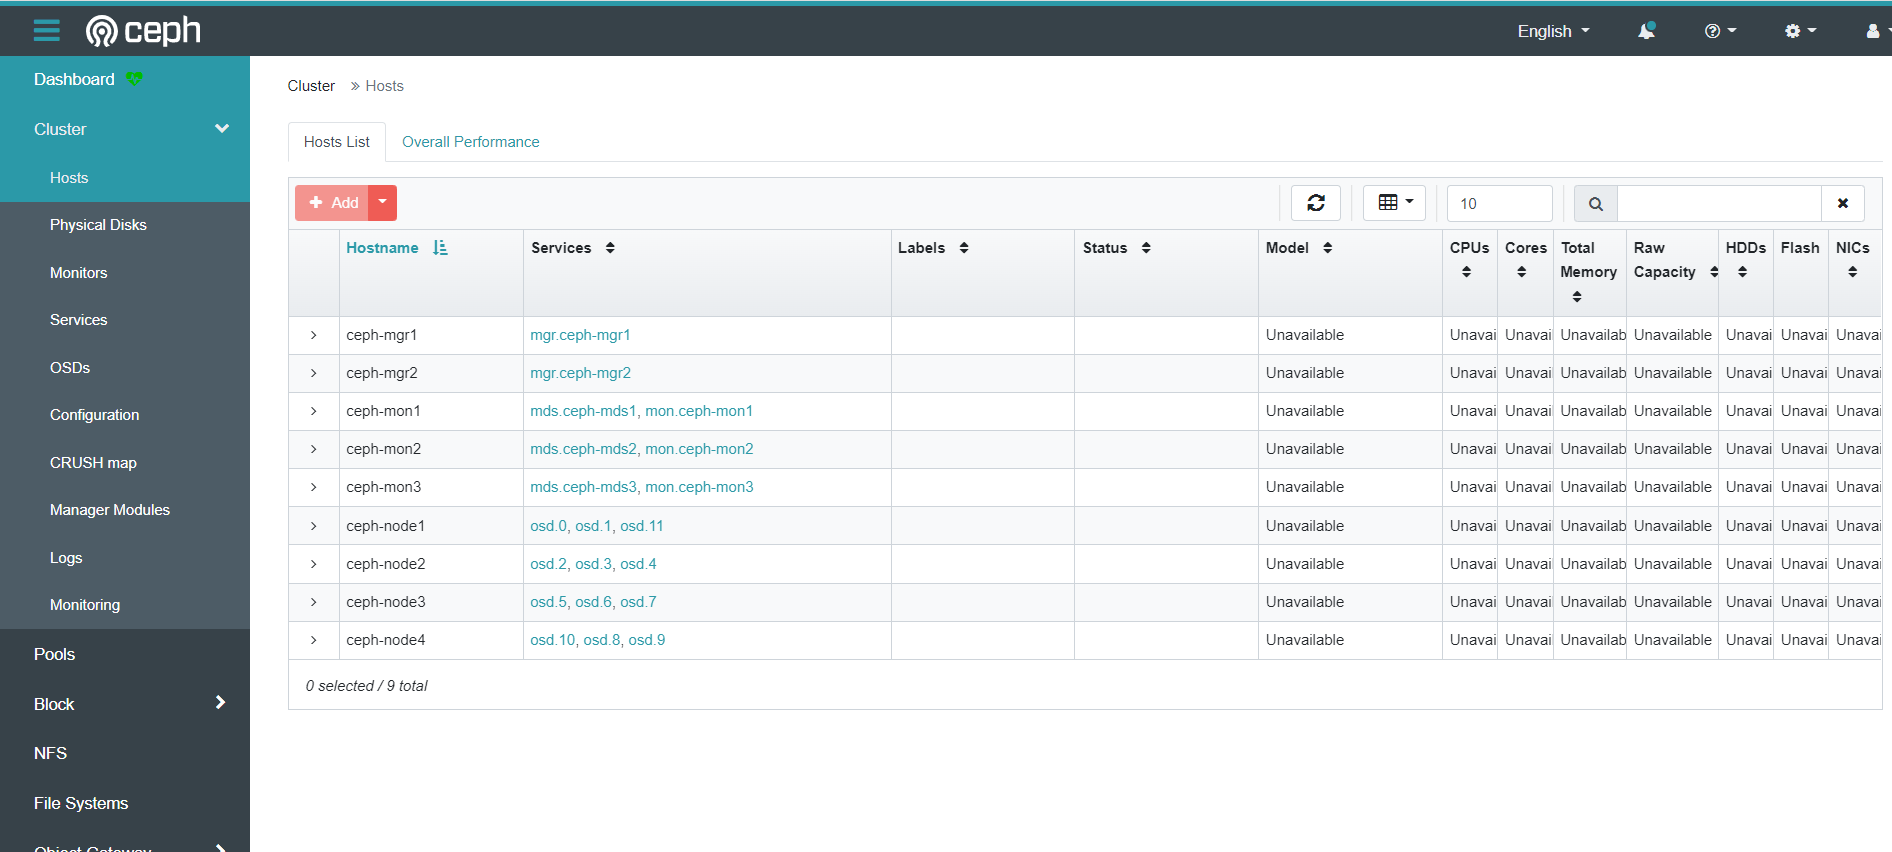
主机信息
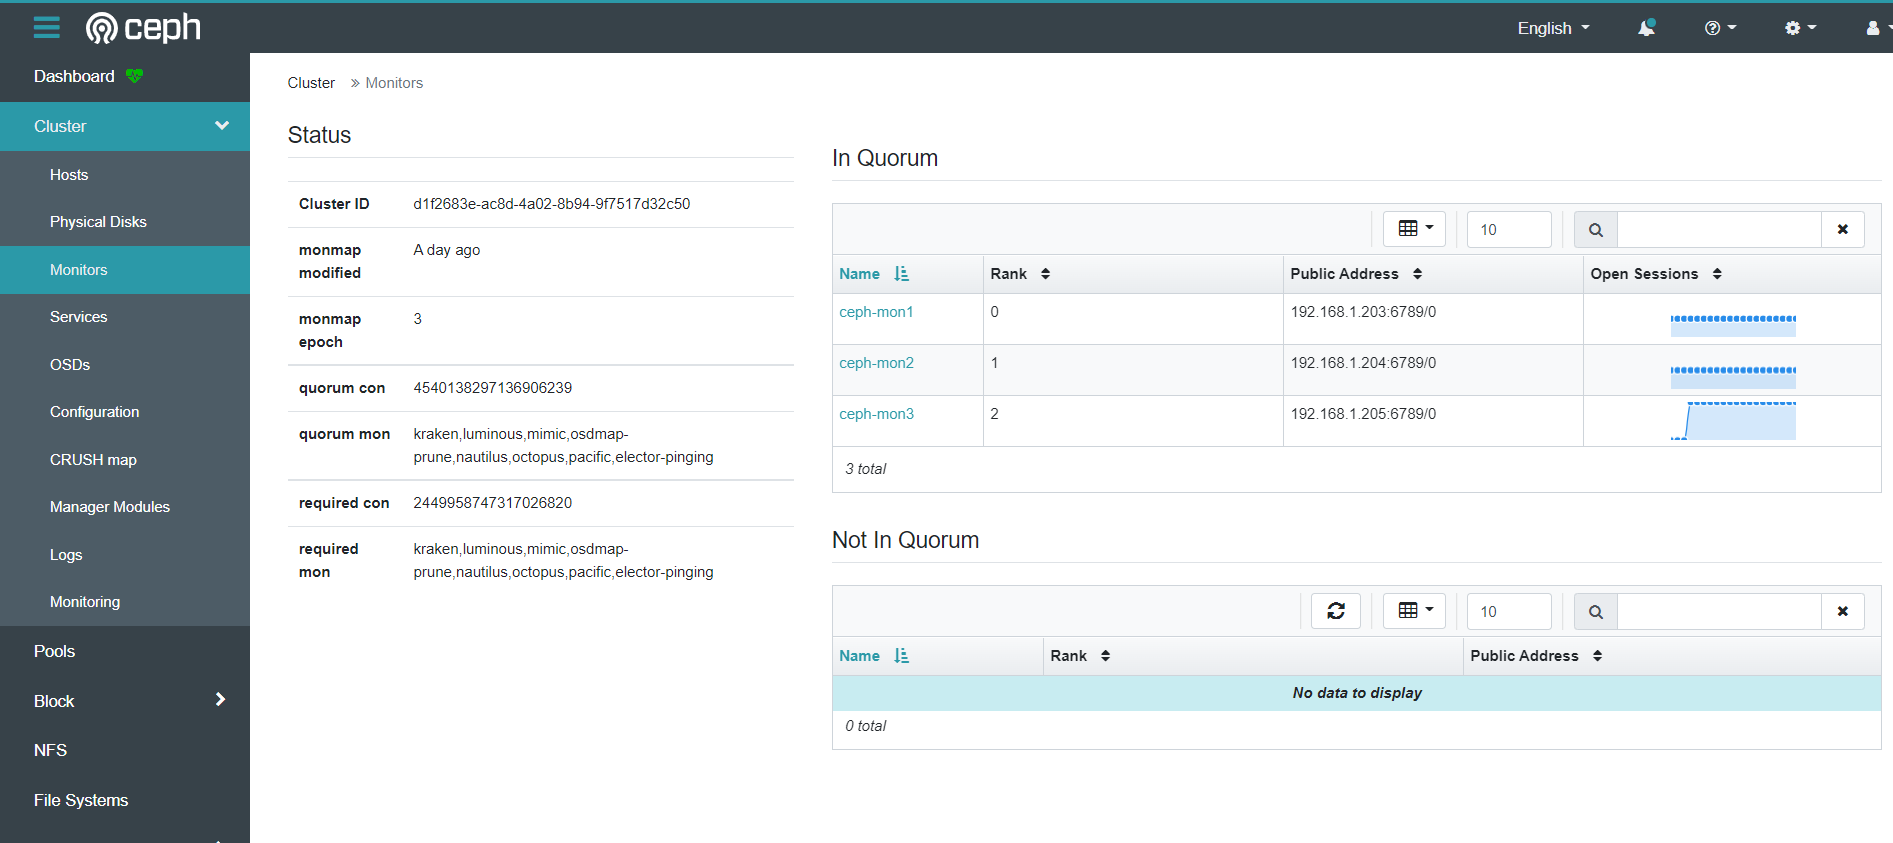
mon信息
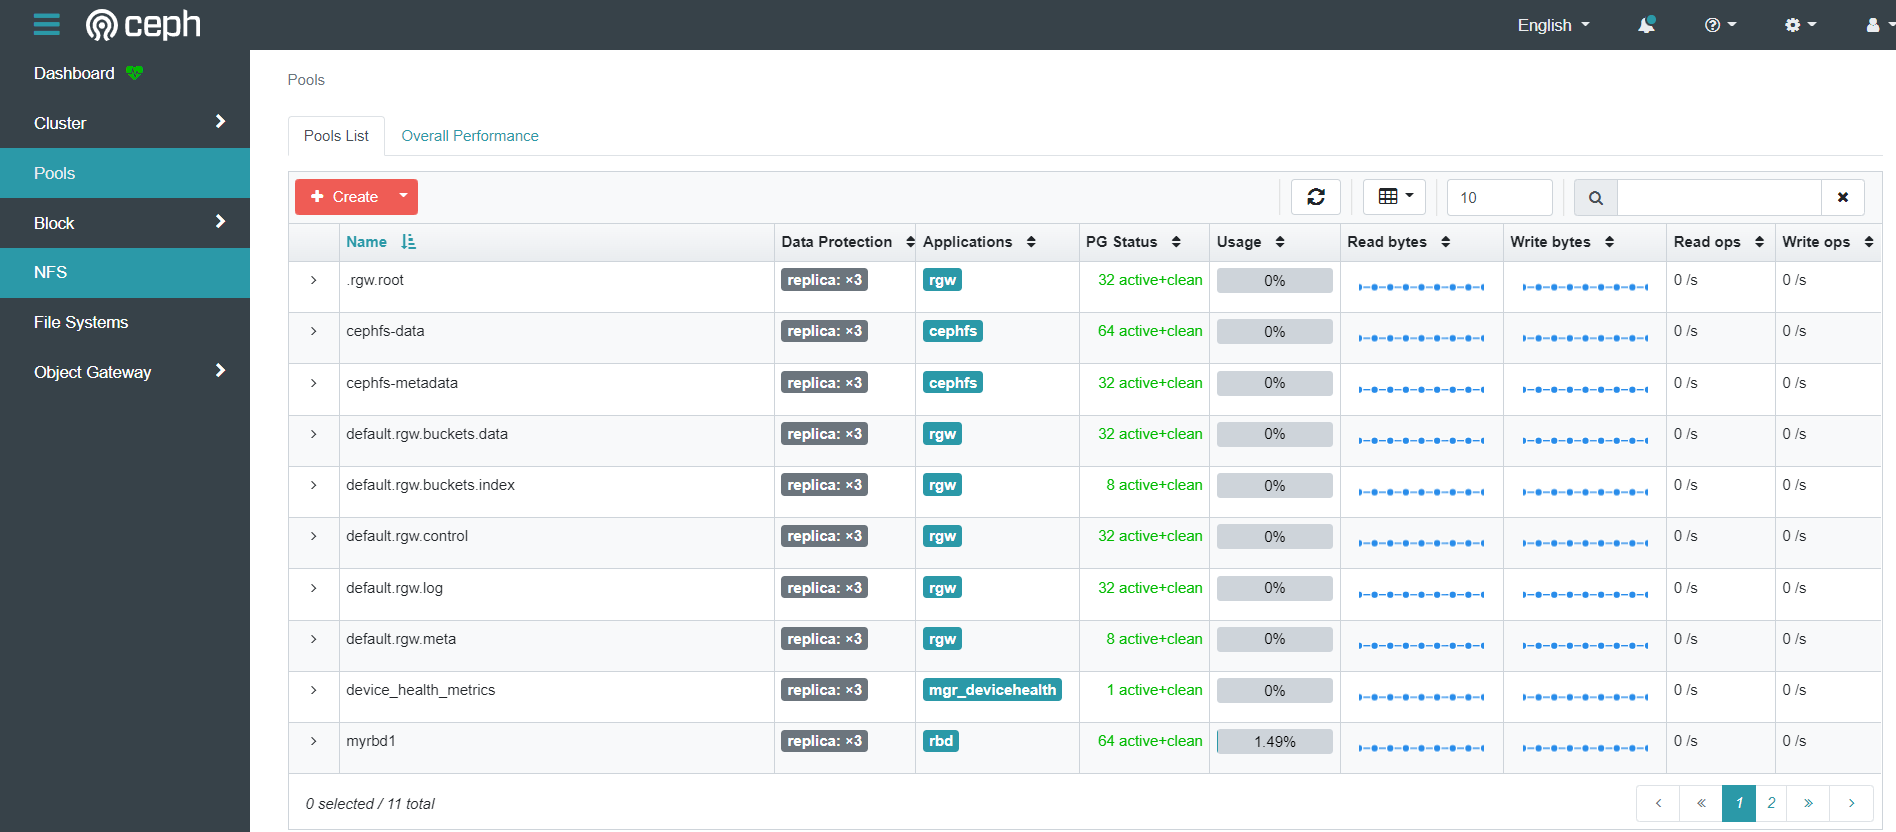
pool信息
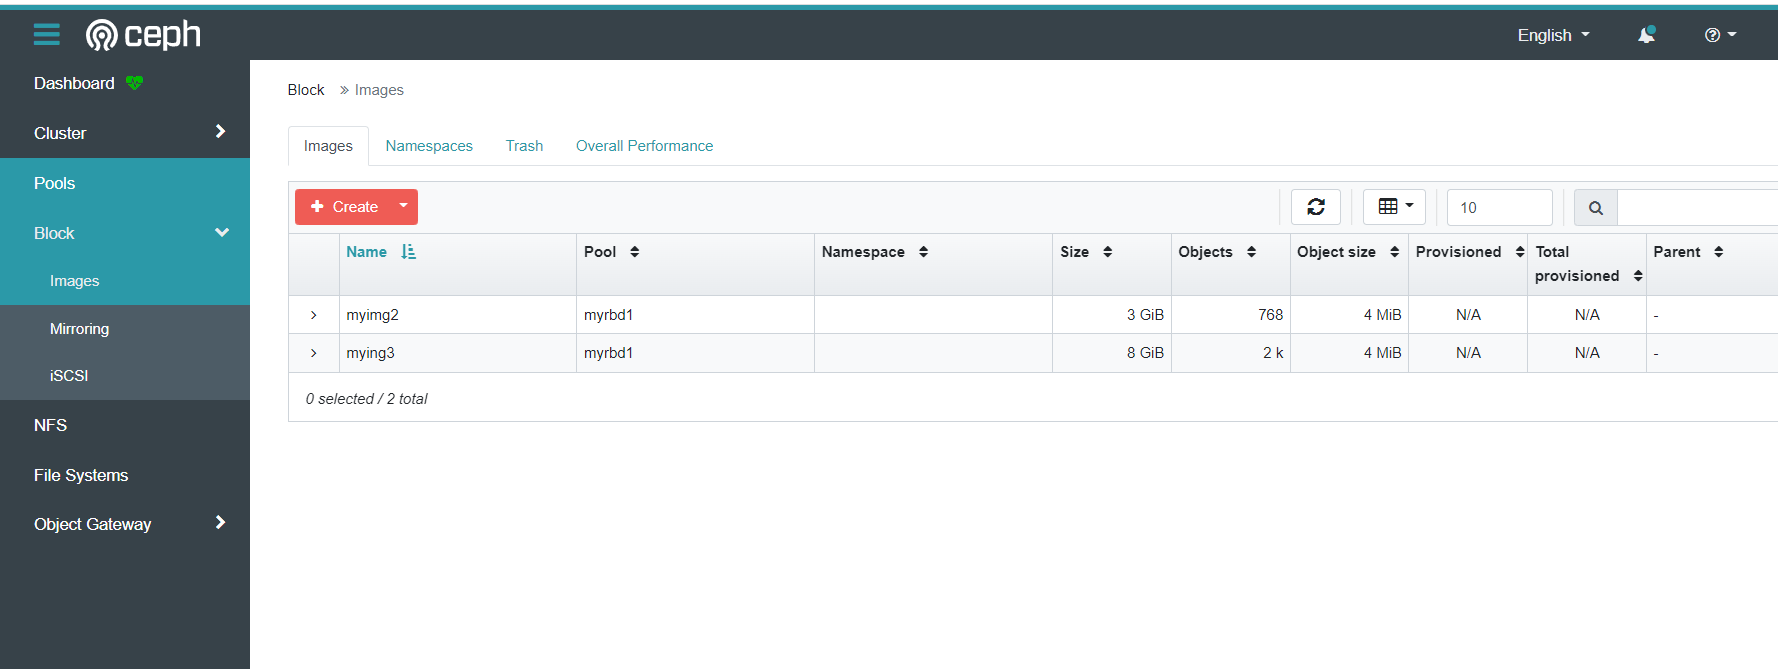
ceph rbd信息
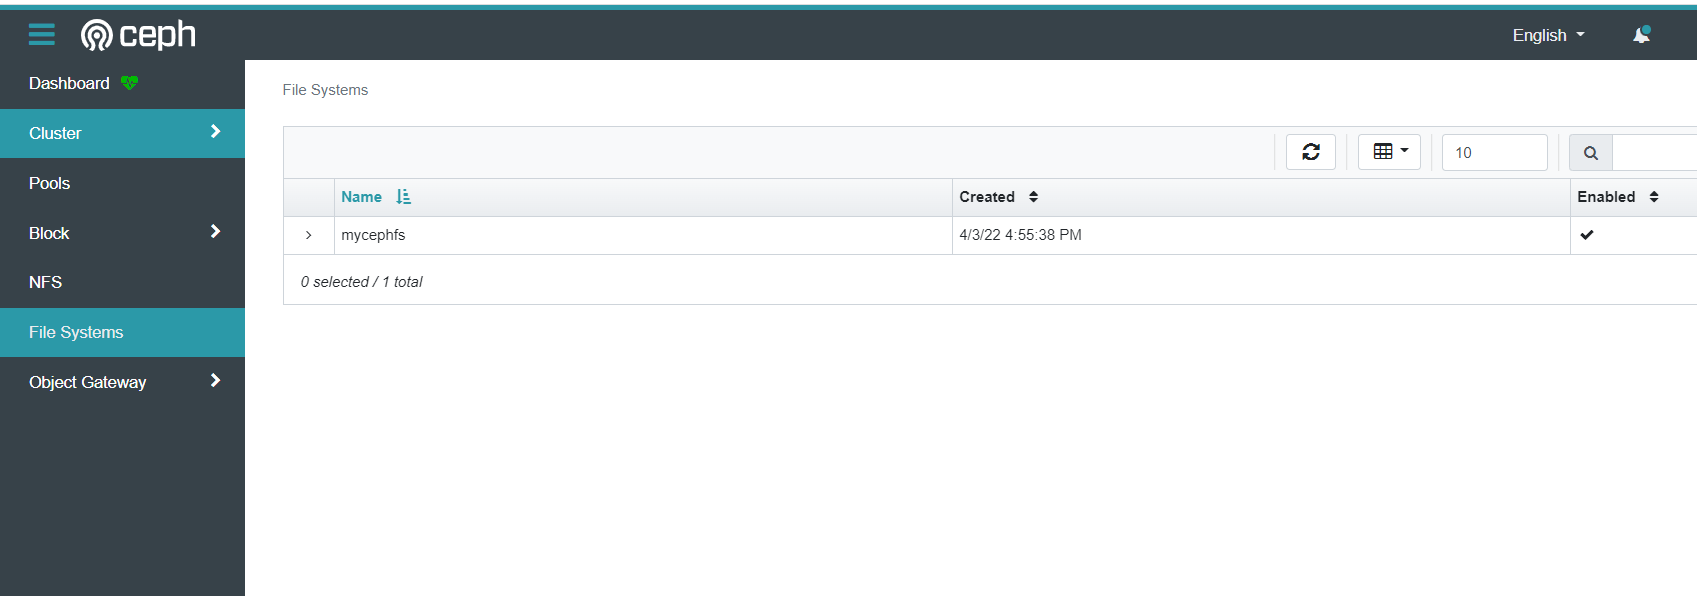
cephfs信息
如果要使用SSL 访问。则需要配置签名证书。证书可以使用ceph 命令生成,或是opessl 命令生成。
https://docs.ceph.com/en/latest/mgr/dashboard/
配置dashboard的ssl
#ceph 自签名证书:
cephadmin@ceph-deploy:~/ceph-cluster$ ceph dashboard create-self-signed-cert
Self-signed certificate created
#启用ssl
cephadmin@ceph-deploy:~/ceph-cluster$ ceph config set mgr mgr/dashboard/ssl true
#查看当前dashboard的状态
cephadmin@ceph-deploy:~/ceph-cluster$ ceph mgr services
{
    "dashboard": "http://192.168.1.201:9009/"
}
#重启mgr服务
root@ceph-mgr01:~# systemctl restart ceph-mgr@ceph-mgr01
#再次查看dashboard的状态
cephadmin@ceph-deploy:~/ceph-cluster$ ceph mgr services
{
    "dashboard": "https://192.168.1.201:8443/"
}

访问https://192.168.1.201:8443
2、prometheus监控ceph node节点
#从官网下载
prometheus-2.23.0.linux-amd64.tar.gz

#部署promethus
mkdir /apps
cd /apps
tar xvf prometheus-2.23.0.linux-amd64.tar.gz
ln -sv /apps/prometheus-2.23.0.linux-amd64 /apps/prometheus

#编写prometheus的启动文件
cat >> /etc/systemd/system/prometheus.service <<EOF
[Unit]
Description=Prometheus Server
Documentation=https://prometheus.io/docs/introduction/overview/
After=network.target
[Service]
Restart=on-failure
WorkingDirectory=/apps/prometheus/
ExecStart=/apps/prometheus/prometheus --config.file=/apps/prometheus/prometheus.yml
[Install]
WantedBy=multi-user.target
EOF

#启动prometheus
systemctl daemon-reload
systemctl restart prometheus
systemctl enable prometheus

#验证prometheus
root@ceph-deploy:/apps# ps -ef|grep prometheus
root     16366     1  0 23:31 ?        00:00:00 /apps/prometheus/prometheus --config.file=/apps/prometheus/prometheus.yml

root@ceph-deploy:/apps# ss -antlp|grep prometheus
LISTEN   0         20480                     *:9090                   *:*        users:(("prometheus",pid=16366,fd=11))
192.168.1.150:9090
#从官网下载
 node_exporter-1.0.1.linux-amd64.tar.gz

#在ceph的所有ceph-node上部署node_exporter
mkdir /apps
cd /apps/
tar xvf node_exporter-1.0.1.linux-amd64.tar.gz
ln -sv /apps/node_exporter-1.0.1.linux-amd64 /apps/node_exporter

#编写node_exporter的启动文件
cat >> /etc/systemd/system/node-exporter.service << EOF
[Unit]
Description=Prometheus Node Exporter
After=network.target
[Service]
ExecStart=/apps/node_exporter/node_exporter
[Install]
WantedBy=multi-user.target
EOF

#启动node_exporter
systemctl daemon-reload
systemctl restart node-exporter
systemctl enable node-exporter

#验证node-exporter
root@ceph-node01:/apps# ps -ef|grep node_exporter
root       24798       1  0 23:40 ?        00:00:00 /apps/node_exporter/node_exporter

root@ceph-node01:/apps# ss -antlp|grep node_exporter
LISTEN   0         20480                      *:9100                   *:*       users:(("node_exporter",pid=24798,fd=3))
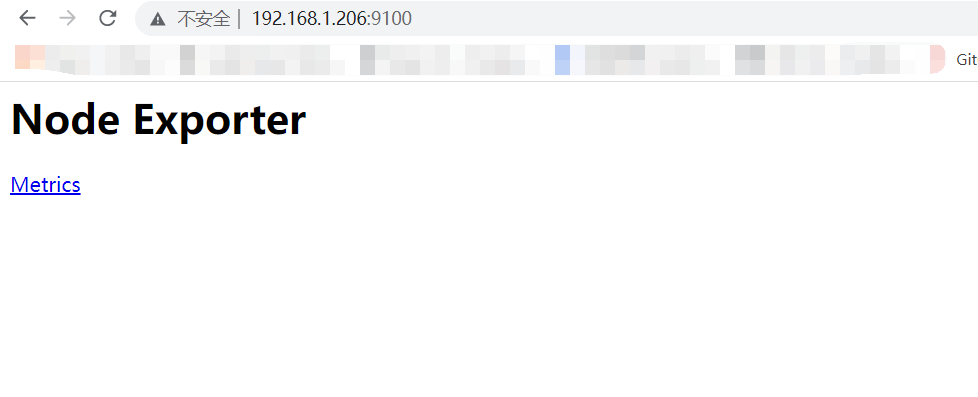
验证ceph-node1节点的node_exporter 数据:192.168.1.206:9100
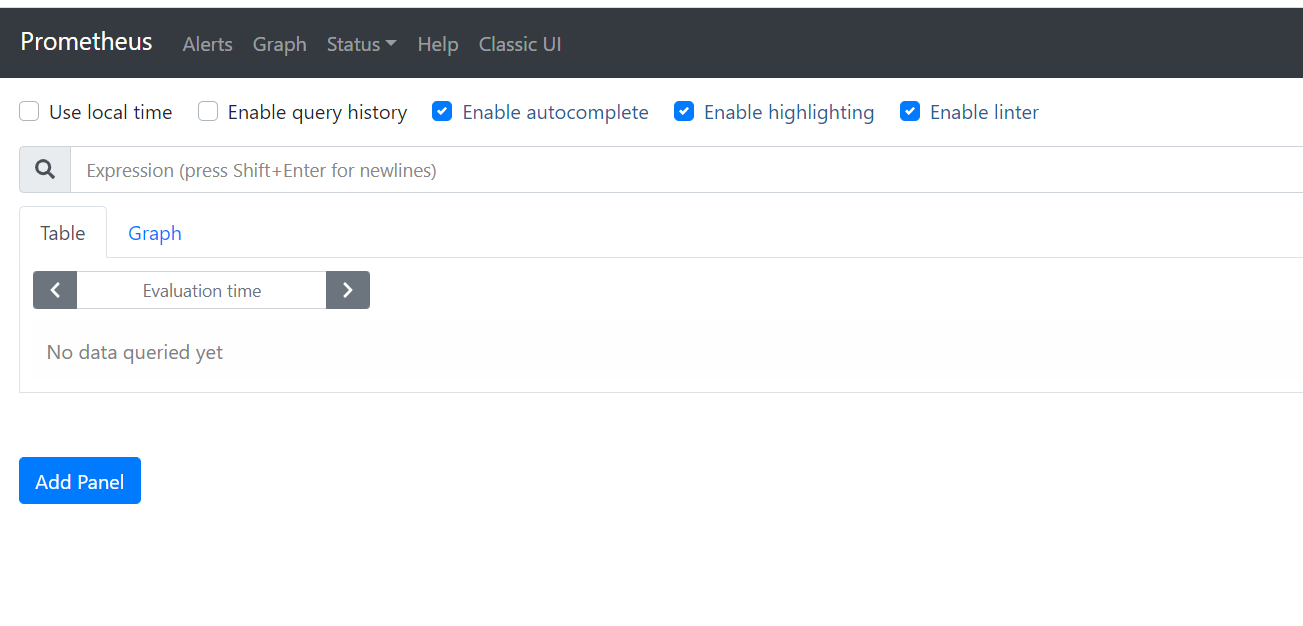
在prometheus服务器上
root@prometheus:/usr/local/prometheus# vim prometheus.yml
# my global config
global:
scrape_interval: 15s # Set the scrape interval to every 15 seconds. Default is every 1 minute.
evaluation_interval: 15s # Evaluate rules every 15 seconds. The default is every 1 minute.
# scrape_timeout is set to the global default (10s).
# Alertmanager configuration
alerting:
alertmanagers:
- static_configs:
- targets:
# - alertmanager:9093
# Load rules once and periodically evaluate them according to the global 'evaluation_interval'.
rule_files:
# - "first_rules.yml"
# - "second_rules.yml"
# A scrape configuration containing exactly one endpoint to scrape:
# Here it's Prometheus itself.
scrape_configs:
# The job name is added as a label `job=<job_name>` to any timeseries scraped from this config.
- job_name: 'prometheus'
# metrics_path defaults to '/metrics'
# scheme defaults to 'http'.
static_configs:
- targets: ['localhost:9090']
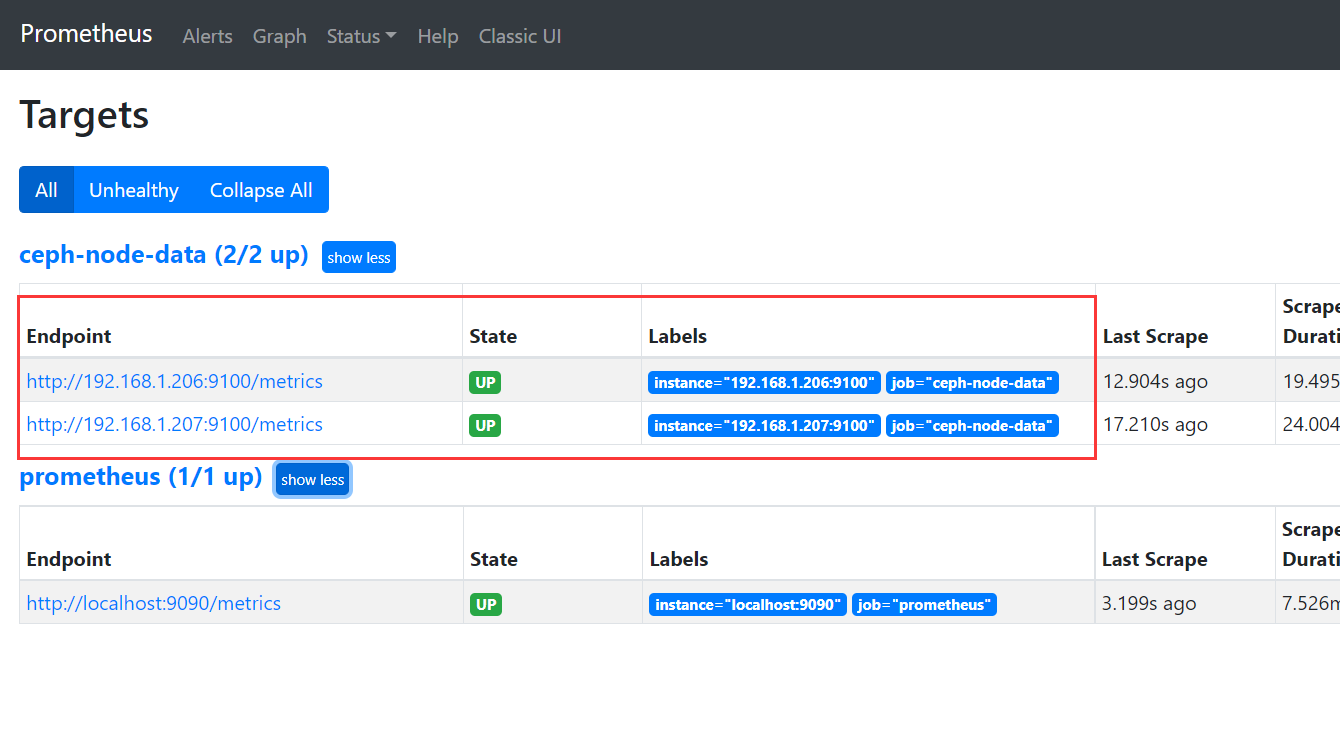
- job_name: 'ceph-node-data'
# metrics_path defaults to '/metrics'
# scheme defaults to 'http'.
#添加监控需要的ceph-node节点
static_configs:
- targets: ["192.168.1.206:9100","192.168.1.207:9100"]
# 重启prometheus
root@prometheus:/usr/local/prometheus# systemctl restart prometheus.service
4)通过prometheus 监控ceph 服务
Ceph manager 内部的模块中包含了prometheus 的监控模块,并监听在每个manager 节点的9283 端口,该端口用于将采集到的信息通过http 接口向prometheus 提供数据。
https://docs.ceph.com/en/mimic/mgr/prometheus/?highlight=prometheus
#在ceph-deploy启用prometheus 监控模块,在mgr上会开启9283端口
root@ceph-deploy:~# ceph mgr module enable prometheus

#在ceph-mgr1上查看9283端口
root@ceph-mgr1:~# ss -antlp|grep 9283
LISTEN   0         5             172.168.32.102:9283             0.0.0.0:*       users:(("ceph-mgr",pid=748,fd=35))
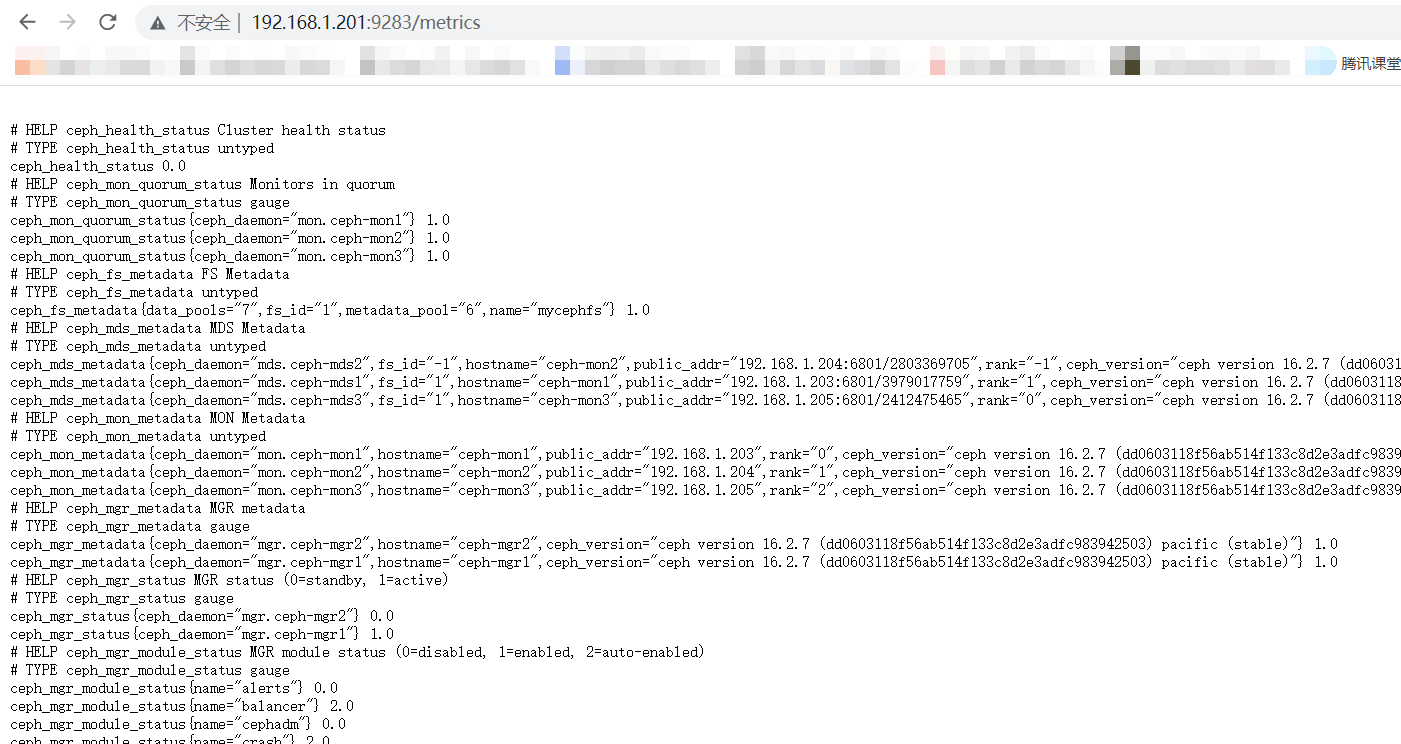
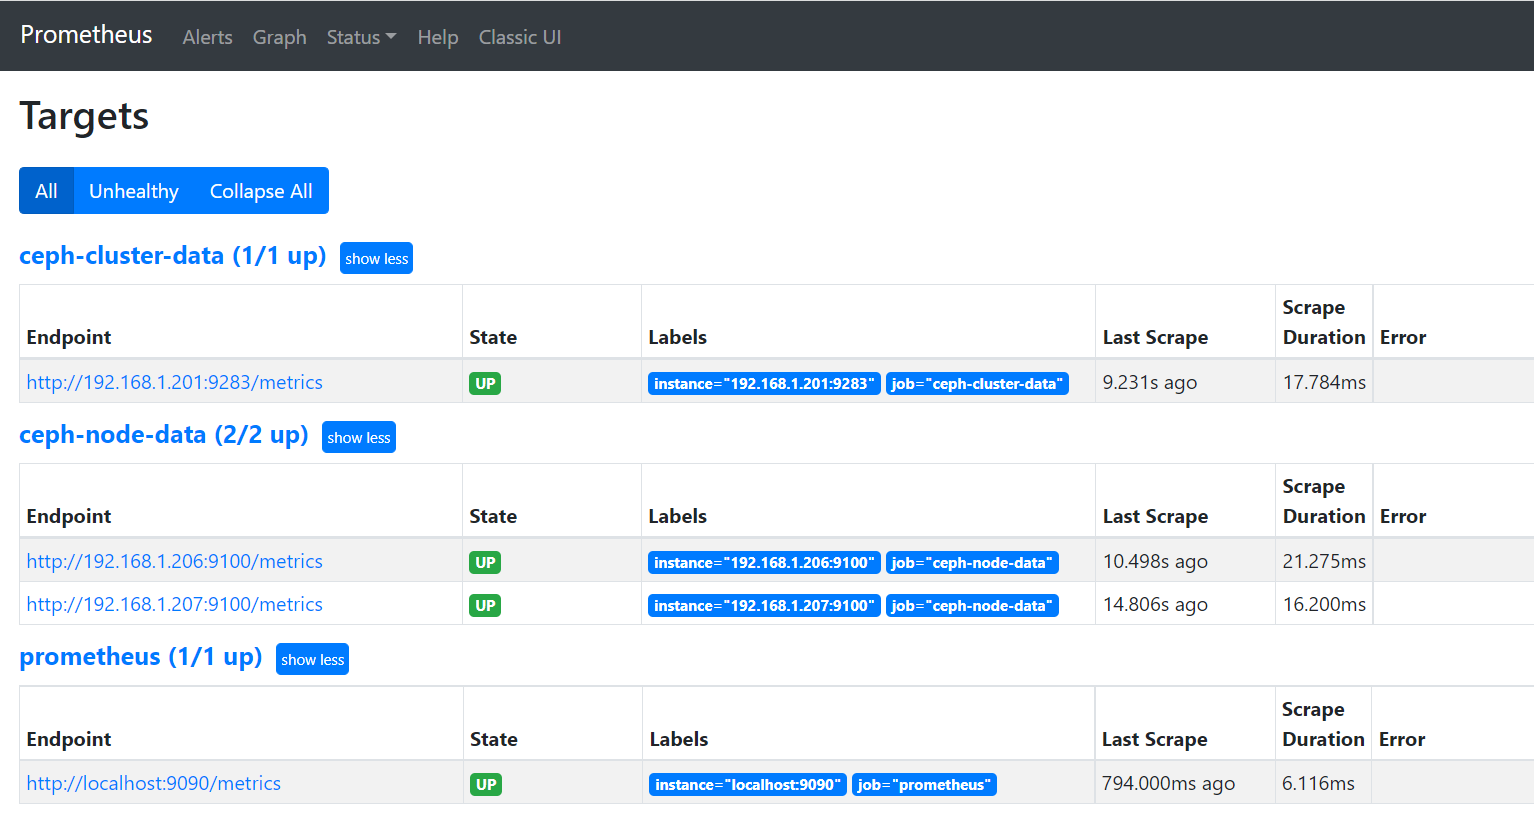
6)配置prometheus 采集数据
............
 #配置数据采集节点ceph-mgr1
  - job_name: 'ceph-cluster-data'
    static_configs:
    - targets: ['192.168.1.201:9283']
.........
# 重启prometheus
root@prometheus:/usr/local/prometheus# systemctl restart prometheus.service
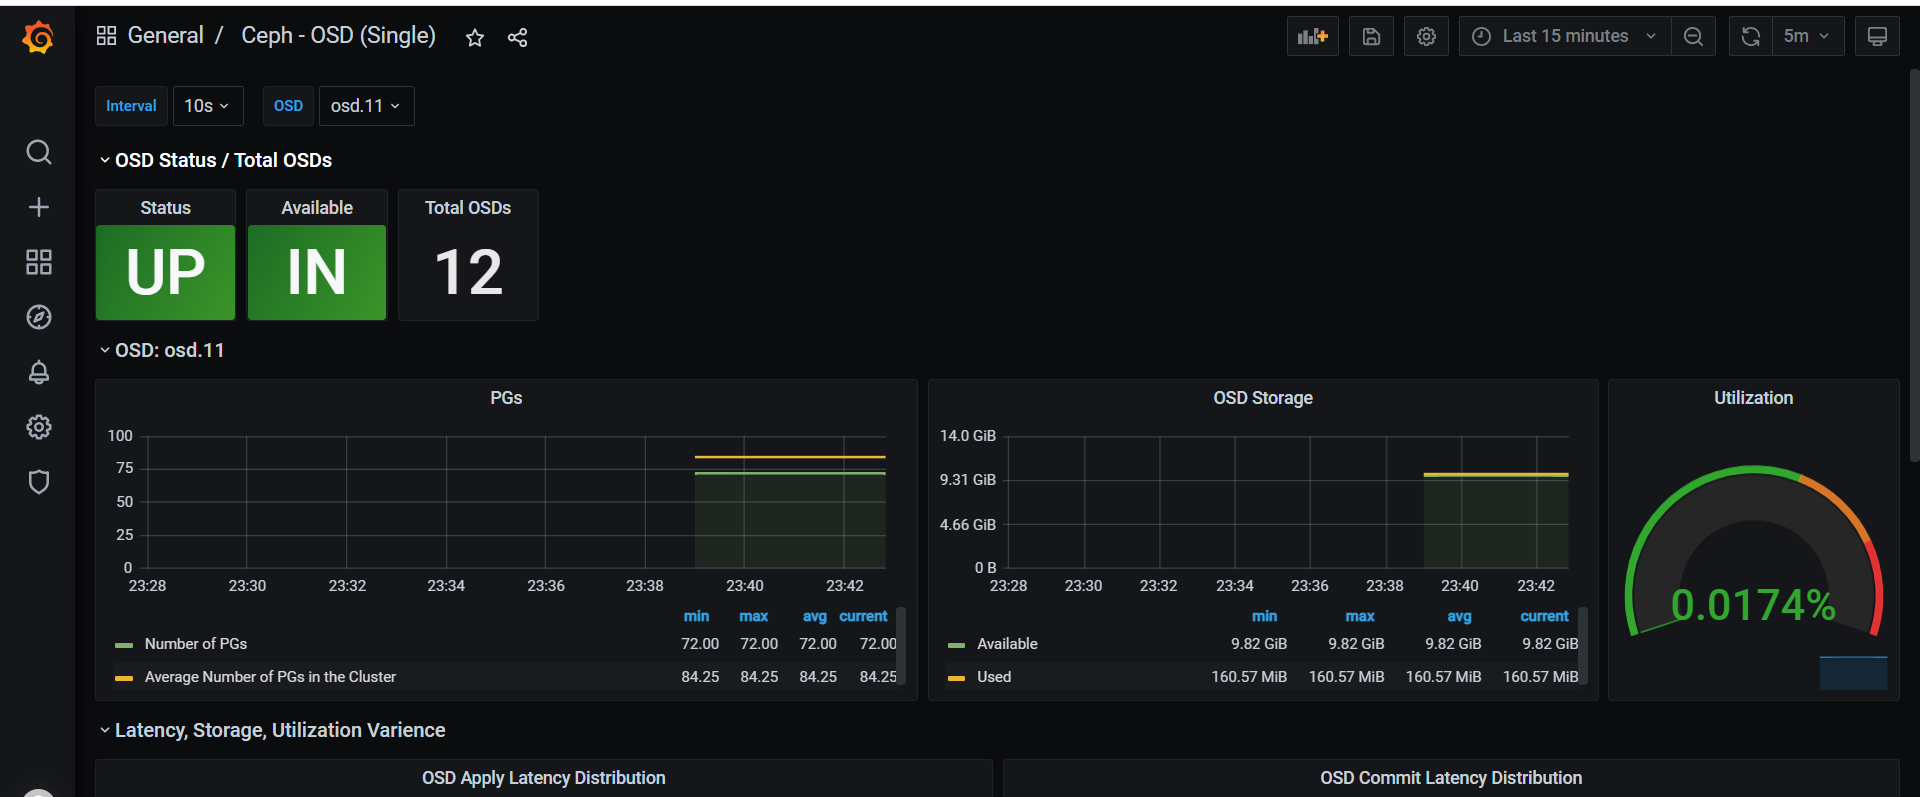
3、通过grafana来显示监控数据
1)导入模板
https://grafana.com/grafana/dashboards/5336 #ceph OSD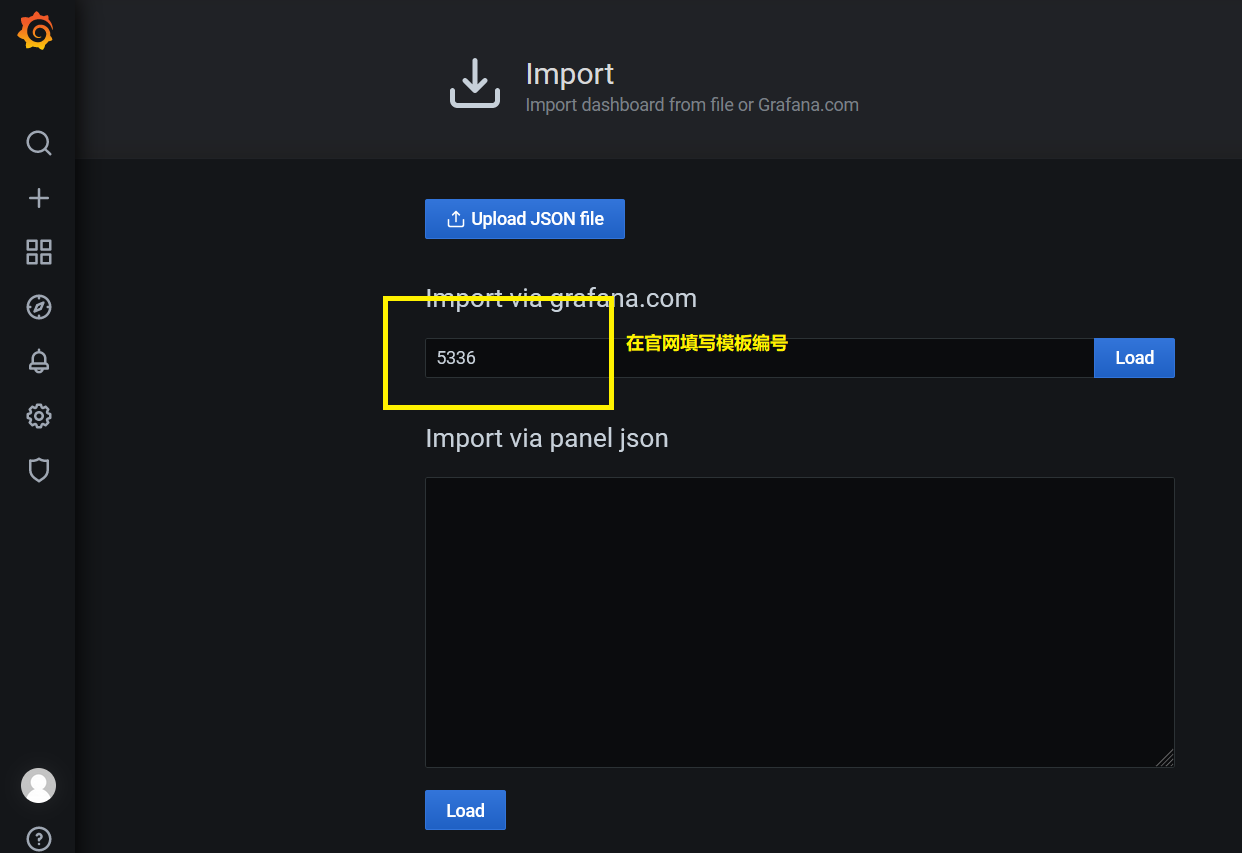
其他模板一样导入

https://grafana.com/grafana/dashboards/5342 #ceph pools

https://grafana.com/grafana/dashboards/7056 #ceph cluser

https://grafana.com/grafana/dashboards/2842

 浙公网安备 33010602011771号