


十九、Kubernetes之日志收集
一、k8s日志收集方案
1.在node上部署一个日志收集程序
DaemonSet方式部署日志收集程序对本节点的/var/log和/var/lib/docker/containers下的日志进行采集:
优点:配置简单、后期维护简单
缺点:日志类型不好分类

2.在pod中附加专用日志收集容器
每个运行应用程序的pod中增加一个日志收集容器,使用emptyDir共享日志目录让日志收集容器读取到日志数据
优点:低耦合、可以更好的对日志进行分类
缺点:每个pod启动一个日志收集代理,增加资源消耗,并增加运维维护成本

3.和第二种方案有点类似,但是在一个pod同一个容器中启动日志收集程序
每个运行应用程序的同一个容器中增加一个日志收集进程,先运行日志收集程序,在运行业务程序
优点:更简单、可以对日志类型更好的分类,无需使用共享存储
缺点:每个pod启动一个日志收集代理,增加资源消耗,并增加运维维护成本,对业务容器有一定侵入性,需要在业务容器中运行日志收集进程
4.应用程序直接推送日志
应用程序直接将日志推送到日志收集系统中
优点:无需运维介入,减少后期运维成本
缺点:对代码有一定侵入性

下面我们就用第二种方案来实践日志收集:
二、部署ELK日志收集系统
1、集群环境
1 2 3 4 5 6 7 8 9 10 11 12 13 14 15 16 17 18 | OS:root@harbor:~# cat /etc/issueUbuntu 20.04.2 LTS \n \l IP分配:192.168.88.100 k8s-deploy192.168.88.101 k8s-master etcd192.168.88.102 k8s-node1192.168.88.103 k8s-node2192.168.88.111 es-node1192.168.88.112 es-node2192.168.88.113 es-node2192.168.88.114 logstash192.168.88.121 kafka-node1192.168.88.122 kafka-node2192.168.88.123 kafka-node3 |
2、ELK架构图

3、部署es集群
下载安装elasticsearch 7.6.2 (地址:https://www.elastic.co/cn/downloads/past-releases#elasticsearch)
1 2 3 4 5 6 7 8 9 10 11 | # 在es所有节点上执行 dpkg -i elasticsearch-7.6.2-amd64.deb root@es-node1:~# dpkg -i elasticsearch-7.6.2-amd64.deb Selecting previously unselected package elasticsearch.(Reading database ... 71582 files and directories currently installed.)Preparing to unpack elasticsearch-7.6.2-amd64.deb ...Creating elasticsearch group... OKCreating elasticsearch user... OKUnpacking elasticsearch (7.6.2) ...Setting up elasticsearch (7.6.2) ...Created elasticsearch keystore in /etc/elasticsearchProcessing triggers for systemd (245.4-4ubuntu3.11) ... |
elasticsearch.yml
1 2 3 4 5 6 7 8 9 10 11 12 13 14 15 16 17 18 19 20 21 22 23 24 25 26 27 28 29 30 31 32 33 34 35 36 37 38 39 40 41 42 43 44 45 46 47 48 49 50 51 52 53 54 55 56 57 58 59 60 61 62 63 64 65 66 67 68 69 70 71 72 73 74 75 76 77 78 79 80 81 82 83 84 85 86 87 88 | # ======================== Elasticsearch Configuration =========================## NOTE: Elasticsearch comes with reasonable defaults for most settings.# Before you set out to tweak and tune the configuration, make sure you# understand what are you trying to accomplish and the consequences.## The primary way of configuring a node is via this file. This template lists# the most important settings you may want to configure for a production cluster.## Please consult the documentation for further information on configuration options:# https://www.elastic.co/guide/en/elasticsearch/reference/index.html## ---------------------------------- Cluster -----------------------------------## Use a descriptive name for your cluster:#cluster.name: zhrx-elk-cluster## ------------------------------------ Node ------------------------------------## Use a descriptive name for the node:#node.name: node1 #配置node节点名称## Add custom attributes to the node:##node.attr.rack: r1## ----------------------------------- Paths ------------------------------------## Path to directory where to store the data (separate multiple locations by comma):#path.data: /var/lib/elasticsearch## Path to log files:#path.logs: /var/log/elasticsearch## ----------------------------------- Memory -----------------------------------## Lock the memory on startup:##bootstrap.memory_lock: true## Make sure that the heap size is set to about half the memory available# on the system and that the owner of the process is allowed to use this# limit.## Elasticsearch performs poorly when the system is swapping the memory.## ---------------------------------- Network -----------------------------------## Set the bind address to a specific IP (IPv4 or IPv6):#network.host: 192.168.88.111 ##配置node节点网络监听地址## Set a custom port for HTTP:#http.port: 9200## For more information, consult the network module documentation.## --------------------------------- Discovery ----------------------------------## Pass an initial list of hosts to perform discovery when this node is started:# The default list of hosts is ["127.0.0.1", "[::1]"]#discovery.seed_hosts: ["192.168.88.111", "192.168.88.112", "192.168.88.113"]## Bootstrap the cluster using an initial set of master-eligible nodes:#cluster.initial_master_nodes: ["192.168.88.111", "192.168.88.112", "192.168.88.113"]## For more information, consult the discovery and cluster formation module documentation.## ---------------------------------- Gateway -----------------------------------## Block initial recovery after a full cluster restart until N nodes are started:#gateway.recover_after_nodes: 2## For more information, consult the gateway module documentation.## ---------------------------------- Various -----------------------------------## Require explicit names when deleting indices:#action.destructive_requires_name: true |
启动es
1 2 3 4 5 6 7 8 9 10 11 12 13 14 15 16 17 18 19 20 21 22 23 24 25 26 27 28 29 30 31 32 33 34 35 36 37 38 39 40 41 42 43 44 45 | root@es-node1:~# systemctl start elasticsearchroot@es-node2:~# systemctl start elasticsearchroot@es-node3:~# systemctl start elasticsearch# 查看es服务状态root@es-node1:~# systemctl status elasticsearch● elasticsearch.service - Elasticsearch Loaded: loaded (/lib/systemd/system/elasticsearch.service; disabled; vendor preset: enabled) Active: active (running) since Mon 2022-02-28 14:57:38 CST; 54s ago Docs: http://www.elastic.co Main PID: 3847 (java) Tasks: 40 (limit: 1071) Memory: 759.2M CGroup: /system.slice/elasticsearch.service ├─3847 /usr/share/elasticsearch/jdk/bin/java -Des.networkaddress.cache.ttl=60 -Des.networkaddress.cache.negative.ttl=10 -XX:+AlwaysPreTouch -Xss1m -Djava.awt.headless=true -Dfile.encoding=UTF-8 -> └─3932 /usr/share/elasticsearch/modules/x-pack-ml/platform/linux-x86_64/bin/controllerFeb 28 14:57:13 es-node1 systemd[1]: Starting Elasticsearch...Feb 28 14:57:13 es-node1 elasticsearch[3847]: OpenJDK 64-Bit Server VM warning: Option UseConcMarkSweepGC was deprecated in version 9.0 and will likely be removed in a future release.Feb 28 14:57:38 es-node1 systemd[1]: Started Elasticsearch.# es监听端口root@es-node1:~# netstat -tnlp | grep -E "9200|9300"tcp6 0 0 192.168.88.111:9200 :::* LISTEN 3847/java tcp6 0 0 192.168.88.111:9300 :::* LISTEN 3847/java# 获取es集群状态root@es-node1:~# curl http://192.168.88.111:9200{ "name" : "node1", "cluster_name" : "zhrx-elk-cluster", "cluster_uuid" : "jwcBNwVnTpmdaxr2-pIJ-A", "version" : { "number" : "7.6.2", "build_flavor" : "default", "build_type" : "deb", "build_hash" : "ef48eb35cf30adf4db14086e8aabd07ef6fb113f", "build_date" : "2020-03-26T06:34:37.794943Z", "build_snapshot" : false, "lucene_version" : "8.4.0", "minimum_wire_compatibility_version" : "6.8.0", "minimum_index_compatibility_version" : "6.0.0-beta1" }, "tagline" : "You Know, for Search"} |
通过elasticsearch head插件访问es集群

4、部署kafka集群
4.1、部署zookeeper
安装jdk
1 2 3 4 5 6 7 8 | root@kafka-node1:~# apt install openjdk-8-jdk -yroot@kafka-node2:~# apt install openjdk-8-jdk -y root@kafka-node3:~# apt install openjdk-8-jdk -yroot@kafka-node1:~# java -versionopenjdk version "1.8.0_312"OpenJDK Runtime Environment (build 1.8.0_312-8u312-b07-0ubuntu1~20.04-b07)OpenJDK 64-Bit Server VM (build 25.312-b07, mixed mode) |
安装zookeeper,下载地址:https://dlcdn.apache.org/zookeeper/zookeeper-3.5.9/apache-zookeeper-3.5.9-bin.tar.gz
1 2 3 4 5 6 7 8 9 10 11 12 13 14 15 16 17 | # 在所有kafka节点上以下操作root@kafka-node1:~# mkdir /appsroot@kafka-node1:~# mv apache-zookeeper-3.5.9-bin.tar.gz /apps/root@kafka-node1:~# cd /apps/root@kafka-node1:/apps# tar xf apache-zookeeper-3.5.9-bin.tar.gz root@kafka-node1:/apps# ln -sv apache-zookeeper-3.5.9-bin zookeeper'zookeeper' -> 'apache-zookeeper-3.5.9-bin'# 创建数据目录root@kafka-node1:/apps# mkdir -p /data/zookeeperroot@kafka-node2:/apps# mkdir -p /data/zookeeperroot@kafka-node3:/apps# mkdir -p /data/zookeeper# 创建id文件root@kafka-node1:/apps# echo 1 > /data/zookeeper/myidroot@kafka-node2:/apps# echo 2 > /data/zookeeper/myidroot@kafka-node3:/apps# echo 3 > /data/zookeeper/myid |
zookeeper配置文件/apps/zookeeper/conf/zoo.cfg,拷贝到所有kafka节点上并修改相应配置
1 2 3 4 5 6 7 8 9 10 11 12 13 14 15 16 17 18 19 20 21 22 23 24 25 26 27 28 29 30 31 32 | # The number of milliseconds of each ticktickTime=2000# The number of ticks that the initial # synchronization phase can takeinitLimit=10# The number of ticks that can pass between # sending a request and getting an acknowledgementsyncLimit=5# the directory where the snapshot is stored.# do not use /tmp for storage, /tmp here is just # example sakes.dataDir=/data/zookeeper# the port at which the clients will connectclientPort=2181# the maximum number of client connections.# increase this if you need to handle more clientsmaxClientCnxns=60## Be sure to read the maintenance section of the # administrator guide before turning on autopurge.## http://zookeeper.apache.org/doc/current/zookeeperAdmin.html#sc_maintenance## The number of snapshots to retain in dataDirautopurge.snapRetainCount=3# Purge task interval in hours# Set to "0" to disable auto purge featureautopurge.purgeInterval=1server.1=192.168.88.121:2888:3888server.2=192.168.88.122:2888:3888server.3=192.168.88.123:2888:3888 |
启动zookeeper集群
1 2 3 4 5 6 7 8 9 10 11 12 13 14 | # 在所有节点上启动zookeeperroot@kafka-node1:/apps/zookeeper# ./bin/zkServer.sh start/usr/bin/javaZooKeeper JMX enabled by defaultUsing config: /apps/zookeeper/bin/../conf/zoo.cfgStarting zookeeper ... STARTED# 查看集群状态root@kafka-node1:/apps/zookeeper# ./bin/zkServer.sh status/usr/bin/javaZooKeeper JMX enabled by defaultUsing config: /apps/zookeeper/bin/../conf/zoo.cfgClient port found: 2181. Client address: localhost. Client SSL: false.Mode: follower |
zookeeper集群安装完成
4.2、部署kafka
安装kafka集群,下载地址:https://archive.apache.org/dist/kafka/2.4.1/kafka_2.13-2.4.1.tgz
1 2 3 4 5 6 7 8 9 10 11 | # 接下kafka二进制包,在所有节点上执行root@kafka-node1:~# mv kafka_2.13-2.4.1.tgz /apps/root@kafka-node1:~# cd /apps/root@kafka-node1:/apps# tar xf kafka_2.13-2.4.1.tgz root@kafka-node1:/apps# ln -sv kafka_2.13-2.4.1 kafka'kafka' -> 'kafka_2.13-2.4.1'# 创建数据目录root@kafka-node1:/apps/kafka# mkdir -p /data/kafka-logsroot@kafka-node2:/apps/kafka# mkdir -p /data/kafka-logsroot@kafka-node3:/apps/kafka# mkdir -p /data/kafka-logs |
kafka配置文件/data/kafka/config/server.properties,拷贝到其他两个节点上并修改相应的配置
1 2 3 4 5 6 7 8 9 10 11 12 13 14 15 16 17 18 19 20 21 22 23 24 25 26 27 28 29 30 31 32 33 34 35 36 37 38 39 40 41 42 43 44 45 46 47 48 49 50 51 52 53 54 55 56 57 58 59 60 61 62 63 64 65 66 67 68 69 70 71 72 73 74 75 76 77 78 79 80 81 82 83 84 85 86 87 88 89 90 91 92 93 94 95 96 97 98 99 100 101 102 103 104 105 106 107 108 109 110 111 112 113 114 115 116 117 118 119 120 121 122 123 124 125 126 127 128 129 130 131 132 133 134 135 136 | # Licensed to the Apache Software Foundation (ASF) under one or more# contributor license agreements. See the NOTICE file distributed with# this work for additional information regarding copyright ownership.# The ASF licenses this file to You under the Apache License, Version 2.0# (the "License"); you may not use this file except in compliance with# the License. You may obtain a copy of the License at## http://www.apache.org/licenses/LICENSE-2.0## Unless required by applicable law or agreed to in writing, software# distributed under the License is distributed on an "AS IS" BASIS,# WITHOUT WARRANTIES OR CONDITIONS OF ANY KIND, either express or implied.# See the License for the specific language governing permissions and# limitations under the License.# see kafka.server.KafkaConfig for additional details and defaults############################# Server Basics ############################## The id of the broker. This must be set to a unique integer for each broker.broker.id=121 # 不同节点id不能冲突############################# Socket Server Settings ############################## The address the socket server listens on. It will get the value returned from # java.net.InetAddress.getCanonicalHostName() if not configured.# FORMAT:# listeners = listener_name://host_name:port# EXAMPLE:# listeners = PLAINTEXT://your.host.name:9092listeners=PLAINTEXT://192.168.88.121:9092 # 配置节点监听地址# Hostname and port the broker will advertise to producers and consumers. If not set, # it uses the value for "listeners" if configured. Otherwise, it will use the value# returned from java.net.InetAddress.getCanonicalHostName().#advertised.listeners=PLAINTEXT://your.host.name:9092# Maps listener names to security protocols, the default is for them to be the same. See the config documentation for more details#listener.security.protocol.map=PLAINTEXT:PLAINTEXT,SSL:SSL,SASL_PLAINTEXT:SASL_PLAINTEXT,SASL_SSL:SASL_SSL# The number of threads that the server uses for receiving requests from the network and sending responses to the networknum.network.threads=3# The number of threads that the server uses for processing requests, which may include disk I/Onum.io.threads=8# The send buffer (SO_SNDBUF) used by the socket serversocket.send.buffer.bytes=102400# The receive buffer (SO_RCVBUF) used by the socket serversocket.receive.buffer.bytes=102400# The maximum size of a request that the socket server will accept (protection against OOM)socket.request.max.bytes=104857600############################# Log Basics ############################## A comma separated list of directories under which to store log fileslog.dirs=/data/kafka-logs # 数据目录# The default number of log partitions per topic. More partitions allow greater# parallelism for consumption, but this will also result in more files across# the brokers.num.partitions=1# The number of threads per data directory to be used for log recovery at startup and flushing at shutdown.# This value is recommended to be increased for installations with data dirs located in RAID array.num.recovery.threads.per.data.dir=1############################# Internal Topic Settings ############################## The replication factor for the group metadata internal topics "__consumer_offsets" and "__transaction_state"# For anything other than development testing, a value greater than 1 is recommended to ensure availability such as 3.offsets.topic.replication.factor=1transaction.state.log.replication.factor=1transaction.state.log.min.isr=1############################# Log Flush Policy ############################## Messages are immediately written to the filesystem but by default we only fsync() to sync# the OS cache lazily. The following configurations control the flush of data to disk.# There are a few important trade-offs here:# 1. Durability: Unflushed data may be lost if you are not using replication.# 2. Latency: Very large flush intervals may lead to latency spikes when the flush does occur as there will be a lot of data to flush.# 3. Throughput: The flush is generally the most expensive operation, and a small flush interval may lead to excessive seeks.# The settings below allow one to configure the flush policy to flush data after a period of time or# every N messages (or both). This can be done globally and overridden on a per-topic basis.# The number of messages to accept before forcing a flush of data to disk#log.flush.interval.messages=10000# The maximum amount of time a message can sit in a log before we force a flush#log.flush.interval.ms=1000############################# Log Retention Policy ############################## The following configurations control the disposal of log segments. The policy can# be set to delete segments after a period of time, or after a given size has accumulated.# A segment will be deleted whenever *either* of these criteria are met. Deletion always happens# from the end of the log.# The minimum age of a log file to be eligible for deletion due to agelog.retention.hours=168# A size-based retention policy for logs. Segments are pruned from the log unless the remaining# segments drop below log.retention.bytes. Functions independently of log.retention.hours.#log.retention.bytes=1073741824# The maximum size of a log segment file. When this size is reached a new log segment will be created.log.segment.bytes=1073741824# The interval at which log segments are checked to see if they can be deleted according# to the retention policieslog.retention.check.interval.ms=300000############################# Zookeeper ############################## Zookeeper connection string (see zookeeper docs for details).# This is a comma separated host:port pairs, each corresponding to a zk# server. e.g. "127.0.0.1:3000,127.0.0.1:3001,127.0.0.1:3002".# You can also append an optional chroot string to the urls to specify the# root directory for all kafka znodes.zookeeper.connect=192.168.88.121:2181,192.168.88.122:2181,192.168.88.123:2181 # 连接zookeeper地址# Timeout in ms for connecting to zookeeperzookeeper.connection.timeout.ms=6000############################# Group Coordinator Settings ############################## The following configuration specifies the time, in milliseconds, that the GroupCoordinator will delay the initial consumer rebalance.# The rebalance will be further delayed by the value of group.initial.rebalance.delay.ms as new members join the group, up to a maximum of max.poll.interval.ms.# The default value for this is 3 seconds.# We override this to 0 here as it makes for a better out-of-the-box experience for development and testing.# However, in production environments the default value of 3 seconds is more suitable as this will help to avoid unnecessary, and potentially expensive, rebalances during application startup.group.initial.rebalance.delay.ms=0 |
启动kafka
1 2 3 4 5 6 7 8 9 | # 在所有节点上启动kafkaroot@kafka-node1:/apps#/apps/kafka/bin/kafka-server-start.sh -daemon /apps/kafka/config/server.propertiesroot@kafka-node2:/apps#/apps/kafka/bin/kafka-server-start.sh -daemon /apps/kafka/config/server.propertiesroot@kafka-node3:/apps#/apps/kafka/bin/kafka-server-start.sh -daemon /apps/kafka/config/server.properties# 查看端口是否监听root@kafka-node1:/apps/kafka# netstat -tnlp|grep 9092tcp6 0 0 192.168.88.121:9092 :::* LISTEN 7084/java |
5、部署logstash
下载安装logstash,地址:https://artifacts.elastic.co/downloads/logstash/logstash-7.6.2.deb
1 2 3 4 5 6 7 8 9 10 11 12 13 | # 安装jdkroot@logstash:~# apt install openjdk-8-jdk# 安装logstashroot@logstash:~# dpkg -i logstash-7.6.2.deb Selecting previously unselected package logstash.(Reading database ... 87206 files and directories currently installed.)Preparing to unpack logstash-7.6.2.deb ...Unpacking logstash (1:7.6.2-1) ...Setting up logstash (1:7.6.2-1) ...Using provided startup.options file: /etc/logstash/startup.options/usr/share/logstash/vendor/bundle/jruby/2.5.0/gems/pleaserun-0.0.30/lib/pleaserun/platform/base.rb:112: warning: constant ::Fixnum is deprecatedSuccessfully created system startup script for Logstash |
logstash配置文件/etc/logstash/conf.d/kafka-to-es.conf
1 2 3 4 5 6 7 8 9 10 11 12 13 14 15 16 17 18 19 20 21 22 23 24 25 26 27 | input { kafka { bootstrap_servers => "192.168.88.121:9092,192.168.88.122:9092,192.168.88.123:9092" topics => ["tomcat-app"] codec => "json" }}output { if [fields][type] == "tomcat-accesslog" { elasticsearch { hosts => ["192.168.88.111:9200","192.168.88.112:9200","192.168.88.113:9200"] index => "tomcat-accesslog-%{+YYYY.MM.dd}" } } if [fields][type] == "tomcat-catalina" { elasticsearch { hosts => ["192.168.88.111:9200","192.168.88.112:9200","192.168.88.113:9200"] index => "tomcat-catalinalog-%{+YYYY.MM.dd}" } }# stdout { # codec => rubydebug# }} |
启动logstash
1 2 3 4 5 6 7 8 9 10 11 12 13 14 15 16 17 18 19 20 21 22 23 24 | root@logstash:/etc/logstash# /usr/share/logstash/bin/logstash -f /etc/logstash/conf.d/kafka-to-es.conf WARNING: Could not find logstash.yml which is typically located in $LS_HOME/config or /etc/logstash. You can specify the path using --path.settings. Continuing using the defaultsCould not find log4j2 configuration at path /usr/share/logstash/config/log4j2.properties. Using default config which logs errors to the console[INFO ] 2022-03-01 03:38:53.260 [main] writabledirectory - Creating directory {:setting=>"path.queue", :path=>"/usr/share/logstash/data/queue"}[INFO ] 2022-03-01 03:38:53.277 [main] writabledirectory - Creating directory {:setting=>"path.dead_letter_queue", :path=>"/usr/share/logstash/data/dead_letter_queue"}[WARN ] 2022-03-01 03:38:53.494 [LogStash::Runner] multilocal - Ignoring the 'pipelines.yml' file because modules or command line options are specified[INFO ] 2022-03-01 03:38:53.498 [LogStash::Runner] runner - Starting Logstash {"logstash.version"=>"7.6.2"}[INFO ] 2022-03-01 03:38:53.513 [LogStash::Runner] agent - No persistent UUID file found. Generating new UUID {:uuid=>"f19b6f7f-4b61-41d4-b9c6-2f49d1a53567", :path=>"/usr/share/logstash/data/uuid"}[INFO ] 2022-03-01 03:38:54.885 [Converge PipelineAction::Create<main>] Reflections - Reflections took 30 ms to scan 1 urls, producing 20 keys and 40 values [INFO ] 2022-03-01 03:38:55.468 [[main]-pipeline-manager] elasticsearch - Elasticsearch pool URLs updated {:changes=>{:removed=>[], :added=>[http://192.168.88.111:9200/, http://192.168.88.112:9200/, http://192.168.88.113:9200/]}}[WARN ] 2022-03-01 03:38:55.610 [[main]-pipeline-manager] elasticsearch - Restored connection to ES instance {:url=>"http://192.168.88.111:9200/"}[INFO ] 2022-03-01 03:38:55.737 [[main]-pipeline-manager] elasticsearch - ES Output version determined {:es_version=>7}[WARN ] 2022-03-01 03:38:55.739 [[main]-pipeline-manager] elasticsearch - Detected a 6.x and above cluster: the `type` event field won't be used to determine the document _type {:es_version=>7}[WARN ] 2022-03-01 03:38:55.837 [[main]-pipeline-manager] elasticsearch - Restored connection to ES instance {:url=>"http://192.168.88.112:9200/"}[WARN ] 2022-03-01 03:38:56.119 [[main]-pipeline-manager] elasticsearch - Restored connection to ES instance {:url=>"http://192.168.88.113:9200/"}[INFO ] 2022-03-01 03:38:56.309 [[main]-pipeline-manager] elasticsearch - New Elasticsearch output {:class=>"LogStash::Outputs::ElasticSearch", :hosts=>["//192.168.88.111:9200", "//192.168.88.112:9200", "//192.168.88.113:9200"]}[INFO ] 2022-03-01 03:38:56.321 [[main]-pipeline-manager] elasticsearch - Elasticsearch pool URLs updated {:changes=>{:removed=>[], :added=>[http://192.168.88.111:9200/, http://192.168.88.112:9200/, http://192.168.88.113:9200/]}}[WARN ] 2022-03-01 03:38:56.338 [[main]-pipeline-manager] elasticsearch - Restored connection to ES instance {:url=>"http://192.168.88.111:9200/"}[INFO ] 2022-03-01 03:38:56.342 [[main]-pipeline-manager] elasticsearch - ES Output version determined {:es_version=>7}[WARN ] 2022-03-01 03:38:56.343 [[main]-pipeline-manager] elasticsearch - Detected a 6.x and above cluster: the `type` event field won't be used to determine the document _type {:es_version=>7}[INFO ] 2022-03-01 03:38:56.382 [Ruby-0-Thread-6: :1] elasticsearch - Using default mapping template[WARN ] 2022-03-01 03:38:56.385 [[main]-pipeline-manager] elasticsearch - Restored connection to ES instance {:url=>"http://192.168.88.112:9200/"}[WARN ] 2022-03-01 03:38:56.435 [[main]-pipeline-manager] elasticsearch - Restored connection to ES instance {:url=>"http://192.168.88.113:9200/"}........................... |
6、部署kibana
在logstash主机上安装kibana,地址:https://artifacts.elastic.co/downloads/kibana/kibana-7.6.2-amd64.deb
1 2 3 4 5 6 7 | root@logstash:~# dpkg -i kibana-7.6.2-amd64.deb Selecting previously unselected package kibana.(Reading database ... 103194 files and directories currently installed.)Preparing to unpack kibana-7.6.2-amd64.deb ...Unpacking kibana (7.6.2) ...Setting up kibana (7.6.2) ...Processing triggers for systemd (245.4-4ubuntu3.11) ... |
kibana配置文件
1 2 3 4 5 6 7 8 9 10 11 12 13 14 15 16 17 18 19 20 21 22 23 24 25 26 27 28 29 30 31 32 33 34 35 36 37 38 39 40 41 42 43 44 45 46 47 48 49 50 51 52 53 54 55 56 57 58 59 60 61 62 63 64 65 66 67 68 69 70 71 72 73 74 75 76 77 78 79 80 81 82 83 84 85 86 87 88 89 90 91 92 93 94 95 96 97 98 99 100 101 102 103 104 105 106 107 108 109 110 111 112 113 114 115 | # Kibana is served by a back end server. This setting specifies the port to use.server.port: 5601# Specifies the address to which the Kibana server will bind. IP addresses and host names are both valid values.# The default is 'localhost', which usually means remote machines will not be able to connect.# To allow connections from remote users, set this parameter to a non-loopback address.server.host: "192.168.88.114"# Enables you to specify a path to mount Kibana at if you are running behind a proxy.# Use the `server.rewriteBasePath` setting to tell Kibana if it should remove the basePath# from requests it receives, and to prevent a deprecation warning at startup.# This setting cannot end in a slash.#server.basePath: ""# Specifies whether Kibana should rewrite requests that are prefixed with# `server.basePath` or require that they are rewritten by your reverse proxy.# This setting was effectively always `false` before Kibana 6.3 and will# default to `true` starting in Kibana 7.0.#server.rewriteBasePath: false# The maximum payload size in bytes for incoming server requests.#server.maxPayloadBytes: 1048576# The Kibana server's name. This is used for display purposes.#server.name: "your-hostname"# The URLs of the Elasticsearch instances to use for all your queries.elasticsearch.hosts: ["http://192.168.88.111:9200"]# When this setting's value is true Kibana uses the hostname specified in the server.host# setting. When the value of this setting is false, Kibana uses the hostname of the host# that connects to this Kibana instance.#elasticsearch.preserveHost: true# Kibana uses an index in Elasticsearch to store saved searches, visualizations and# dashboards. Kibana creates a new index if the index doesn't already exist.#kibana.index: ".kibana"# The default application to load.#kibana.defaultAppId: "home"# If your Elasticsearch is protected with basic authentication, these settings provide# the username and password that the Kibana server uses to perform maintenance on the Kibana# index at startup. Your Kibana users still need to authenticate with Elasticsearch, which# is proxied through the Kibana server.#elasticsearch.username: "kibana"#elasticsearch.password: "pass"# Enables SSL and paths to the PEM-format SSL certificate and SSL key files, respectively.# These settings enable SSL for outgoing requests from the Kibana server to the browser.#server.ssl.enabled: false#server.ssl.certificate: /path/to/your/server.crt#server.ssl.key: /path/to/your/server.key# Optional settings that provide the paths to the PEM-format SSL certificate and key files.# These files are used to verify the identity of Kibana to Elasticsearch and are required when# xpack.security.http.ssl.client_authentication in Elasticsearch is set to required.#elasticsearch.ssl.certificate: /path/to/your/client.crt#elasticsearch.ssl.key: /path/to/your/client.key# Optional setting that enables you to specify a path to the PEM file for the certificate# authority for your Elasticsearch instance.#elasticsearch.ssl.certificateAuthorities: [ "/path/to/your/CA.pem" ]# To disregard the validity of SSL certificates, change this setting's value to 'none'.#elasticsearch.ssl.verificationMode: full# Time in milliseconds to wait for Elasticsearch to respond to pings. Defaults to the value of# the elasticsearch.requestTimeout setting.#elasticsearch.pingTimeout: 1500# Time in milliseconds to wait for responses from the back end or Elasticsearch. This value# must be a positive integer.#elasticsearch.requestTimeout: 30000# List of Kibana client-side headers to send to Elasticsearch. To send *no* client-side# headers, set this value to [] (an empty list).#elasticsearch.requestHeadersWhitelist: [ authorization ]# Header names and values that are sent to Elasticsearch. Any custom headers cannot be overwritten# by client-side headers, regardless of the elasticsearch.requestHeadersWhitelist configuration.#elasticsearch.customHeaders: {}# Time in milliseconds for Elasticsearch to wait for responses from shards. Set to 0 to disable.#elasticsearch.shardTimeout: 30000# Time in milliseconds to wait for Elasticsearch at Kibana startup before retrying.#elasticsearch.startupTimeout: 5000# Logs queries sent to Elasticsearch. Requires logging.verbose set to true.#elasticsearch.logQueries: false# Specifies the path where Kibana creates the process ID file.#pid.file: /var/run/kibana.pid# Enables you specify a file where Kibana stores log output.#logging.dest: stdout# Set the value of this setting to true to suppress all logging output.#logging.silent: false# Set the value of this setting to true to suppress all logging output other than error messages.#logging.quiet: false# Set the value of this setting to true to log all events, including system usage information# and all requests.#logging.verbose: false# Set the interval in milliseconds to sample system and process performance# metrics. Minimum is 100ms. Defaults to 5000.#ops.interval: 5000# Specifies locale to be used for all localizable strings, dates and number formats.# Supported languages are the following: English - en , by default , Chinese - zh-CN .i18n.locale: "zh-CN" |
启动kibana
1 2 3 4 | root@logstash:~# systemctl start kibanaroot@logstash:~# netstat -tnlp | grep 5601tcp 0 0 192.168.88.114:5601 0.0.0.0:* LISTEN 6443/node root@logstash:~# |
访问kibana

三、收集pod日志
1.构建filebeat镜像
下载filebeat包,地址:https://www.elastic.co/cn/downloads/past-releases/filebeat-7-6-2
1 2 3 4 5 6 7 8 9 10 11 12 13 14 15 16 17 18 19 20 21 22 23 24 25 26 27 28 29 30 31 32 33 34 35 36 37 38 39 40 41 42 43 44 45 46 47 48 49 | # 目录结构root@k8s-deploy:~# cd dockerfile/filebeat/root@k8s-deploy:~/dockerfile/filebeat# lsDockerfile filebeat-7.6.2-amd64.deb start.shroot@k8s-deploy:~/dockerfile/filebeat# cat Dockerfile FROM ubuntu:latestCOPY filebeat-7.6.2-amd64.deb /tmp/COPY start.sh /RUN dpkg -i /tmp/filebeat-7.6.2-amd64.debCMD ["/start.sh"]root@k8s-deploy:~/dockerfile/filebeat# cat start.sh #!/bin/bash/usr/share/filebeat/bin/filebeat -e -c /etc/filebeat/filebeat.yml -path.home /usr/share/filebeat/ -path.config /etc/filebeat/ -path.data /var/lib/filebeat/ -path.logs /var/log/filebeat/# 构建镜像并推送到harborroot@k8s-deploy:~/dockerfile/filebeat# docker build -t harbor.zhrx.com/baseimages/filebeat:7.6.2 ./Sending build context to Docker daemon 25.08MBStep 1/5 : FROM ubuntu:latest ---> 54c9d81cbb44Step 2/5 : COPY filebeat-7.6.2-amd64.deb /tmp/ ---> a177696affedStep 3/5 : COPY start.sh / ---> 478413f958dbStep 4/5 : RUN dpkg -i /tmp/filebeat-7.6.2-amd64.deb ---> Running in 357f27d24a45Selecting previously unselected package filebeat.(Reading database ... 4127 files and directories currently installed.)Preparing to unpack /tmp/filebeat-7.6.2-amd64.deb ...Unpacking filebeat (7.6.2) ...Setting up filebeat (7.6.2) ...Removing intermediate container 357f27d24a45 ---> d53c35fb0718Step 5/5 : CMD ["/start.sh"] ---> Running in aa87e42ef210Removing intermediate container aa87e42ef210 ---> 3e77efe66f2eSuccessfully built 3e77efe66f2eSuccessfully tagged harbor.zhrx.com/baseimages/filebeat:7.6.2root@k8s-deploy:~/dockerfile/filebeat# docker push harbor.zhrx.com/baseimages/filebeat:7.6.2The push refers to repository [harbor.zhrx.com/baseimages/filebeat]cbec1e065e40: Pushed 49a0b43eaeb5: Pushed 9198cc67bb2b: Pushed 36ffdceb4c77: Pushed 7.6.2: digest: sha256:a5509a9d534997e25c07dedadacaccfea3c55ef8e72b07fba946b132891421c8 size: 1160root@k8s-deploy:~/dockerfile/filebeat# |
filebeat配置文件,以configmap的方式提供配置
1 2 3 4 5 6 7 8 9 10 11 12 13 14 15 16 17 18 19 20 21 22 23 24 25 26 27 28 29 30 31 32 33 | root@k8s-deploy:~# cat filebeat-config.yml apiVersion: v1kind: ConfigMapmetadata: name: filebeat-configdata: filebeat.yml: |- filebeat.inputs: - type: log enabled: true paths: - /usr/local/tomcat/logs/catalina.*.log fields: type: tomcat-catalina - type: log enabled: true paths: - /usr/local/tomcat/logs/localhost_access_log.*.txt fields: type: tomcat-accesslog filebeat.config.modules: path: ${path.config}/modules.d/*.yml reload.enabled: false setup.template.settings: index.number_of_shards: 1 setup.kibana: output.kafka: hosts: ["192.168.88.121:9092"] required_acks: 1 topic: "tomcat-app" compression: gzip max_message_bytes: 1000000 |
2、运行tomcat pod
tomcat.yml
1 2 3 4 5 6 7 8 9 10 11 12 13 14 15 16 17 18 19 20 21 22 23 24 25 26 27 28 29 30 31 32 33 34 35 36 37 38 39 40 41 42 43 44 45 46 47 48 49 50 51 52 53 54 55 56 57 58 59 60 61 | apiVersion: apps/v1kind: Deploymentmetadata: labels: app: tomcat-app name: tomcat-appspec: replicas: 1 selector: matchLabels: app: tomcat-app template: metadata: labels: app: tomcat-app spec: imagePullSecrets: - name: harbor containers: - name: filebeat image: harbor.zhrx.com/baseimages/filebeat:7.6.2 imagePullPolicy: IfNotPresent volumeMounts: - name: log mountPath: /usr/local/tomcat/logs - name: filebeat-config mountPath: /etc/filebeat/filebeat.yml subPath: filebeat.yml - name: tomcat image: harbor.zhrx.com/baseimages/tomcat:7.0.94-alpine imagePullPolicy: IfNotPresent ports: - containerPort: 8080 protocol: TCP name: http volumeMounts: - name: log mountPath: /usr/local/tomcat/logs volumes: - name: log emptyDir: {} - name: filebeat-config configMap: name: filebeat-config---kind: ServiceapiVersion: v1metadata: labels: app: tomcat-svc name: tomcat-svcspec: type: NodePort ports: - name: http port: 80 protocol: TCP targetPort: 8080 nodePort: 30005 selector: app: tomcat-app |

3、验证数据
此时kafka里已经可与看到tomcat-app这个topic的数据

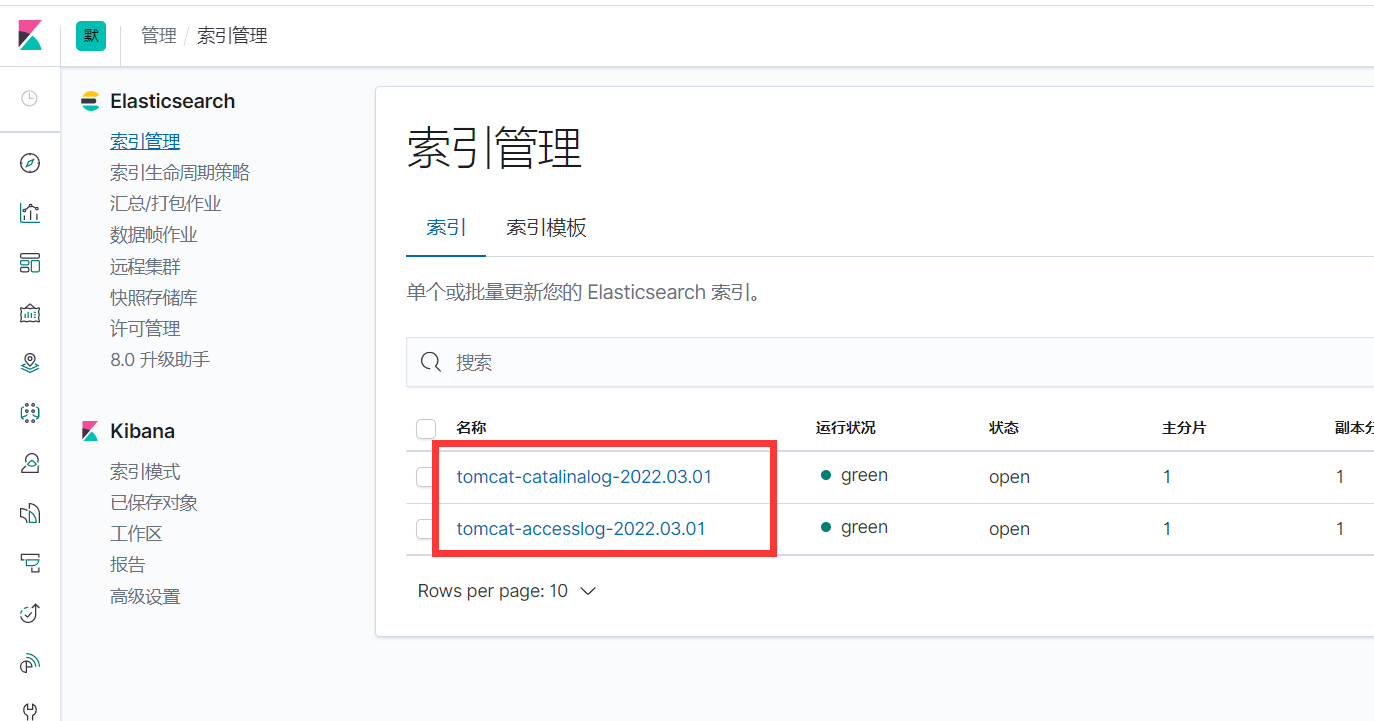
es集群里也有了数据

kibana里也已经有了索引数据
4、kibana添加索引
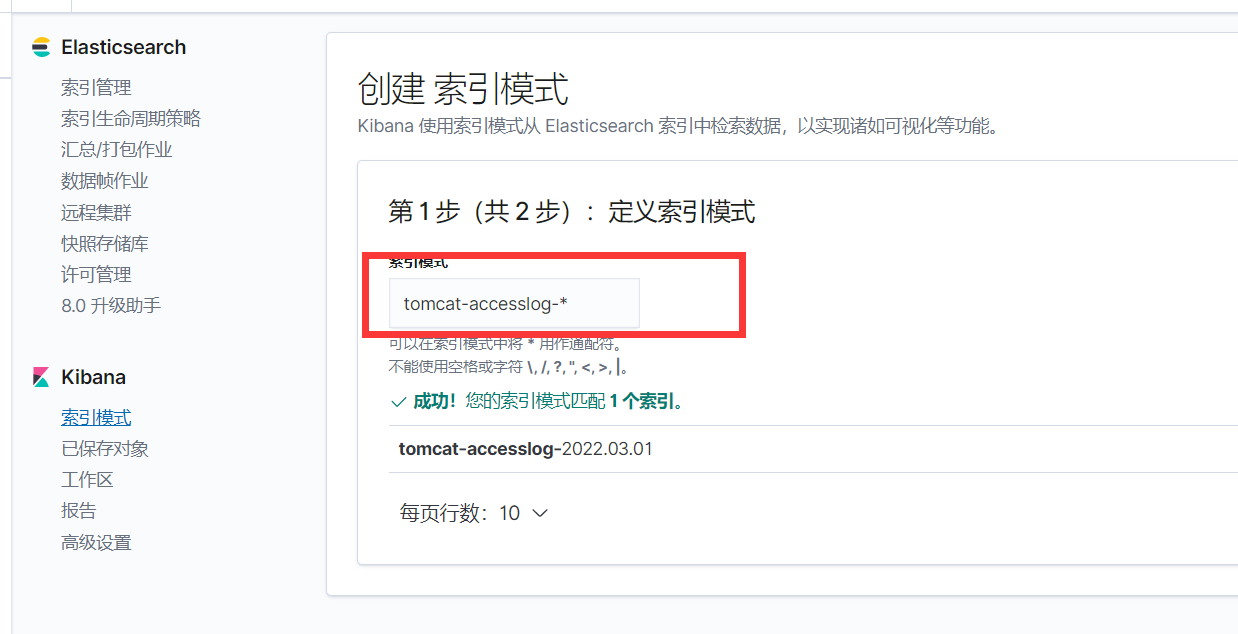
至此 就可以通过kibana查看日志了

完结


【推荐】国内首个AI IDE,深度理解中文开发场景,立即下载体验Trae
【推荐】编程新体验,更懂你的AI,立即体验豆包MarsCode编程助手
【推荐】抖音旗下AI助手豆包,你的智能百科全书,全免费不限次数
【推荐】轻量又高性能的 SSH 工具 IShell:AI 加持,快人一步
· winform 绘制太阳,地球,月球 运作规律
· AI与.NET技术实操系列(五):向量存储与相似性搜索在 .NET 中的实现
· 超详细:普通电脑也行Windows部署deepseek R1训练数据并当服务器共享给他人
· 上周热点回顾(3.3-3.9)
· AI 智能体引爆开源社区「GitHub 热点速览」