Python- matplotlib使用方法大全
Matplotlib使用方法大全
一:绘制基础的折线图
 1 #encoding:utf-8
 2 import matplotlib.pyplot as plt
 3
 4 def test1():
 5     # 基础折线图绘制
 6     # 绘制(0,0),(1,1),(2,1),(3,3)四个点连成的折线
 7     x = [0, 1, 2, 3]
 8     y = [0, 1, 1, 3]
 9     plt.plot(x, y)
10     plt.show()

二: 修改折线图颜色或者线的形状
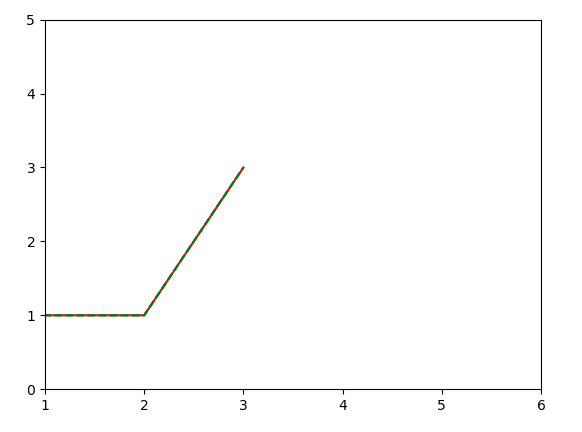
def test2():
    # 修改折线图的颜色 / 线的形状
    x = [0, 1, 2, 3]
    y = [0, 1, 1, 3]
    plt.plot(x, y, "r")  # 修改颜色, rgb=红绿蓝
    plt.plot(x, y, "--")    # 修改线的形状为虚线, 默认为折线"-", "o" 为点 “^" 为三角
    plt.plot(x, y, "g--")    #  一起修改为绿色虚线
    plt.axis([1, 6, 0, 5])   # 修改坐标轴x刻度显示
    plt.show()
三:只传入一维数据
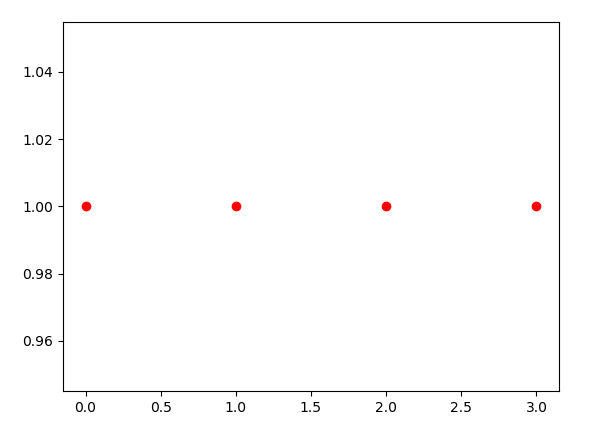
plt.plot(x, y)接收点集(x, y),当只输入一维数据的时候默认当做y坐标轴处理,x坐标轴默认为为[0,1,2....]
def test3():
    y = [1, 1, 1, 1]
    plt.plot(y, "ro")
    plt.show()
四:当传入list时也会转成numpy.array(性能会好些)
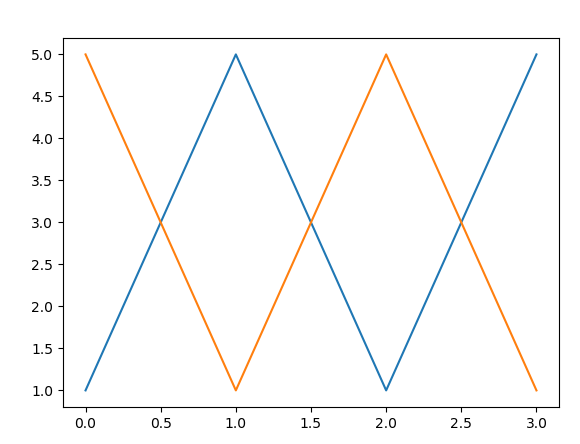
import numpy as np
def test4():
    t1 = [1, 5, 1, 5]
    t2 = np.array([5, 1, 5, 1])
    plt.plot(t1, "g-")
    plt.plot(t2, "ro")
    plt.show()
五:一张图中显示多张图表
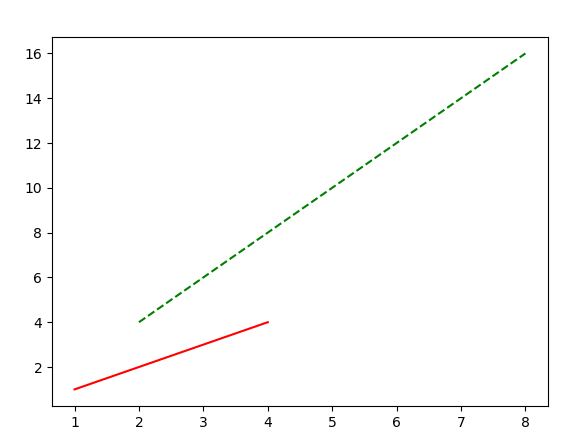
在例4中分别使用了两次plt.plot()进行加载,可以用一条语句
plt.plot(t1, "b--",t2, "r--")
def test5():
    # 在一张图表中显示多个图表
    x1 = [1, 2, 3, 4]
    y1 = [1, 2, 3, 4]
    x2 = [2, 4, 6, 8]
    y2 = [4, 8, 12, 16]
    plt.plot(x1, y1, "r-", x2,  y2, "g--")
    plt.show()
六:绘制标准函数sin()与cos()
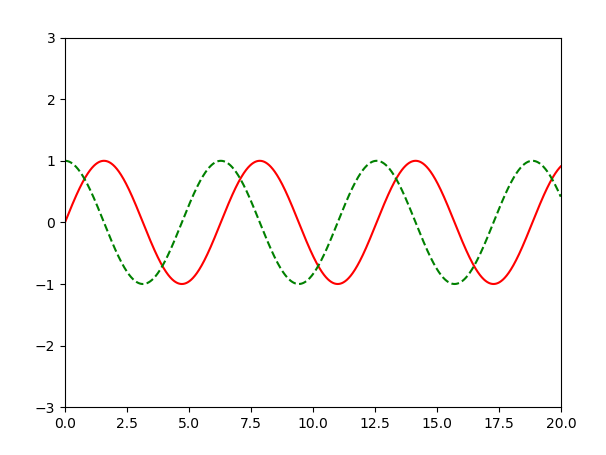
def test6():
    # 绘制标准函数曲线: sin()与cos()
    # 绘制f(x)=sin(x) 和g(x)=cos(x) 在x∈[0,20]中的图像
    x = np.arange(0, 20, 0.01)
    plt.plot(x, np.sin(x), "r-", x, np.cos(x), "g--")
    # x坐标轴区间: [0, 20] y坐标轴区间: [-3, 3]
    plt.axis([0, 20, -3, 3])
    plt.show()
七: 显示背景网格线
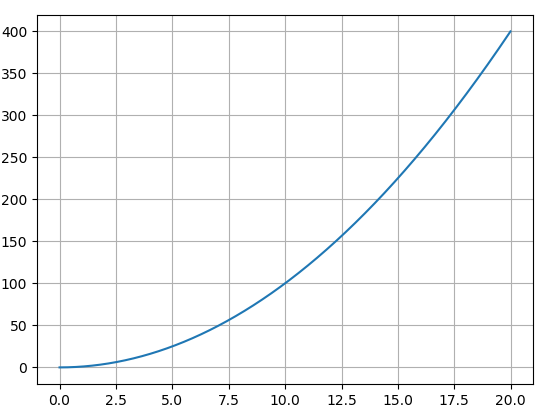
def test7():
    x = np.arange(0, 20, 0.01)
    plt.plot(x, x**2)
    # 设置是否显示网格线
    plt.grid(True)
    plt.show()
八: 对图表进行标注及对文本属性的设置
def test8():
    # 增加标注
    x = np.arange(0, 20, 0.01)
    plt.plot(x, x**2)
    # 设置x, y坐标轴的名称
    # 对x坐标轴的文本内容进行设置
    plt.xlabel("Money Earned", color="r", fontsize=20)
    # plt.xlabel("Money Earned")
    plt.ylabel("Consume Level")
    # 显示网格
    plt.grid(True)
    # 增加标题
    plt.title("Figure.1")
    # 图内文字
    # 指定x坐标轴和y坐标轴,文字本身
    plt.text(2.5, 100, "TEXT1")
    # 箭头指示
    # 指定文字, 箭头指定方向,文字显示的坐标, 箭头的属性
    plt.annotate("max value", xy=(20, 400), xytext=(12.5, 400), arrowprops=dict(facecolor="black", shrink=0.05),)
    plt.show()

对文本属性设置参数简介(https://matplotlib.org/api/text_api.html#matplotlib.text.Text)
常用参数介绍:

九: 设置曲线属性
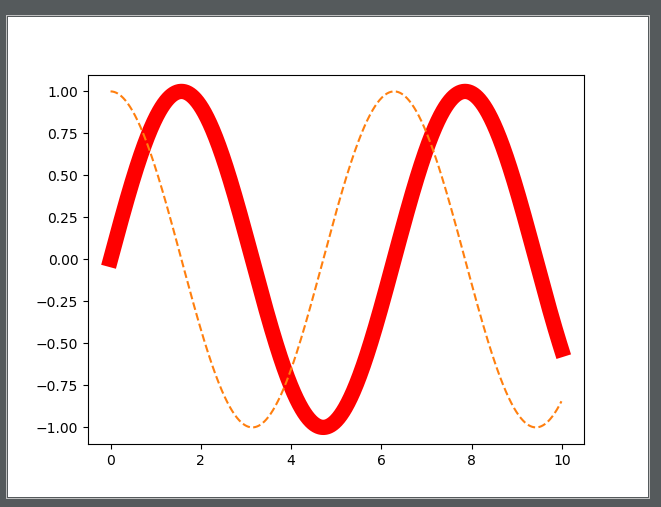
plt.plot()返回matplotlib.lines.Line2D, 可以通过变量获得并修改曲线Line2D的属性
def test9():
    # 设置曲线属性
    # plt.plot()返回matplotlib.lines.Line2D,可以通过变量获得并修改曲线Line2D的属性
    x = np.arange(0, 10, 0.01)
    line1, line2 = plt.plot(x, np.sin(x), "-", x, np.cos(x), "--")
    plt.setp(line1, color="r", linewidth="11.0")   # 设置曲线的宽度
    plt.show()
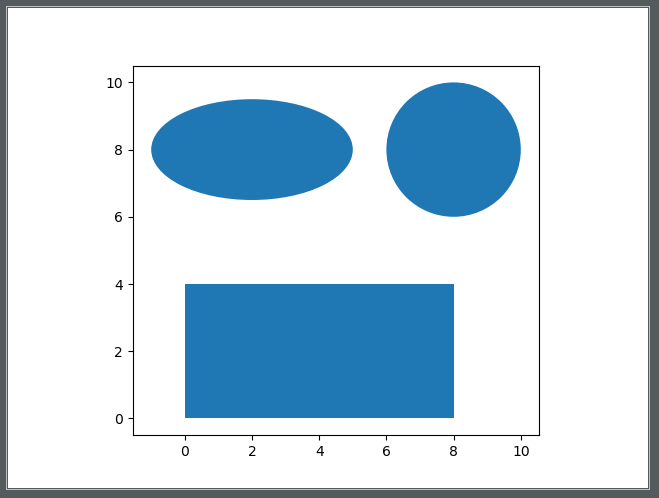
十: 绘制图形: 圆形,矩形,椭圆
import matplotlib.patches as patches
def test10():
    # 绘制圆形
    fig = plt.figure()
    ax1 = fig.add_subplot(111, aspect="equal")    # 1X1一张图中的第一张, equal为等宽显示
    rec = patches.Rectangle((0, 0), 8, 4)    # 顶点坐标(0,0) 宽w=8, 高h=4
    cir = patches.Circle((8, 8), 2)    # 圆心坐标(8,8) 半径r
    ell = patches.Ellipse((2, 8), 6, 3)    # 椭圆左顶点坐标(2, 8) 长轴6 短轴3
    ax1.add_patch(rec)
    ax1.add_patch(cir)
    ax1.add_patch(ell)
    plt.plot()
    plt.show()
十一: 绘制标准正态分布-直方图
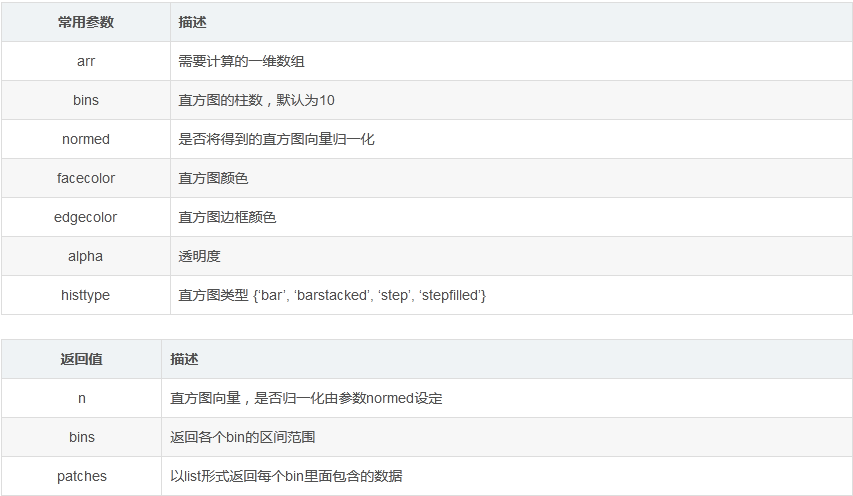
plt.hist() 绘制直方图
def test11():
    # 绘制直方图-标准正态分布
    mu, sigma = 0, 1
    x = np.random.normal(mu, sigma, 10000)
    # x: 一维数组,  : 直方图的柱数,默认为10, facecolor: 直方图颜色 alpha: 透明度
    # 返回值: n:直方图向量  bins: 返回各个bin的区间范围  patches: 以list形式返回每个bin里面包含的数据
    plt.hist(x, bins=100, facecolor="g", alpha=0.75)
    plt.text(-3, 250, r'$\mu=0,\ \sigma=1$')
    plt.grid(True)
    plt.show()

十二::绘制散点图
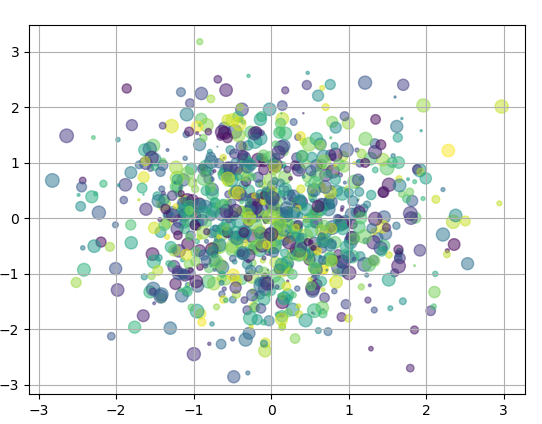
plt.scatter() 绘制散点图

def test12():
    # 绘制散点图
    # x: x坐标轴集合  y: y坐标轴集合  c : 散点的颜色数目  s: 散点的大小数目  alpha: 透明度
    x = np.random.normal(0, 1, 1000)
    y = np.random.normal(0, 1, 1000)
    c = np.random.rand(1000)
    s = np.random.rand(100)*100   # 100种大小
    plt.scatter(x, y, c=c, s=s, alpha=0.5)
    plt.grid(True)
    plt.show()
十三: 显示多个图表
方法一:
def test13():
    # 显示多个图表
    names = ['Anime', 'Comic', 'Game']
    values = [30, 10, 20]
    plt.subplot(221)   # 构建2X2张图中的第一张子图
    plt.bar(names, values)    # 统计图
    plt.subplot(222)
    plt.scatter(names, values)
    plt.subplot(223)
    plt.plot(names, values)
    plt.suptitle("三种图显示", fontname="SimHei")
    plt.show()
方法二:
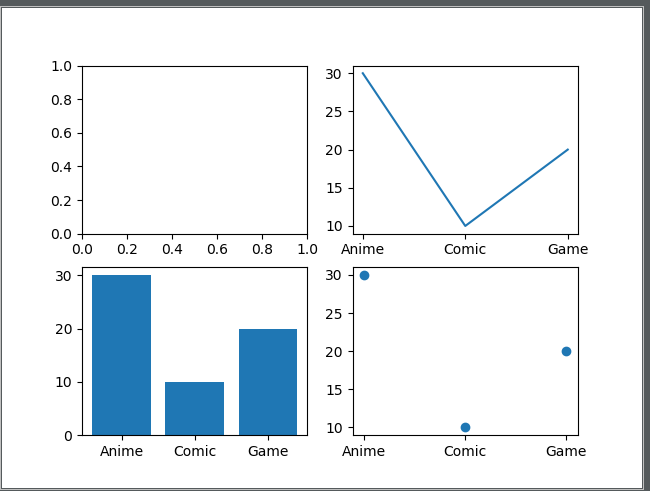
def test14():
    # 上述是每次构造一个子图,然后在子图中绘制.也可以先构造所有的子图,再通过下标指定在哪张子图中绘制
    fig, axes = plt.subplots(2, 2)
    names = ['Anime', 'Comic', 'Game']
    values = [30, 10, 20]
    axes[0, 1].plot(names, values)
    axes[1, 0].bar(names, values)
    axes[1, 1].scatter(names, values)
    plt.show()
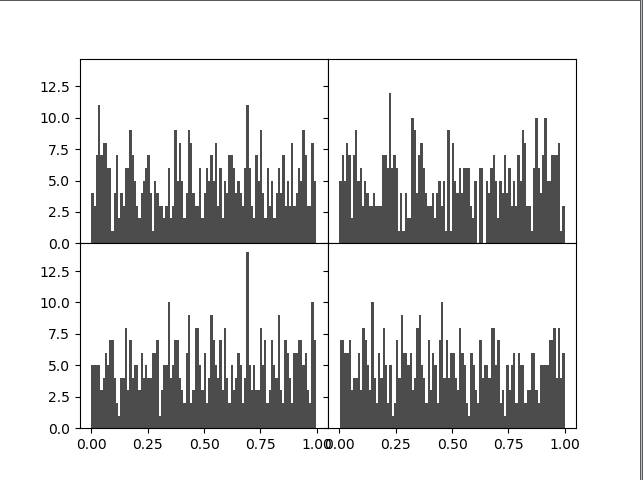
十四:子图间距的调整
def test15():
    # 调整子图间隔
    # #构造2x2的子图,子图共享x,y轴
    fig, axes = plt.subplots(2, 2, sharex=True, sharey=True)
    for i in range(2):
        for j in range(2):
            axes[i, j].hist(np.random.rand(500), bins=100, alpha=0.7, color="k")
    plt.subplots_adjust(hspace=0, wspace=0)  # 修改内部的宽,高间距为0
    plt.show()
十五: 绘制柱状图
垂直柱状图plt.bar(names,values)
水平柱状图plt.barh(names,values)
def test16():
    # 垂直柱状图 plt.bar(name, values)
    # 水平柱状图 plt.barh(name, values)
    x = np.random.randint(1, 10, 8)
    label = list("abcdefgh")
    plt.subplot(221)
    plt.bar(label, x)
    plt.subplot(222)
    plt.barh(label, x)
    plt.show()

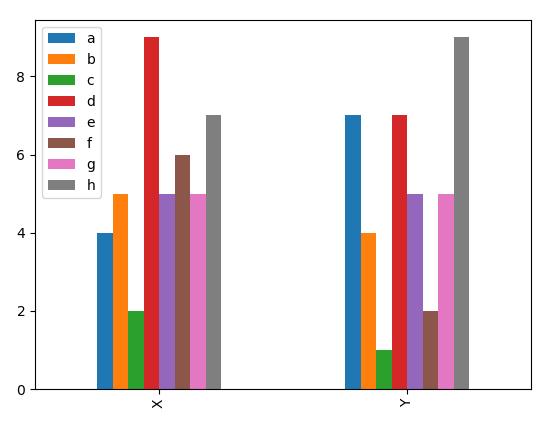
pd.DataFrame.plot.bar()绘制柱形图
import pandas as pd
def test17():
    x = np.random.randint(1, 10, 8)
    y = np.random.randint(1, 10, 8)
    # index为分类, columns为数据的柱状图
    data = pd.DataFrame([x, y], index=["X", "Y"], columns=list("abcdefgh"))
    # data.plot.bar()
    data.transpose().plot.bar()  # data.transpose()转置
    plt.show()
