
Pyqt5——带图标的表格(Model/View)
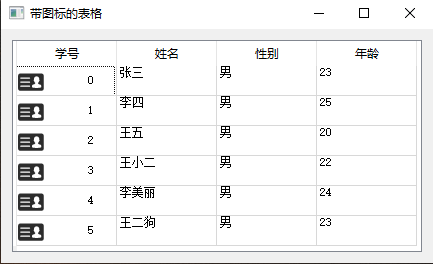
需求:表格中第一列内容为学生学号,为了突出学号的表示,在第一列的学号旁增加学号图标。
实现:(1)使用Qt的model-view模式生成表格视图。
(2)重写代理(QAbstractItemDelegate)。
表格样式如下图所示。
代码块。
Model部分:
class MyTableModel(QAbstractTableModel):
    """Model"""
    def __init__(self):
        super(MyTableModel, self).__init__()
        self._data = []
        self._background_color = []
        self._headers = ['学号', '姓名', '性别', '年龄']

        self._generate_data()

    def _generate_data(self):
        """填充表格数据"""
        name_list = ['张三', '李四', '王五', '王小二', '李美丽', '王二狗']

        for id_num, name in enumerate(name_list):
            self._data.append([str(id_num), name, '男', str(random.randint(20, 25))])

            # :默认单元格颜色为白色
            self._background_color.append([QColor(255, 255, 255) for i in range(4)])

    def rowCount(self, parent=QModelIndex()):
        """返回行数量。"""
        return len(self._data)

    def columnCount(self, parent=QModelIndex()):
        """返回列数量。"""
        return len(self._headers)

    def headerData(self, section, orientation, role):
        """设置表格头"""
        if role == Qt.DisplayRole and orientation == Qt.Horizontal:
            return self._headers[section]

    def data(self, index, role):
        """显示表格中的数据。"""
        if not index.isValid() or not 0 <= index.row() < self.rowCount():
            return QVariant()

        row = index.row()
        col = index.column()

        if role == Qt.DisplayRole:
            return self._data[row][col]
        elif role == Qt.BackgroundColorRole:
            return self._background_color[row][col]
        elif role == Qt.TextAlignmentRole:
            return Qt.AlignCenter

        return QVariant()
Delegate部分:
class MyDelegate(QAbstractItemDelegate):
    """Delegate"""
    def __init__(self):
        super(MyDelegate, self).__init__()

    def paint(self, painter, option, index):
        """绘制单元格。"""
        if index.column() == 0:
            # :表格第一列是ID,单元格中绘制一个图片和ID。
            p = QStyleOptionViewItem()
            p.index = index
            p.rect = option.rect
            p.features = QStyleOptionViewItem.HasDecoration | QStyleOptionViewItem.HasDisplay
            p.text = str(index.data())
            p.decorationSize = QSize(44, 44)      # 设置装饰图标的大小。
            p.icon = QIcon('../image/id.png')     # 设置装饰图标路径名
            p.state = option.state
            p.showDecorationSelected = True     # 开启选中时,单元格高亮显示
            # :若项目被选择,则高亮绘制其矩形
            #if p.state & QStyle.State_Selected:
                #painter.fillRect(option.rect, option.palette.highlight())

            p.decorationPosition = QStyleOptionViewItem.Left        # 图片在文字的左边
            p.displayAlignment = Qt.AlignLeft | Qt.AlignCenter      # 设置文字的位置
            QApplication.style().drawControl(QStyle.CE_ItemViewItem, p, painter)
        else:
            # :向表格中渲染数据,如果缺少下面代码,表格中数据不能正常显示。
            # :这里应该在model的data函数之后调用,此时通过index可以获取要显示。
            # :的数据。
            p = QStyleOptionViewItem()
            p.features = QStyleOptionViewItem.HasDisplay
            p.index = index                     # 表格QModelIndex索引
            p.rect = option.rect
            p.state = option.state

            p.showDecorationSelected = True     # 开启选中时,单元格高亮显示
            p.text = str(index.data())          # 表格中的数据
            QApplication.style().drawControl(QStyle.CE_ItemViewItem, p, painter)
完整代码查看:https://gitee.com/cui_zhen/pyqt5-example.git
