几个性能测试工具
我个人认为一个优秀的软件工程师必须掌握一定的测试技能。可能有的开发工程师认为测试是测试工程师的事情,不是开发工程师的事情。这种开发工程师是缺一条腿的,离开了测试工程师,你如何证明你的程序没有问题。
下面是我这两天搜集的性能测试工具,如果大家知道别的工具,可以在回复中分享出来。
Web Bench
Web Bench is very simple tool for benchmarking WWW or proxy servers. Uses fork() for simulating multiple clients and can use HTTP/0.9-HTTP/1.1 requests. This benchmark is not very realistic, but it can test if your HTTPD can realy handle that many clients at once (try to run some CGIs) without taking your machine down. Displays pages/min and bytes/sec. Can be used in more aggressive mode with -f switch.
Web Bench是一个简单的web或者web代理服务的基准测试工具。(它)使用fork()模拟多个客户端并且可以发起HTTP/0/9-HTTP/1.1 的请求。这个基准测试不是非常符合实际情况,但是可以测试出你的HTTP服务是否可以处理多个客户同时访问而不会把你的机器弄挂掉。这个工具可以获得服务 的两个指标:每分钟响应请求数量(pages/min)和每秒钟传输数据量(bytes/sec)。使用-f选项可以运行在主动模式下(不等待服务器响应直接发送下一个请求)。
安装方法参考:(总结)Web性能压力测试工具之WebBench详解
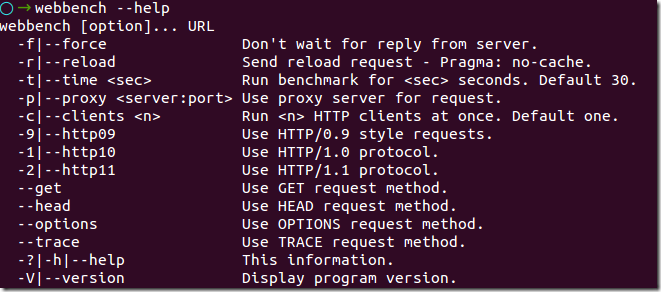
命令参数:
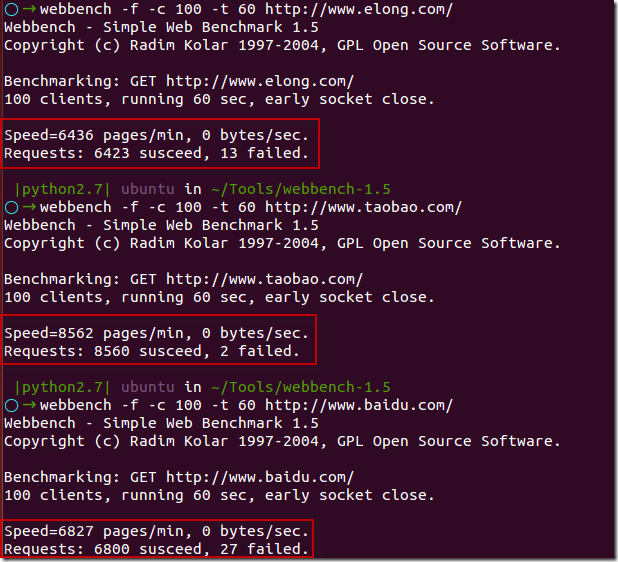
使用webbench测试elong,taobao,baidu的结果(可能受电脑性能、网络的因素影响):
ab - Apache HTTP server benchmarking tool
ab is a tool for benchmarking your Apache Hypertext Transfer Protocol (HTTP) server. It is designed to give you an impression of how your current Apache installation performs. This especially shows you how many requests per second your Apache installation is capable of serving.
ab 命令会创建很多的并发访问线程,模拟多个访问者同时对某一URL地址进行访问。它的测试目标是基于URL的,因此,既可以用来测试Apache的负载压 力,也可以测试nginx、lighthttp、tomcat、IIS等其它Web服务器的压力。ab命令对发出负载的计算机要求很低,既不会占用很高 CPU,也不会占用很多内存,但却会给目标服务器造成巨大的负载,其原理类似CC攻击。自己测试使用也须注意,否则一次上太多的负载,可能造成目标服务器因资源耗完,严重时甚至导致死机。
网上有些文章说安装apache2后一般情况下在Apache的bin目录下。我在Ubunut 14.04上测试,并不是这样。要在Ubuntu上使用ab,需要apache2-utils。
ab的用法参考:ab - Apache HTTP server benchmarking tool,(总结)Web性能压力测试工具之ApacheBench(ab)详解
Siege
Siege is an http load testing and benchmarking utility. It was designed to let web developers measure their code under duress, to see how it will stand up to load on the internet. Siege supports basic authentication, cookies, HTTP and HTTPS protocols. It lets its user hit a web server with a configurable number of simulated web browsers. Those browsers place the server “under siege.”
Siege(英 文意思是围攻)是一个压力测试和评测工具,设计用于WEB开发这评估应用在压力下的承受能力:可以根据配置对一个WEB站点进行多用户的并发访问,记录每 个用户所有请求过程的相应时间,并在一定数量的并发访问下重复进行。 Siege 支持基本的认证,cookies, HTTP 和 HTTPS 协议。
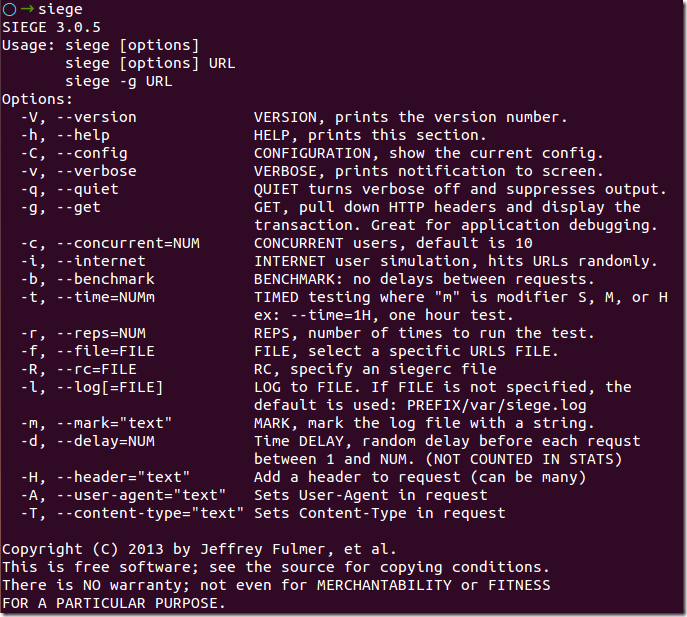
Siege的安装和用法可以参考:Siege Manual,Using Siege to Tune Apache on GNU/Linux,(总结)Web性能压力测试工具之Siege详解,压力测试工具siege的用法
我的Ubuntu 14.04上的使用如下:
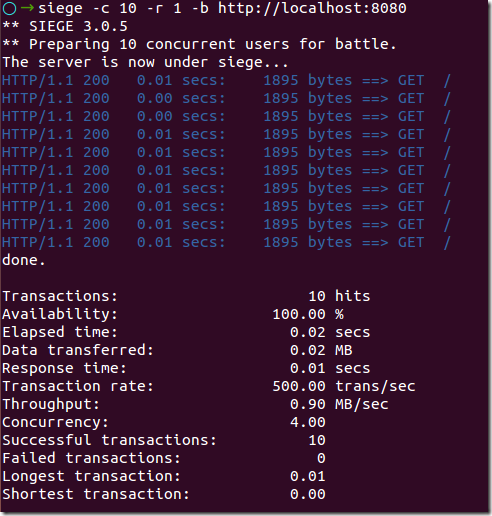
测试本地的tomcat的测试结果:
Apache JMeter
Apache JMeter是一个专门为运行和服务器装载测试而设计的、100%的纯Java桌面运行程序。原先它是为Web/HTTP测试而设计的,但是它已经扩展以 支持各种各样的测试模块。它和用于HTTP和SQL数据库(使用JDBC)的模块一起运送。它可以用来测试静止资料库或者活动资料库中的服务器的运行情 况,可以用来模拟对服务器或者网络系统加以重负荷以测试它的抵抗力,或者用来分析不同负荷类型下的所有运行情况。它也提供了一个可替换的界面用来定制数据 显示,测试同步及测试的创建和执行。
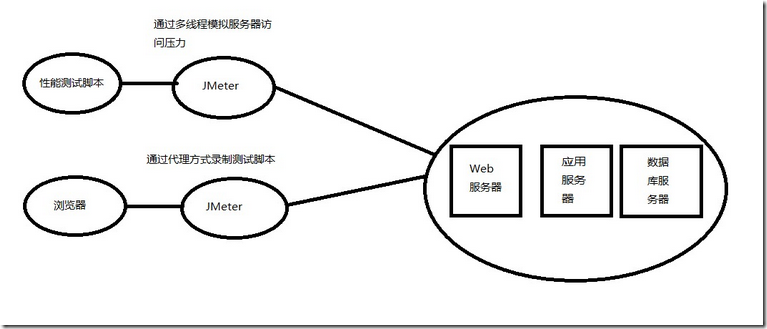
JMeter的工作原理:JMeter可以作为Web服务器与浏览器之间的代理网关,以便捕获浏览器 的请求和Web服务器的响应,这样就很容易地生成性能测试脚本,有了性能测试脚本,JMeter就可以通过线程组来模拟真实用户对Web服务器的访问压 力,这与LoadRunner的工作原理基本一致。
下面是JMeter的官方简介:
The Apache JMeter™ desktop application is open source software, a 100% pure Java application designed to load test functional behavior and measure performance. It was originally designed for testing Web Applications but has since expanded to other test functions.
What can I do with it?
Apache JMeter may be used to test performance both on static and dynamic resources (Files, Web dynamic languages - PHP, Java, ASP.NET, etc. -, Java Objects, Data Bases and Queries, FTP Servers and more). It can be used to simulate a heavy load on a server, group of servers, network or object to test its strength or to analyze overall performance under different load types. You can use it to make a graphical analysis of performance or to test your server/script/object behavior under heavy concurrent load.
What does it do?
Apache JMeter features include:
- Ability to load and performance test many different server/protocol types:
- Web - HTTP, HTTPS
- SOAP
- FTP
- Database via JDBC
- LDAP
- Message-oriented middleware (MOM) via JMS
- Mail - SMTP(S), POP3(S) and IMAP(S)
- MongoDB (NoSQL)
- Native commands or shell scripts
- TCP
- Complete portability and 100% Java purity .
- Full multithreading framework allows concurrent sampling by many threads and simultaneous sampling of different functions by separate thread groups.
- Careful GUI design allows faster Test Plan building and debugging.
- Caching and offline analysis/replaying of test results.
- Highly Extensible core:
- Pluggable Samplers allow unlimited testing capabilities.
- Several load statistics may be choosen with pluggable timers .
- Data analysis and visualization plugins allow great extensibility as well as personalization.
- Functions can be used to provide dynamic input to a test or provide data manipulation.
- Scriptable Samplers (BeanShell, BSF-compatible languages and JSR223-compatible languages)
JMeter的用户手册:http://jmeter.apache.org/usermanual/index.html
推荐一本书籍:《零成本实现Web性能测试》
JMeter的脚本录制工具:Badboy
Web Polygraph
Web Polygraph这个软件也是一个用于测试WEB性能的工具,这个工具是很多公司的标准测试工具,包括微软在分析其软件性能的时候,也是使用这个工具做为基准工具的。很多招聘测试员的广告中都注明需要熟练掌握这个测试工具。
Web Polygraph is a freely available performance testing tool for caching proxies, origin server accelerators, L4/7 switches, content filters, and other Web intermediaries. Polygraph's features include:
- high-performance HTTP clients and servers
- realistic HTTP, FTP and SSL traffic generation
- HTTP and SOCKS5 proxy support, with chaining
- HTTP Basic, NTLM, and Negotiate proxy authentication
- LDAP-friendly generation of user credentials
- flexible content simulation
- ready-to-use standard workloads for benchmarking
- powerful domain-specific configuration language
- portable open-source implementation
- friendly commercial support
TCPCopy
Although the real live flow is important for the test of Internet server applications, it is hard to simulate it as online environments are too complex. To support more realistic testing of Internet server applications, we propose a live flow reproduction tool – TCPCopy, which could generate the test workload that is similar to the production workload. TCPCopy consists of two components: the TCPCopy Client (tcpcopy) and the TCPCopy Server (intercept). The TCPCopy Client (tcpcopy) is deployed on the production system and it copies live flow data, does necessary modifications and sends them to the test system in real-time. The TCPCopy Server (intercept) is deployed on the test system and it returns necessary response information to the TCPCopy Client (tcpcopy). To the test server, the reproduced workload is just from end-users. Currently, TCPCopy has been widely used by companies in China.
TCPCopy has little influence on the production system except occupying additional CPU, memory and bandwidth. Moreover, the reproduced workload is similar to the production workload in request diversity, network latency and resource occupation.
Traditional architecture
Advanced architecture
Tsung
Tsung is an open-source multi-protocol distributed load testing tool
It can be used to stress HTTP, WebDAV, SOAP, PostgreSQL, MySQL, LDAP and Jabber/XMPP servers. Tsung is a free software released under the GPLv2license.
The purpose of Tsung is to simulate users in order to test the scalability and performance of IP based client/server applications. You can use it to do load and stress testing of your servers. Many protocols have been implemented and tested, and it can be easily extended.
It can be distributed on several client machines and is able to simulate hundreds of thousands of virtual users concurrently (or even millions if you have enough hardware ...).
Tsung is developed in Erlang, an open-source language made by Ericsson for building robust fault-tolerant distributed applications.
curl-loader
curl-loader (also known as "omes-nik" and "davilka") is an open-source tool written in C-language, simulating application load and application behavior of thousands and tens of thousand HTTP/HTTPS and FTP/FTPS clients, each with its own source IP-address. In contrast to other tools curl-loader is using real C-written client protocol stacks, namely, HTTP and FTP stacks of libcurl and TLS/SSL of openssl, and simulates user behavior with support for login and authentication flavors.
The goal of the project is to deliver a powerful and flexible open-source testing solution as a real alternative to Spirent Avalanche and IXIA IxLoad.
The tool is useful for performance loading of various application services, for testing web and ftp servers and traffic generation. Activities of each virtual client are logged and collected statistics includes information about resolving, connection establishment, sending of requests, receiving responses, headers and data received/sent, errors from network, TLS/SSL and application (HTTP, FTP) level events and errors.
Virtual clients are grouped together to the so-called batches of clients, performing the same sort of activities, like:
- authentication login;
- user activity simulation by fetching several URLs with configurable timeouts in between;
- logoff.
The tool can be easily extended to generate sftp, telnet, tftp, ldap, ssh, scp etc other application protocols, supported by the great libcurl library.
Grinder
Grinder 是一个开源的JVM负载测试框架,它通过很多负载注射器来为分布式测试提供了便利。 支持用于执行测试脚本的Jython脚本引擎HTTP测试可通过HTTP代理进行管理。根据项目网站的说法,Grinder的 主要目标用户是“理解他们所测代码的人——Grinder不仅仅是带有一组相关响应时间的‘黑盒’测试。由于测试过程可以进行编码——而不是简单地脚本 化,所以程序员能测试应用中内部的各个层次,而不仅仅是通过用户界面测试响应时间。
LoadRunner(商业软件)
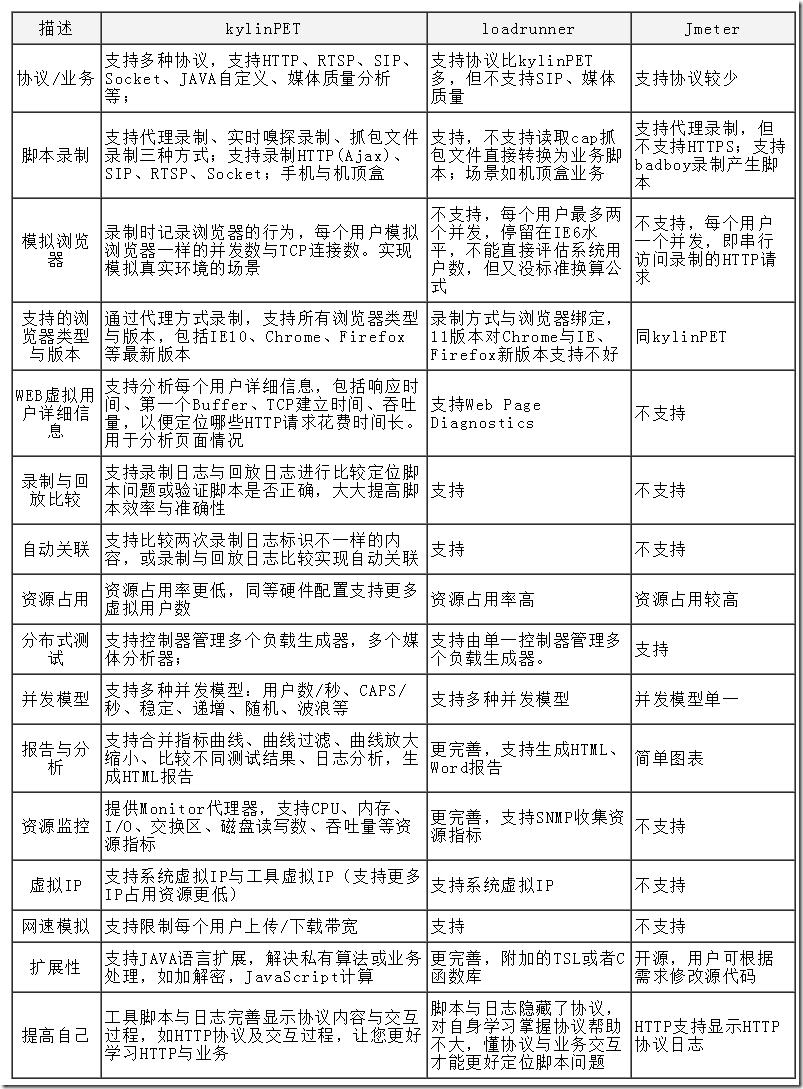
LoadRunner 是一种预测系统行为和性能的工业标准级负载测试工具。通过以模拟上千万用户实施并发负载及实时性能监测的方式来确认和查找问题,LoadRunner 能够对整个企业架构进行测试。通过使用LoadRunner , 企业能最大限度地缩短测试时间, 优化性能和加速应用系统的发布周期。企业的网络应用环境都必须支持大量用户,网络体系架构中含各类应用环境且由不同供应商提供软件和硬件产品。难以预知的 用户负载和愈来愈复杂的应用环境使公司时时担心会发生用户响应速度过慢, 系统崩溃等问题。这些都不可避免地导致公司收益的损失。Mercury Interactive 的 LoadRunner 能让企业保护自己的收入来源, 无需购置额外硬件而最大限度地利用现有的IT 资源, 并确保终端用户在应用系统的各个环节中对其测试应用的质量, 可靠性和可扩展性都有良好的评价。LoadRunner 是一种适用于各种体系架构的自动负载测试工具, 它能预测系统行为并优化系统性能。LoadRunner 的测试对象是整个企业的系统, 它通过模拟实际用户的操作行为和实行实时性能监测, 来帮助您更快的查找和发现问题。此外,LoadRunner 能支持广范的协议和技术, 为您的特殊环境提供特殊的解决方案。kylinpet(国产商业工具)
kylinPET(performance emulation tool,麒麟宠物)是一款功能强大的性能测试工具;界面友好、操作方便,资源占用率低;自带TCP/IP协议栈,支持虚拟大量IP;支持IPv4、 IPv6的多种业务测试;支持WEB/WebService业务与Flex(HTTP)、IMS业务(SIP)、IPTV业务(RTSP/IGMP /MLD)、XMPP、Socket业务、数据库、JMS、FTP/SFTP、WEB视频(包括FLV/MP4/HTTP Live Streaming/HTTP Smooth Streaming/HTTP Dynamic Streaming)、WebSocket、JAVA;支持多种协议组合。
总结一些性能测试的做法
- 为了减少网络延迟和带宽限制对性能测试的影响,最好在内网进行测试。
- 性能测试一般在优化前和优化后,测试两轮,这样能够比较出优化前后的效果。
- 性能测试最好跑的时间长一些,观察程序是否存在内存泄漏、资源未释放等问题。
- 有的公司为了避免影响线上环境,只在测试环境做性能测试。我所在的公司性能测试一般在线下线上都会做,线上做性能测试可以了解生产环境的性能情况。


