部署 kubernetes+harbor+KubeSphere
部署 kubernetes+harbor+KubeSphere,kubesphere拥有更丰富的功能,比dashboard功能齐全,可以快速加入节点,快速部署pod。
安装KubeSphere前置环境
1、nfs文件系统
1、安装nfs-server
# 在每个机器。
yum install -y nfs-utils


# 在master 执行以下命令
echo "/nfs/data/ *(insecure,rw,sync,no_root_squash)" > /etc/exports


# 执行以下命令,启动 nfs 服务;创建共享目录
mkdir -p /nfs/data


# 在master执行
systemctl enable rpcbind
systemctl enable nfs-server
systemctl start rpcbind
systemctl start nfs-server

# 使配置生效
exportfs -r


#检查配置是否生效
exportfs

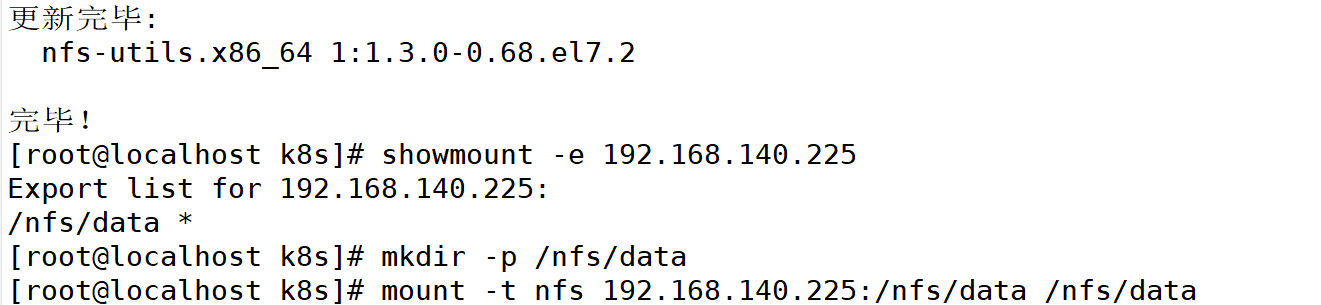
2、配置nfs-client(选做)
showmount -e 172.31.0.4

mkdir -p /nfs/data

mount -t nfs 172.31.0.4:/nfs/data /nfs/data

3、配置默认存储
## 创建了一个存储类
apiVersion: storage.k8s.io/v1
kind: StorageClass                  #存储类的资源名称
metadata:
  name: nfs-storage                 #存储类的名称,自定义
  annotations:
    storageclass.kubernetes.io/is-default-class: "true"          #注解,是否是默认的存储,注意:KubeSphere默认就需要个默认存储,因此这里注解要设置为“默认”的存储系统,表示为"true",代表默认。
provisioner: k8s-sigs.io/nfs-subdir-external-provisioner         #存储分配器的名字,自定义
parameters:
  archiveOnDelete: "true"  ## 删除pv的时候,pv的内容是否要备份

---
apiVersion: apps/v1
kind: Deployment
metadata:
  name: nfs-client-provisioner
  labels:
    app: nfs-client-provisioner
  # replace with namespace where provisioner is deployed
  namespace: default
spec:
  replicas: 1                 #只运行一个副本应用
  strategy:                   #描述了如何用新的POD替换现有的POD
    type: Recreate            #Recreate表示重新创建Pod
  selector:        #选择后端Pod
    matchLabels:
      app: nfs-client-provisioner
  template:
    metadata:
      labels:
        app: nfs-client-provisioner
    spec:
      serviceAccountName: nfs-client-provisioner          #创建账户
      containers:
        - name: nfs-client-provisioner
          image: registry.cn-hangzhou.aliyuncs.com/lfy_k8s_images/nfs-subdir-external-provisioner:v4.0.2      #使用NFS存储分配器的镜像
          # resources:
          #    limits:
          #      cpu: 10m
          #    requests:
          #      cpu: 10m
          volumeMounts:
            - name: nfs-client-root           #定义个存储卷,
              mountPath: /persistentvolumes   #表示挂载容器内部的路径
          env:
            - name: PROVISIONER_NAME          #定义存储分配器的名称
              value: k8s-sigs.io/nfs-subdir-external-provisioner         #需要和上面定义的保持名称一致
            - name: NFS_SERVER                                       #指定NFS服务器的地址,你需要改成你的NFS服务器的IP地址
              value: 192.168.137.20 ## 指定自己nfs服务器地址
            - name: NFS_PATH
              value: /nfs/data  ## nfs服务器共享的目录            #指定NFS服务器共享的目录
      volumes:
        - name: nfs-client-root           #存储卷的名称,和前面定义的保持一致
          nfs:
            server: 192.168.137.20            #NFS服务器的地址,和上面保持一致,这里需要改为你的IP地址
            path: /nfs/data               #NFS共享的存储目录,和上面保持一致
---
apiVersion: v1
kind: ServiceAccount                 #创建个SA账号
metadata:
  name: nfs-client-provisioner        #和上面的SA账号保持一致
  # replace with namespace where provisioner is deployed
  namespace: default
---
#以下就是ClusterRole,ClusterRoleBinding,Role,RoleBinding都是权限绑定配置,不在解释。直接复制即可。
kind: ClusterRole
apiVersion: rbac.authorization.k8s.io/v1
metadata:
  name: nfs-client-provisioner-runner
rules:
  - apiGroups: [""]
    resources: ["nodes"]
    verbs: ["get", "list", "watch"]
  - apiGroups: [""]
    resources: ["persistentvolumes"]
    verbs: ["get", "list", "watch", "create", "delete"]
  - apiGroups: [""]
    resources: ["persistentvolumeclaims"]
    verbs: ["get", "list", "watch", "update"]
  - apiGroups: ["storage.k8s.io"]
    resources: ["storageclasses"]
    verbs: ["get", "list", "watch"]
  - apiGroups: [""]
    resources: ["events"]
    verbs: ["create", "update", "patch"]
---
kind: ClusterRoleBinding
apiVersion: rbac.authorization.k8s.io/v1
metadata:
  name: run-nfs-client-provisioner
subjects:
  - kind: ServiceAccount
    name: nfs-client-provisioner
    # replace with namespace where provisioner is deployed
    namespace: default
roleRef:
  kind: ClusterRole
  name: nfs-client-provisioner-runner
  apiGroup: rbac.authorization.k8s.io
---
kind: Role
apiVersion: rbac.authorization.k8s.io/v1
metadata:
  name: leader-locking-nfs-client-provisioner
  # replace with namespace where provisioner is deployed
  namespace: default
rules:
  - apiGroups: [""]
    resources: ["endpoints"]
    verbs: ["get", "list", "watch", "create", "update", "patch"]
---
kind: RoleBinding
apiVersion: rbac.authorization.k8s.io/v1
metadata:
  name: leader-locking-nfs-client-provisioner
  # replace with namespace where provisioner is deployed
  namespace: default
subjects:
  - kind: ServiceAccount
    name: nfs-client-provisioner
    # replace with namespace where provisioner is deployed
    namespace: default
roleRef:
  kind: Role
  name: leader-locking-nfs-client-provisioner
  apiGroup: rbac.authorization.k8s.io
4.创建PVC
[root@master ~]# vim pvc.yaml
kind: PersistentVolumeClaim         #创建PVC资源
apiVersion: v1
metadata:
  name: nginx-pvc         #PVC的名称
spec:
  accessModes:            #定义对PV的访问模式,代表PV可以被多个PVC以读写模式挂载
    - ReadWriteMany
  resources:              #定义PVC资源的参数
    requests:             #设置具体资源需求
      storage: 200Mi      #表示申请200MI的空间资源
  storageClassName: nfs-storage          #指定存储类的名称,就指定上面创建的那个存储类。
5.安装Metrics-Server
[root@master ~]# vim /etc/kubernetes/manifests/kube-apiserver.yaml
apiVersion: v1
kind: Pod
metadata:
  annotations:
    kubeadm.kubernetes.io/kube-apiserver.advertise-address.endpoint: 192.168.137.20:6443
  creationTimestamp: null
  labels:
    component: kube-apiserver
    tier: control-plane
  name: kube-apiserver
  namespace: kube-system
spec:
  containers:
  - command:
    - kube-apiserver
    - --advertise-address=192.168.137.20
    - --allow-privileged=true
    - --authorization-mode=Node,RBAC
    - --client-ca-file=/etc/kubernetes/pki/ca.crt
    - --enable-admission-plugins=NodeRestriction
    - --enable-bootstrap-token-auth=true
    - --enable-aggregator-routing=true         #添加此行,开启Aggregator Routing(聚合路由)
    - --etcd-cafile=/etc/kubernetes/pki/etcd/ca.crt
    ...
systemctl daemon-reload
systemctl restart kubelet
6.安装所需的Yaml文件
vim components.yaml
apiVersion: v1
kind: ServiceAccount
metadata:
  labels:
    k8s-app: metrics-server
  name: metrics-server
  namespace: kube-system
---
apiVersion: rbac.authorization.k8s.io/v1
kind: ClusterRole
metadata:
  labels:
    k8s-app: metrics-server
    rbac.authorization.k8s.io/aggregate-to-admin: "true"
    rbac.authorization.k8s.io/aggregate-to-edit: "true"
    rbac.authorization.k8s.io/aggregate-to-view: "true"
  name: system:aggregated-metrics-reader
rules:
- apiGroups:
  - metrics.k8s.io
  resources:
  - pods
  - nodes
  verbs:
  - get
  - list
  - watch
---
apiVersion: rbac.authorization.k8s.io/v1
kind: ClusterRole
metadata:
  labels:
    k8s-app: metrics-server
  name: system:metrics-server
rules:
- apiGroups:
  - ""
  resources:
  - pods
  - nodes
  - nodes/stats
  - namespaces
  - configmaps
  verbs:
  - get
  - list
  - watch
---
apiVersion: rbac.authorization.k8s.io/v1
kind: RoleBinding
metadata:
  labels:
    k8s-app: metrics-server
  name: metrics-server-auth-reader
  namespace: kube-system
roleRef:
  apiGroup: rbac.authorization.k8s.io
  kind: Role
  name: extension-apiserver-authentication-reader
subjects:
- kind: ServiceAccount
  name: metrics-server
  namespace: kube-system
---
apiVersion: rbac.authorization.k8s.io/v1
kind: ClusterRoleBinding
metadata:
  labels:
    k8s-app: metrics-server
  name: metrics-server:system:auth-delegator
roleRef:
  apiGroup: rbac.authorization.k8s.io
  kind: ClusterRole
  name: system:auth-delegator
subjects:
- kind: ServiceAccount
  name: metrics-server
  namespace: kube-system
---
apiVersion: rbac.authorization.k8s.io/v1
kind: ClusterRoleBinding
metadata:
  labels:
    k8s-app: metrics-server
  name: system:metrics-server
roleRef:
  apiGroup: rbac.authorization.k8s.io
  kind: ClusterRole
  name: system:metrics-server
subjects:
- kind: ServiceAccount
  name: metrics-server
  namespace: kube-system
---
apiVersion: v1
kind: Service
metadata:
  labels:
    k8s-app: metrics-server
  name: metrics-server
  namespace: kube-system
spec:
  ports:
  - name: https
    port: 443
    protocol: TCP
    targetPort: https
  selector:
    k8s-app: metrics-server
---
apiVersion: apps/v1
kind: Deployment
metadata:
  labels:
    k8s-app: metrics-server
  name: metrics-server
  namespace: kube-system
spec:
  selector:
    matchLabels:
      k8s-app: metrics-server
  strategy:
    rollingUpdate:
      maxUnavailable: 0
  template:
    metadata:
      labels:
        k8s-app: metrics-server
    spec:
      containers:
      - args:
        - --cert-dir=/tmp
        - --secure-port=4443
        - --kubelet-preferred-address-types=InternalIP       #删掉 ExternalIP,Hostname这两个,这里已经改好了
        - --kubelet-use-node-status-port
        - --kubelet-insecure-tls                             #加上该启动参数
        image: registry.cn-hangzhou.aliyuncs.com/google_containers/metrics-server:v0.4.1
        imagePullPolicy: IfNotPresent
        livenessProbe:
          failureThreshold: 3
          httpGet:
            path: /livez
            port: https
            scheme: HTTPS
          periodSeconds: 10
        name: metrics-server
        ports:
        - containerPort: 4443
          name: https
          protocol: TCP
        readinessProbe:
          failureThreshold: 3
          httpGet:
            path: /readyz
            port: https
            scheme: HTTPS
          periodSeconds: 10
        securityContext:
          readOnlyRootFilesystem: true
          runAsNonRoot: true
          runAsUser: 1000
        volumeMounts:
        - mountPath: /tmp
          name: tmp-dir
      nodeSelector:
        kubernetes.io/os: linux
      priorityClassName: system-cluster-critical
      serviceAccountName: metrics-server
      volumes:
      - emptyDir: {}
        name: tmp-dir
---
apiVersion: apiregistration.k8s.io/v1
kind: APIService
metadata:
  labels:
    k8s-app: metrics-server
  name: v1beta1.metrics.k8s.io
spec:
  group: metrics.k8s.io
  groupPriorityMinimum: 100
  insecureSkipTLSVerify: true
  service:
    name: metrics-server
    namespace: kube-system
  version: v1beta1
  versionPriority: 100
7.拉取镜像
docker pull registry.cn-hangzhou.aliyuncs.com/google_containers/metrics-server:v0.4.1
8.安装
kubectl apply -f components.yaml
9.安装KubeSphere
wget https://github.com/kubesphere/ks-installer/releases/download/v3.1.1/kubesphere-installer.yaml
wget https://github.com/kubesphere/ks-installer/releases/download/v3.1.1/cluster-configuration.yaml
vim cluster-configuration.yaml
[root@master ~]# cat cluster-configuration.yaml
---
apiVersion: installer.kubesphere.io/v1alpha1
kind: ClusterConfiguration
metadata:
  name: ks-installer
  namespace: kubesphere-system
  labels:
    version: v3.1.1
spec:
  persistence:
    storageClass: ""        #这里保持默认即可,因为偶们有了默认的存储类
  authentication:
    jwtSecret: ""           # Keep the jwtSecret consistent with the Host Cluster. Retrieve the jwtSecret by executing "kubectl -n kubesphere-system get cm kubesphere-config -o yaml | grep -v "apiVersion" | grep jwtSecret" on the Host Cluster.
  local_registry: ""        # Add your private registry address if it is needed.
  etcd:
    monitoring: true       # 改为"true",表示开启etcd的监控功能
    endpointIps: 192.168.137.20  # 改为自己的master节点IP地址
    port: 2379              # etcd port.
    tlsEnable: true
  common:
    redis:
      enabled: true         #改为"true",开启redis功能
    openldap:
      enabled: true         #改为"true",开启轻量级目录协议
    minioVolumeSize: 20Gi # Minio PVC size.
    openldapVolumeSize: 2Gi   # openldap PVC size.
    redisVolumSize: 2Gi # Redis PVC size.
    monitoring:
      # type: external   # Whether to specify the external prometheus stack, and need to modify the endpoint at the next line.
      endpoint: http://prometheus-operated.kubesphere-monitoring-system.svc:9090 # Prometheus endpoint to get metrics data.
    es:   # Storage backend for logging, events and auditing.
      # elasticsearchMasterReplicas: 1   # The total number of master nodes. Even numbers are not allowed.
      # elasticsearchDataReplicas: 1     # The total number of data nodes.
      elasticsearchMasterVolumeSize: 4Gi   # The volume size of Elasticsearch master nodes.
      elasticsearchDataVolumeSize: 20Gi    # The volume size of Elasticsearch data nodes.
      logMaxAge: 7                     # Log retention time in built-in Elasticsearch. It is 7 days by default.
      elkPrefix: logstash              # The string making up index names. The index name will be formatted as ks-<elk_prefix>-log.
      basicAuth:
        enabled: false          #此处的"false"不用改为"true",这个标识在开启监控功能之后是否要连接ElasticSearch的账户和密码,此处不用
        username: ""
        password: ""
      externalElasticsearchUrl: ""
      externalElasticsearchPort: ""
  console:
    enableMultiLogin: true  # Enable or disable simultaneous logins. It allows different users to log in with the same account at the same time.
    port: 30880
  alerting:                # (CPU: 0.1 Core, Memory: 100 MiB) It enables users to customize alerting policies to send messages to receivers in time with different time intervals and alerting levels to choose from.
    enabled: true         # 改为"true",开启告警功能
    # thanosruler:
    #   replicas: 1
    #   resources: {}
  auditing:
    enabled: true         #  改为"true",开启审计功能
  devops:                  # (CPU: 0.47 Core, Memory: 8.6 G) Provide an out-of-the-box CI/CD system based on Jenkins, and automated workflow tools including Source-to-Image & Binary-to-Image.
    enabled: true             # 改为"true",开启DevOps功能
    jenkinsMemoryLim: 2Gi      # Jenkins memory limit.
    jenkinsMemoryReq: 1500Mi   # Jenkins memory request.
    jenkinsVolumeSize: 8Gi     # Jenkins volume size.
    jenkinsJavaOpts_Xms: 512m  # The following three fields are JVM parameters.
    jenkinsJavaOpts_Xmx: 512m
    jenkinsJavaOpts_MaxRAM: 2g
  events:                  # Provide a graphical web console for Kubernetes Events exporting, filtering and alerting in multi-tenant Kubernetes clusters.
    enabled: true         # 改为"true",开启集群的事件功能
    ruler:
      enabled: true
      replicas: 2
  logging:                 # (CPU: 57 m, Memory: 2.76 G) Flexible logging functions are provided for log query, collection and management in a unified console. Additional log collectors can be added, such as Elasticsearch, Kafka and Fluentd.
    enabled: true        # 改为"true",开启日志功能
    logsidecar:
      enabled: true
      replicas: 2
  metrics_server:                    # (CPU: 56 m, Memory: 44.35 MiB) It enables HPA (Horizontal Pod Autoscaler).
    enabled: false                   # 这个不用修改,因为在上卖弄我们已经安装过了,如果这里开启,镜像是官方的,会拉取镜像失败
  monitoring:
    storageClass: ""
    # prometheusReplicas: 1          # Prometheus replicas are responsible for monitoring different segments of data source and providing high availability.
    prometheusMemoryRequest: 400Mi   # Prometheus request memory.
    prometheusVolumeSize: 20Gi       # Prometheus PVC size.
    # alertmanagerReplicas: 1          # AlertManager Replicas.
  multicluster:
    clusterRole: none  # host | member | none  # You can install a solo cluster, or specify it as the Host or Member Cluster.
  network:
    networkpolicy: # Network policies allow network isolation within the same cluster, which means firewalls can be set up between certain instances (Pods).
      # Make sure that the CNI network plugin used by the cluster supports NetworkPolicy. There are a number of CNI network plugins that support NetworkPolicy, including Calico, Cilium, Kube-router, Romana and Weave Net.
      enabled: true # 改为"true",开启网络策略
    ippool: # Use Pod IP Pools to manage the Pod network address space. Pods to be created can be assigned IP addresses from a Pod IP Pool.
      type: none #如果你的网络插件是calico,需要修改为"calico",这里我是Flannel,保持默认。
    topology: # Use Service Topology to view Service-to-Service communication based on Weave Scope.
      type: none # Specify "weave-scope" for this field to enable Service Topology. "none" means that Service Topology is disabled.
  openpitrix: # An App Store that is accessible to all platform tenants. You can use it to manage apps across their entire lifecycle.
    store:
      enabled: true # 改为"true",开启应用商店
  servicemesh:         # (0.3 Core, 300 MiB) Provide fine-grained traffic management, observability and tracing, and visualized traffic topology.
    enabled: true     # 改为"true",开启微服务治理
  kubeedge:          # Add edge nodes to your cluster and deploy workloads on edge nodes.
    enabled: false   # 这个就不修改了,这个是边缘服务,我们也没有边缘的设备。
    cloudCore:
      nodeSelector: {"node-role.kubernetes.io/worker": ""}
      tolerations: []
      cloudhubPort: "10000"
      cloudhubQuicPort: "10001"
      cloudhubHttpsPort: "10002"
      cloudstreamPort: "10003"
      tunnelPort: "10004"
      cloudHub:
        advertiseAddress: # At least a public IP address or an IP address which can be accessed by edge nodes must be provided.
          - ""            # Note that once KubeEdge is enabled, CloudCore will malfunction if the address is not provided.
        nodeLimit: "100"
      service:
        cloudhubNodePort: "30000"
        cloudhubQuicNodePort: "30001"
        cloudhubHttpsNodePort: "30002"
        cloudstreamNodePort: "30003"
        tunnelNodePort: "30004"
    edgeWatcher:
      nodeSelector: {"node-role.kubernetes.io/worker": ""}
      tolerations: []
      edgeWatcherAgent:
        nodeSelector: {"node-role.kubernetes.io/worker": ""}
        tolerations: []
10.安装kubesphere并配置kubesphere(注意运行顺序)
kubectl apply -f kubesphere-installer.yaml
kubectl apply -f cluster-configuration.yaml
11.检查安装日志
[root@k8s-master ~]# kubectl logs -n kubesphere-system $(kubectl get pod -n kubesphere-system -l app=ks-install -o jsonpath='{.items[0].metadata.name}') -f

#显示结果:
PLAY RECAP *********************************************************************
localhost                  : ok=31   changed=25   unreachable=0    failed=0    skipped=15   rescued=0    ignored=0

#注意查看failed=0,失败=0即可。
#下面就等待估计20min
Start installing monitoring
Start installing multicluster
Start installing openpitrix
Start installing network
Start installing alerting
Start installing auditing
Start installing devops
Start installing events
Start installing kubeedge
Start installing logging
Start installing servicemesh
**************************************************
Waiting for all tasks to be completed ...
task multicluster status is successful  (1/11)
task network status is successful  (2/11)
task alerting status is successful  (3/11)
task openpitrix status is successful  (4/11)
task auditing status is successful  (5/11)
task logging status is successful  (6/11)
task events status is successful  (7/11)
task kubeedge status is successful  (8/11)
task devops status is successful  (9/11)
task monitoring status is successful  (10/11)
task servicemesh status is successful  (11/11)
**************************************************
Collecting installation results ...
#####################################################
###              Welcome to KubeSphere!           ###
#####################################################

Console: http://192.168.0.206:30880
Account: admin
Password: P@88w0rd

NOTES:
  1. After you log into the console, please check the
     monitoring status of service components in
     "Cluster Management". If any service is not
     ready, please wait patiently until all components
     are up and running.
  2. Please change the default password after login.

#####################################################
https://kubesphere.io             2022-04-08 17:14:52
#####################################################
#出现如上信息表示安装KubeSphere行
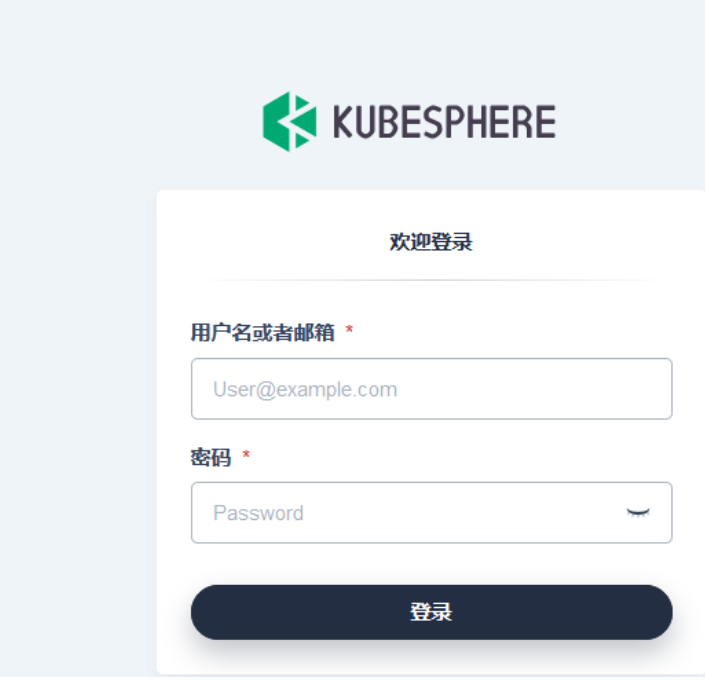
12访问KubeSphere
用户:admin
初始密码:P@88w0rd

 浙公网安备 33010602011771号