Python_Plotly_添加按钮,下拉菜单,滑动条
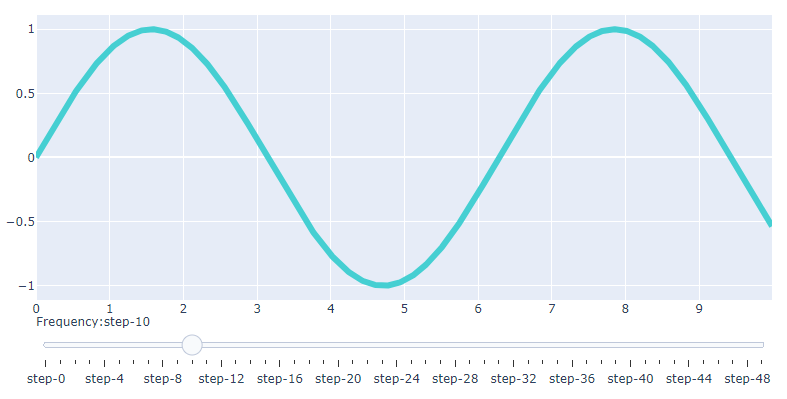
1. 添加滑动条:
#!/usr/bin/env python
# -*- coding: utf-8 -*-
# author:Zhang Kai time:2020/4/14
import plotly.graph_objects as go
import numpy as np

# Create figure
fig = go.Figure()

# Add traces, one for each slider step
for step in np.arange(0, 5, 0.1):
    fig.add_trace(
        go.Scatter(
            visible=False,
            line=dict(color="#00CED1", width=6),
            name="𝜈 = " + str(step),
            x=np.arange(0, 10, 0.01),
            y=np.sin(step * np.arange(0, 10, 0.01))))

# Make 10th trace visible
fig.data[10].visible = True

# Create and add slider
steps = []
for i in range(len(fig.data)):
    step = dict(
        method="restyle",
        args=["visible", [False] * len(fig.data)],
    )
    step["args"][1][i] = True  # Toggle i'th trace to "visible"
    steps.append(step)
    arg=["visible", [False] * len(fig.data)]
    print(step)
    print("--------------------")

sliders = [dict(
    active=10,   #默认值
    currentvalue={"prefix": "Frequency:"},    #滑动条显示的名称;
    pad={"t": 10},    # 调节滑动条的位置,单位像素;
    steps=steps
)]

fig.update_layout(
    sliders=sliders
)
2. 按钮
import plotly.graph_objects as go

import pandas as pd

# load dataset
df = pd.read_csv("https://raw.githubusercontent.com/plotly/datasets/master/volcano.csv")

# create figure
fig = go.Figure()

# Add surface trace
fig.add_trace(go.Surface(z=df.values.tolist(), colorscale="Viridis"))

# Update plot sizing
fig.update_layout(
    width=800,
    height=900,
    autosize=False,
    margin=dict(t=0, b=0, l=0, r=0),
    template="plotly_white",
)

# Update 3D scene options
fig.update_scenes(
    aspectratio=dict(x=1, y=1, z=0.7),
    aspectmode="manual"
)

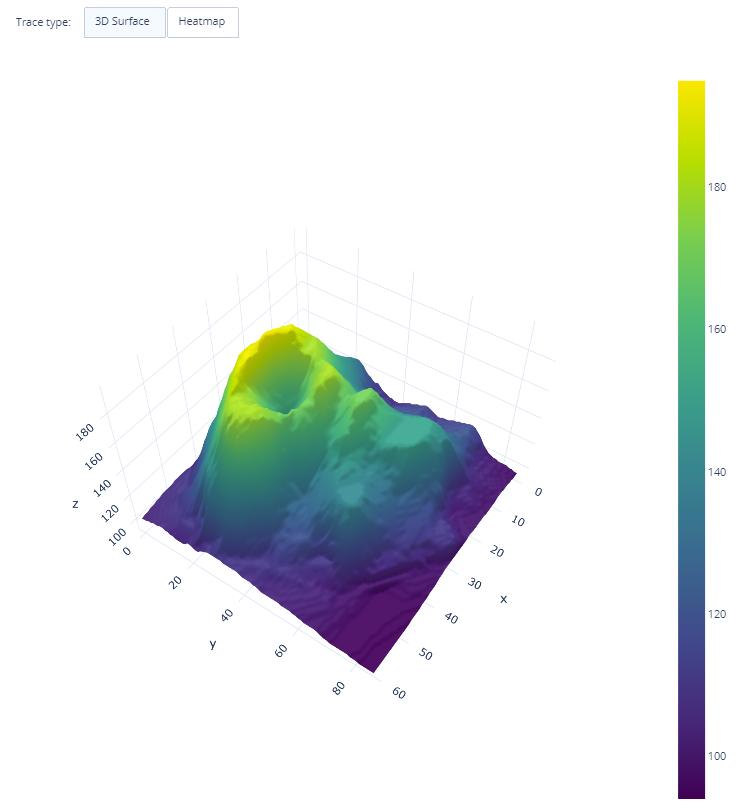
# Add dropdown
fig.update_layout(
    updatemenus=[
        dict(
            type = "buttons",
            direction = "left",
            buttons=list([
                dict(
                    args=["type", "surface"],
                    label="3D Surface",
                    method="restyle"
                ),
                dict(
                    args=["type", "heatmap"],
                    label="Heatmap",
                    method="restyle"
                )
            ]),
            pad={"r": 10, "t": 10},
            showactive=True,
            x=0.11,
            xanchor="left",
            y=1.1,
            yanchor="top"
        ),
    ]
)

# Add annotation
fig.update_layout(
    annotations=[
        dict(text="Trace type:", showarrow=False,
                             x=0, y=1.08, yref="paper", align="left")
    ]
)

fig.show()
3. 下拉菜单
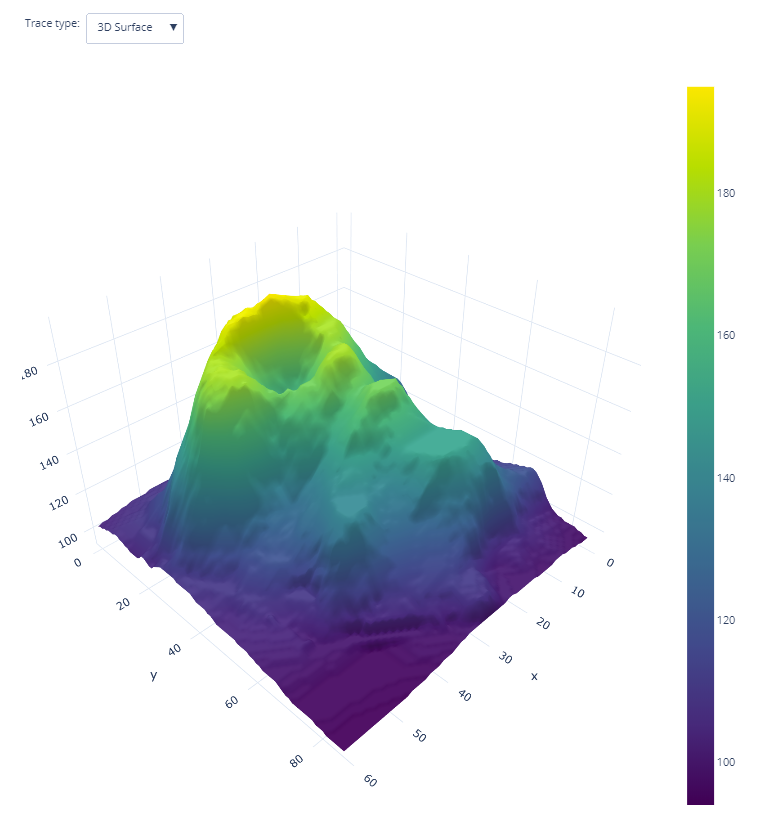
Mode: Restyle
a. 设置一个属性的下拉菜单:
import plotly.graph_objects as go

import pandas as pd

# load dataset
df = pd.read_csv("https://raw.githubusercontent.com/plotly/datasets/master/volcano.csv")

# create figure
fig = go.Figure()

# Add surface trace
fig.add_trace(go.Surface(z=df.values.tolist(), colorscale="Viridis"))

# Update plot sizing
fig.update_layout(
    width=800,
    height=900,
    autosize=False,
    margin=dict(t=0, b=0, l=0, r=0),
    template="plotly_white",
)

# Update 3D scene options
fig.update_scenes(
    aspectratio=dict(x=1, y=1, z=0.7),
    aspectmode="manual"
)

# Add dropdown
fig.update_layout(
    updatemenus=[
        dict(
            buttons=list([
                dict(
                    args=["type", "surface"],
                    label="3D Surface",
                    method="restyle"
                ),
                dict(
                    args=["type", "heatmap"],
                    label="Heatmap",
                    method="restyle"
                )
            ]),
            direction="down",
            pad={"r": 10, "t": 10},
            showactive=True,
            x=0.1,
            xanchor="left",
            y=1.1,
            yanchor="top"
        ),
    ]
)

# Add annotation
fig.update_layout(
    annotations=[
        dict(text="Trace type:", showarrow=False,
        x=0, y=1.085, yref="paper", align="left")
    ]
)

fig.show()
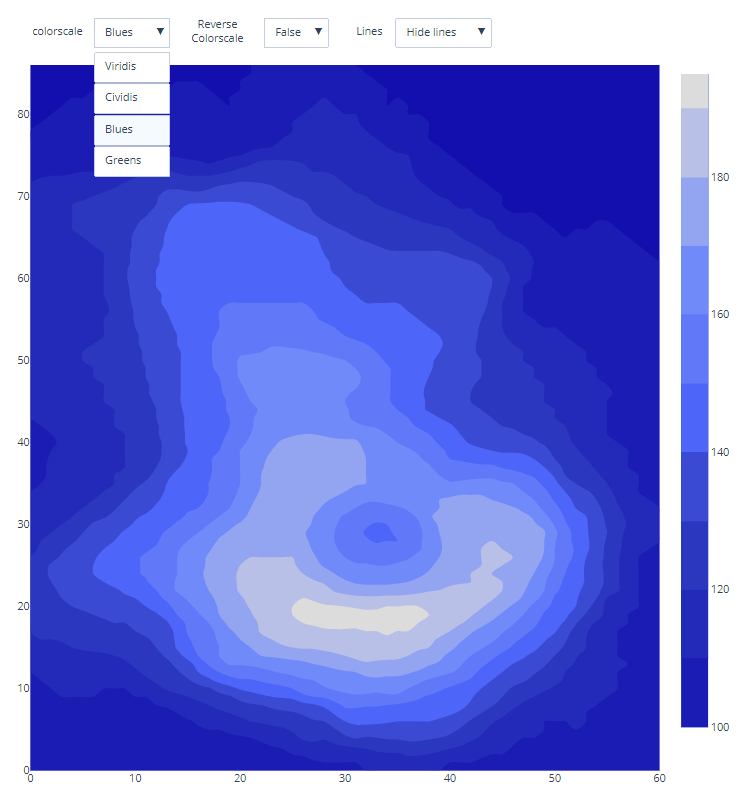
b. 设置多个属性的下拉菜单
import plotly.graph_objects as go

import pandas as pd

# load dataset
df = pd.read_csv("https://raw.githubusercontent.com/plotly/datasets/master/volcano.csv")

# Create figure
fig = go.Figure()

# Add surface trace
fig.add_trace(go.Heatmap(z=df.values.tolist(), colorscale="Viridis"))

# Update plot sizing
fig.update_layout(
    width=800,
    height=900,
    autosize=False,
    margin=dict(t=100, b=0, l=0, r=0),
)

# Update 3D scene options
fig.update_scenes(
    aspectratio=dict(x=1, y=1, z=0.7),
    aspectmode="manual"
)

# Add drowdowns
button_layer_1_height = 1.08
fig.update_layout(
    updatemenus=[
        dict(
            buttons=list([
                dict(
                    args=["colorscale", "Viridis"],
                    label="Viridis",
                    method="restyle"
                ),
                dict(
                    args=["colorscale", "Cividis"],
                    label="Cividis",
                    method="restyle"
                ),
                dict(
                    args=["colorscale", "Blues"],
                    label="Blues",
                    method="restyle"
                ),
                dict(
                    args=["colorscale", "Greens"],
                    label="Greens",
                    method="restyle"
                ),
            ]),
            direction="down",
            pad={"r": 10, "t": 10},
            showactive=True,
            x=0.1,
            xanchor="left",
            y=button_layer_1_height,
            yanchor="top"
        ),
        dict(
            buttons=list([
                dict(
                    args=["reversescale", False],
                    label="False",
                    method="restyle"
                ),
                dict(
                    args=["reversescale", True],
                    label="True",
                    method="restyle"
                )
            ]),
            direction="down",
            pad={"r": 10, "t": 10},
            showactive=True,
            x=0.37,
            xanchor="left",
            y=button_layer_1_height,
            yanchor="top"
        ),
        dict(
            buttons=list([
                dict(
                    args=[{"contours.showlines": False, "type": "contour"}],
                    label="Hide lines",
                    method="restyle"
                ),
                dict(
                    args=[{"contours.showlines": True, "type": "contour"}],
                    label="Show lines",
                    method="restyle"
                ),
            ]),
            direction="down",
            pad={"r": 10, "t": 10},
            showactive=True,
            x=0.58,
            xanchor="left",
            y=button_layer_1_height,
            yanchor="top"
        ),
    ]
)

fig.update_layout(
    annotations=[
        dict(text="colorscale", x=0, xref="paper", y=1.06, yref="paper",
                             align="left", showarrow=False),
        dict(text="Reverse<br>Colorscale", x=0.25, xref="paper", y=1.07,
                             yref="paper", showarrow=False),
        dict(text="Lines", x=0.54, xref="paper", y=1.06, yref="paper",
                             showarrow=False)
    ])

fig.show()
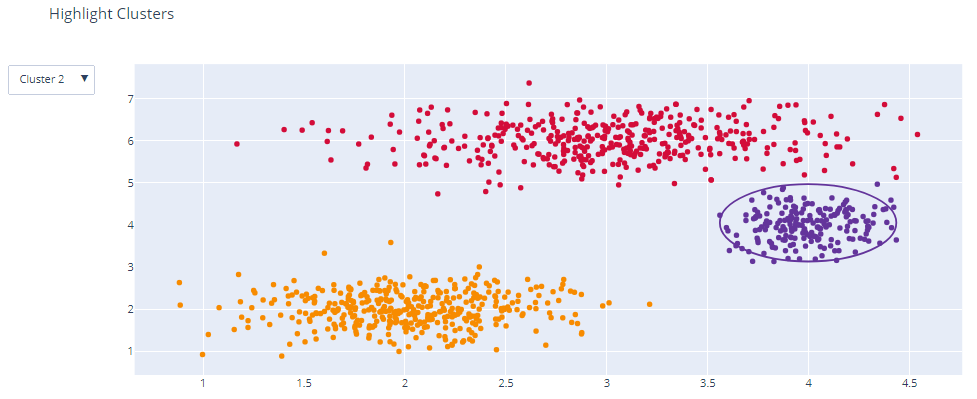
Mode: Relayout
import plotly.graph_objects as go

# Generate dataset
import numpy as np
np.random.seed(1)

x0 = np.random.normal(2, 0.4, 400)
y0 = np.random.normal(2, 0.4, 400)
x1 = np.random.normal(3, 0.6, 600)
y1 = np.random.normal(6, 0.4, 400)
x2 = np.random.normal(4, 0.2, 200)
y2 = np.random.normal(4, 0.4, 200)

# Create figure
fig = go.Figure()

# Add traces
fig.add_trace(
    go.Scatter(
        x=x0,
        y=y0,
        mode="markers",
        marker=dict(color="DarkOrange")
    )
)

fig.add_trace(
    go.Scatter(
        x=x1,
        y=y1,
        mode="markers",
        marker=dict(color="Crimson")
    )
)

fig.add_trace(
    go.Scatter(
        x=x2,
        y=y2,
        mode="markers",
        marker=dict(color="RebeccaPurple")
    )
)

# Add buttons that add shapes
cluster0 = [dict(type="circle",
                            xref="x", yref="y",
                            x0=min(x0), y0=min(y0),
                            x1=max(x0), y1=max(y0),
                            line=dict(color="DarkOrange"))]
cluster1 = [dict(type="circle",
                            xref="x", yref="y",
                            x0=min(x1), y0=min(y1),
                            x1=max(x1), y1=max(y1),
                            line=dict(color="Crimson"))]
cluster2 = [dict(type="circle",
                            xref="x", yref="y",
                            x0=min(x2), y0=min(y2),
                            x1=max(x2), y1=max(y2),
                            line=dict(color="RebeccaPurple"))]

fig.update_layout(
    updatemenus=[
        dict(buttons=list([
            dict(label="None",
                 method="relayout",
                 args=["shapes", []]),
            dict(label="Cluster 0",
                 method="relayout",
                 args=["shapes", cluster0]),
            dict(label="Cluster 1",
                 method="relayout",
                 args=["shapes", cluster1]),
            dict(label="Cluster 2",
                 method="relayout",
                 args=["shapes", cluster2]),
            dict(label="All",
                 method="relayout",
                 args=["shapes", cluster0 + cluster1 + cluster2])
        ]),
        )
    ]
)

# Update remaining layout properties
fig.update_layout(
    title_text="Highlight Clusters",
    showlegend=False,
)

fig.show()
Mode: Update
import plotly.graph_objects as go

import pandas as pd

# Load dataset
df = pd.read_csv(
    "https://raw.githubusercontent.com/plotly/datasets/master/finance-charts-apple.csv")
df.columns = [col.replace("AAPL.", "") for col in df.columns]

# Initialize figure
fig = go.Figure()

# Add Traces

fig.add_trace(
    go.Scatter(x=list(df.index),
               y=list(df.High),
               name="High",
               line=dict(color="#33CFA5")))

fig.add_trace(
    go.Scatter(x=list(df.index),
               y=[df.High.mean()] * len(df.index),
               name="High Average",
               visible=False,
               line=dict(color="#33CFA5", dash="dash")))

fig.add_trace(
    go.Scatter(x=list(df.index),
               y=list(df.Low),
               name="Low",
               line=dict(color="#F06A6A")))

fig.add_trace(
    go.Scatter(x=list(df.index),
               y=[df.Low.mean()] * len(df.index),
               name="Low Average",
               visible=False,
               line=dict(color="#F06A6A", dash="dash")))

# Add Annotations and Buttons
high_annotations = [dict(x="2016-03-01",
                         y=df.High.mean(),
                         xref="x", yref="y",
                         text="High Average:<br> %.3f" % df.High.mean(),
                         ax=0, ay=-40),
                    dict(x=df.High.idxmax(),
                         y=df.High.max(),
                         xref="x", yref="y",
                         text="High Max:<br> %.3f" % df.High.max(),
                         ax=0, ay=-40)]
low_annotations = [dict(x="2015-05-01",
                        y=df.Low.mean(),
                        xref="x", yref="y",
                        text="Low Average:<br> %.3f" % df.Low.mean(),
                        ax=0, ay=40),
                   dict(x=df.High.idxmin(),
                        y=df.Low.min(),
                        xref="x", yref="y",
                        text="Low Min:<br> %.3f" % df.Low.min(),
                        ax=0, ay=40)]

fig.update_layout(
    updatemenus=[
        dict(
            active=0,
            buttons=list([
                dict(label="None",
                     method="update",
                     args=[{"visible": [True, False, True, False]},
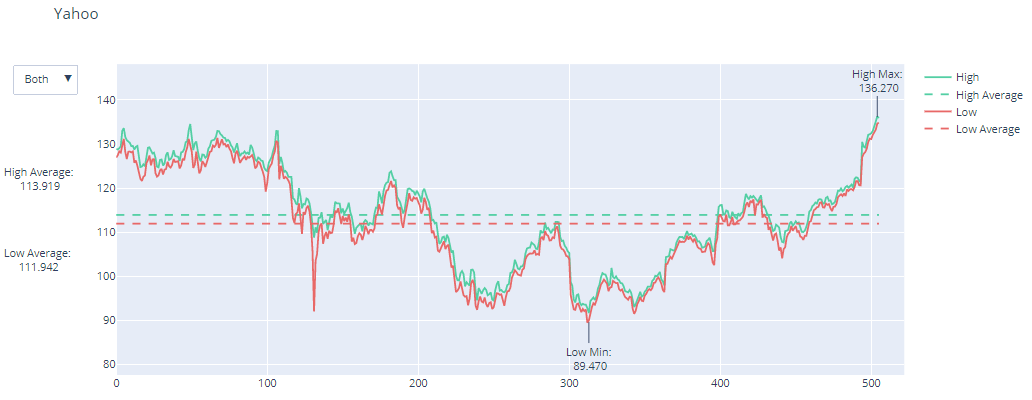
                           {"title": "Yahoo",
                            "annotations": []}]),
                dict(label="High",
                     method="update",
                     args=[{"visible": [True, True, False, False]},
                           {"title": "Yahoo High",
                            "annotations": high_annotations}]),
                dict(label="Low",
                     method="update",
                     args=[{"visible": [False, False, True, True]},
                           {"title": "Yahoo Low",
                            "annotations": low_annotations}]),
                dict(label="Both",
                     method="update",
                     args=[{"visible": [True, True, True, True]},
                           {"title": "Yahoo",
                            "annotations": high_annotations + low_annotations}]),
            ]),
        )
    ])

# Set title
fig.update_layout(title_text="Yahoo")

fig.show()
4. 区间滑动条
import plotly.graph_objects as go

import pandas as pd

# Load data
df = pd.read_csv(
    "https://raw.githubusercontent.com/plotly/datasets/master/finance-charts-apple.csv")
df.columns = [col.replace("AAPL.", "") for col in df.columns]

# Create figure
fig = go.Figure()

fig.add_trace(
    go.Scatter(x=list(df.Date), y=list(df.High)))

# Set title
fig.update_layout(
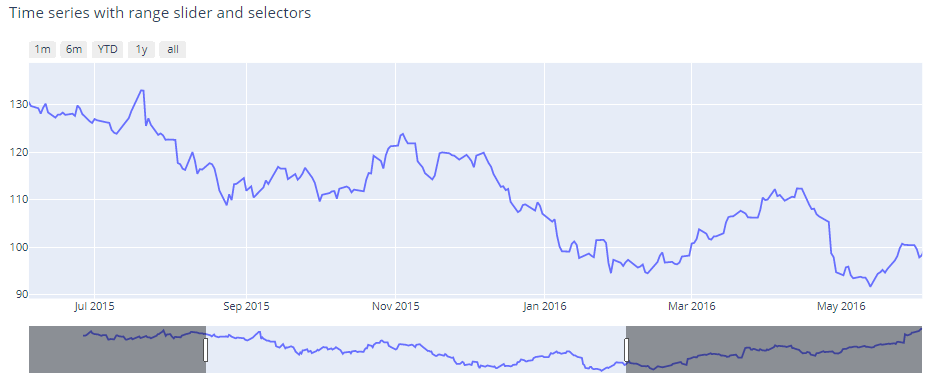
    title_text="Time series with range slider and selectors"
)

# Add range slider
fig.update_layout(
    xaxis=dict(
        rangeselector=dict(
            buttons=list([
                dict(count=1,
                     label="1m",
                     step="month",
                     stepmode="backward"),
                dict(count=6,
                     label="6m",
                     step="month",
                     stepmode="backward"),
                dict(count=1,
                     label="YTD",
                     step="year",
                     stepmode="todate"),
                dict(count=1,
                     label="1y",
                     step="year",
                     stepmode="backward"),
                dict(step="all")
            ])
        ),
        rangeslider=dict(
            visible=True
        ),
        type="date"
    )
)

fig.show()

import plotly.graph_objects as go

# Create figure
fig = go.Figure()

# Add traces
fig.add_trace(go.Scatter(
    x=["2013-01-15", "2013-01-29", "2013-02-26", "2013-04-19", "2013-07-02",
       "2013-08-27",
       "2013-10-22", "2014-01-20", "2014-05-05", "2014-07-01", "2015-02-09",
       "2015-04-13",
       "2015-05-13", "2015-06-08", "2015-08-05", "2016-02-25"],
    y=["8", "3", "2", "10", "5", "5", "6", "8", "3", "3", "7", "5", "10", "10", "9",
       "14"],
    name="var0",
    text=["8", "3", "2", "10", "5", "5", "6", "8", "3", "3", "7", "5", "10", "10", "9",
          "14"],
    yaxis="y",
))

fig.add_trace(go.Scatter(
    x=["2015-04-13", "2015-05-13", "2015-06-08", "2015-08-05", "2016-02-25"],
    y=["53.0", "69.0", "89.0", "41.0", "41.0"],
    name="var1",
    text=["53.0", "69.0", "89.0", "41.0", "41.0"],
    yaxis="y2",
))

fig.add_trace(go.Scatter(
    x=["2013-01-29", "2013-02-26", "2013-04-19", "2013-07-02", "2013-08-27",
       "2013-10-22",
       "2014-01-20", "2014-04-09", "2014-05-05", "2014-07-01", "2014-09-30",
       "2015-02-09",
       "2015-04-13", "2015-06-08", "2016-02-25"],
    y=["9.6", "4.6", "2.7", "8.3", "18", "7.3", "3", "7.5", "1.0", "0.5", "2.8", "9.2",
       "13", "5.8", "6.9"],
    name="var2",
    text=["9.6", "4.6", "2.7", "8.3", "18", "7.3", "3", "7.5", "1.0", "0.5", "2.8",
          "9.2",
          "13", "5.8", "6.9"],
    yaxis="y3",
))

fig.add_trace(go.Scatter(
    x=["2013-01-29", "2013-02-26", "2013-04-19", "2013-07-02", "2013-08-27",
       "2013-10-22",
       "2014-01-20", "2014-04-09", "2014-05-05", "2014-07-01", "2014-09-30",
       "2015-02-09",
       "2015-04-13", "2015-06-08", "2016-02-25"],
    y=["6.9", "7.5", "7.3", "7.3", "6.9", "7.1", "8", "7.8", "7.4", "7.9", "7.9", "7.6",
       "7.2", "7.2", "8.0"],
    name="var3",
    text=["6.9", "7.5", "7.3", "7.3", "6.9", "7.1", "8", "7.8", "7.4", "7.9", "7.9",
          "7.6",
          "7.2", "7.2", "8.0"],
    yaxis="y4",
))

fig.add_trace(go.Scatter(
    x=["2013-02-26", "2013-07-02", "2013-09-26", "2013-10-22", "2013-12-04",
       "2014-01-02",
       "2014-01-20", "2014-05-05", "2014-07-01", "2015-02-09", "2015-05-05"],
    y=["290", "1078", "263", "407", "660", "740", "33", "374", "95", "734", "3000"],
    name="var4",
    text=["290", "1078", "263", "407", "660", "740", "33", "374", "95", "734", "3000"],
    yaxis="y5",
))

# style all the traces
fig.update_traces(
    hoverinfo="name+x+text",
    line={"width": 0.5},
    marker={"size": 8},
    mode="lines+markers",
    showlegend=False
)

# Add annotations
fig.update_layout(
    annotations=[
        dict(
            x="2013-06-01",
            y=0,
            arrowcolor="rgba(63, 81, 181, 0.2)",
            arrowsize=0.3,
            ax=0,
            ay=30,
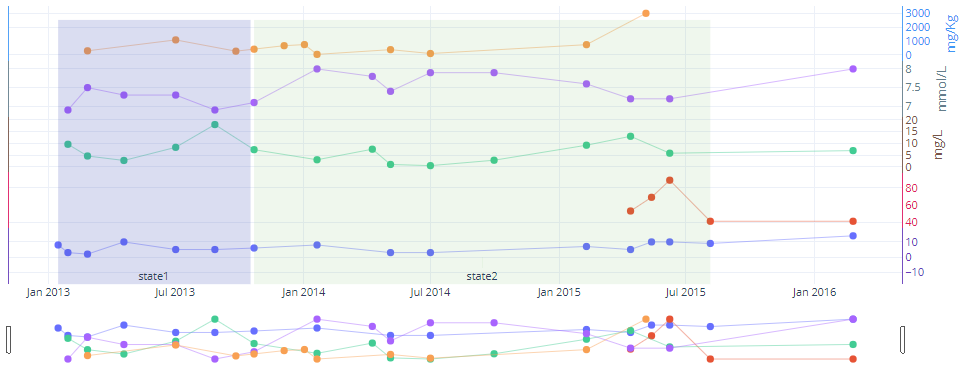
            text="state1",
            xref="x",
            yanchor="bottom",
            yref="y"
        ),
        dict(
            x="2014-09-13",
            y=0,
            arrowcolor="rgba(76, 175, 80, 0.1)",
            arrowsize=0.3,
            ax=0,
            ay=30,
            text="state2",
            xref="x",
            yanchor="bottom",
            yref="y"
        )
    ],
)

# Add shapes
fig.update_layout(
    shapes=[
        dict(
            fillcolor="rgba(63, 81, 181, 0.2)",
            line={"width": 0},
            type="rect",
            x0="2013-01-15",
            x1="2013-10-17",
            xref="x",
            y0=0,
            y1=0.95,
            yref="paper"
        ),
        dict(
            fillcolor="rgba(76, 175, 80, 0.1)",
            line={"width": 0},
            type="rect",
            x0="2013-10-22",
            x1="2015-08-05",
            xref="x",
            y0=0,
            y1=0.95,
            yref="paper"
        )
    ]
)

# Update axes
fig.update_layout(
    xaxis=dict(
        autorange=True,
        range=["2012-10-31 18:36:37.3129", "2016-05-10 05:23:22.6871"],
        rangeslider=dict(
            autorange=True,
            range=["2012-10-31 18:36:37.3129", "2016-05-10 05:23:22.6871"]
        ),
        type="date"
    ),
    yaxis=dict(
        anchor="x",
        autorange=True,
        domain=[0, 0.2],
        linecolor="#673ab7",
        mirror=True,
        range=[-60.0858369099, 28.4406294707],
        showline=True,
        side="right",
        tickfont={"color": "#673ab7"},
        tickmode="auto",
        ticks="",
        titlefont={"color": "#673ab7"},
        type="linear",
        zeroline=False
    ),
    yaxis2=dict(
        anchor="x",
        autorange=True,
        domain=[0.2, 0.4],
        linecolor="#E91E63",
        mirror=True,
        range=[29.3787777032, 100.621222297],
        showline=True,
        side="right",
        tickfont={"color": "#E91E63"},
        tickmode="auto",
        ticks="",
        titlefont={"color": "#E91E63"},
        type="linear",
        zeroline=False
    ),
    yaxis3=dict(
        anchor="x",
        autorange=True,
        domain=[0.4, 0.6],
        linecolor="#795548",
        mirror=True,
        range=[-3.73690396239, 22.2369039624],
        showline=True,
        side="right",
        tickfont={"color": "#795548"},
        tickmode="auto",
        ticks="",
        title="mg/L",
        titlefont={"color": "#795548"},
        type="linear",
        zeroline=False
    ),
    yaxis4=dict(
        anchor="x",
        autorange=True,
        domain=[0.6, 0.8],
        linecolor="#607d8b",
        mirror=True,
        range=[6.63368032236, 8.26631967764],
        showline=True,
        side="right",
        tickfont={"color": "#607d8b"},
        tickmode="auto",
        ticks="",
        title="mmol/L",
        titlefont={"color": "#607d8b"},
        type="linear",
        zeroline=False
    ),
    yaxis5=dict(
        anchor="x",
        autorange=True,
        domain=[0.8, 1],
        linecolor="#2196F3",
        mirror=True,
        range=[-685.336803224, 3718.33680322],
        showline=True,
        side="right",
        tickfont={"color": "#2196F3"},
        tickmode="auto",
        ticks="",
        title="mg/Kg",
        titlefont={"color": "#2196F3"},
        type="linear",
        zeroline=False
    )
)

# Update layout
fig.update_layout(
    dragmode="zoom",
    hovermode="x",
    legend=dict(traceorder="reversed"),
    height=600,
    template="plotly_white",
    margin=dict(
        t=100,
        b=100
    ),
)

fig.show()


 浙公网安备 33010602011771号