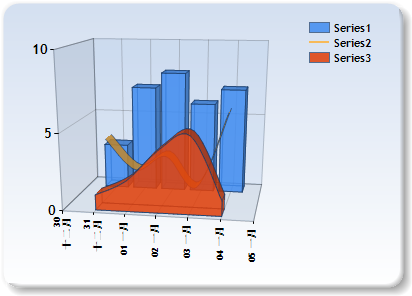
微软图形控件(Chart或MSchart)的用法

下面是下载地址:
    控件:Microsoft .NET Framework 3.5 的 Microsoft 图表控件(Microsoft Chart Controls for Microsoft .NET Framework 3.5)–
  1. 包含英文版,中文版。上面提供的链接是中文版的,可以更改为英文版。

  2. 语言包:Microsoft Chart Controls for Microsoft .NET Framework 3.5 Language Pack

  3. Microsoft .NET Framework 3.5 的Microsoft 图表控件 的语言包,包含23中语言。

  4. Microsoft Chart Controls Add-on for Microsoft Visual Studio 2008
    这个只有英文的,没找到中文的。

  5. 文档 (Microsoft Chart Controls for .NET Framework Documentation)
    这个只有英文的,没找到中文的。

  6. [/url][url=http://www.microsoft.com/downloads/details.aspx?FamilyId=1D69CE13-E1E5-4315-825C-F14D33A303E9&displaylang=en]WinForm 和 Asp.net的例子(Samples Environment for Microsoft Chart Controls) –
    这个只有英文的,没找到英文的。

  7. Demo 下载:http://code.msdn.microsoft.com/mschart

 下了它的示例程序后,运行了一下,非常的强大,可以支持各种各样的图形显示,常见的:点状图、饼图、柱状图、曲线图、面积图、排列图等等,同时也支持3D样式的图表显示,不过我觉得最有用的功能还是支持图形上各个点的属性操作,它可以定义图形上各个点、标签、图形的提示信息(Tooltip)以及超级链接、Javascript动作等,而不是像其它图形类库仅生成一幅图片而已,通过这些,加上微软自己的Ajax框架,可以建立一个可以互动的图形统计报表了。
一。安装
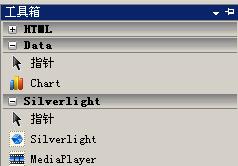
     控件的安装相对比较简单,下载完后,先执行“MSChart.exe”程序,它会自动检测你的环境,安装到系统目录中去,如果要在VS 2008环境中直接使用,那么需要安装For Vs2008的插件,MSChart_VisualStudioAddOn.exe,还有一个中文语言包MSChartLP_chs.exe。安装完后,打开Vs2008,在建立项目的时候,你就能在工具栏中看到有一个Chart的控件了,如下图:
二。使用
    安装好后,建立一个.NET3.5的Web项目,像使用普通控件一样拖放到要使用的Web界面即可。初步研究了一下,整个图形控件主要由以下几个部份组成:
1.Annotations --图形注解集合
2.ChartAreas  --图表区域集合
3.Legends      --图例集合
4.Series    --图表序列集合(即图表数据对象集合)
5.Titles    --图标的标题集合
Annotations注解集合
     Annotations是一个对图形的一些注解对象的集合,所谓注解对象,类似于对某个点的详细或者批注的说明,比如,在图片上实现各个节点的关键信息,如下图方框和黄色的小方框:
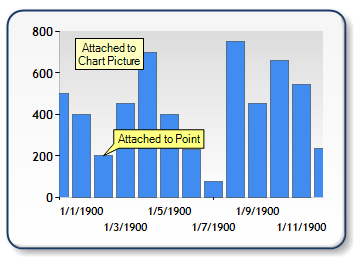
  一个图形上可以拥有多个注解对象,可以添加十多种图形样式的注解对象,包括常见的箭头、云朵、矩行、图片等等注解符号,通过各个注解对象的属性,可以方便的设置注解对象的放置位置、呈现的颜色、大小、文字内容样式等常见的属性。
ChartAreas图表区域集合
    ChartAreas可以理解为是一个图表的绘图区,例如,你想在一幅图上呈现两个不同属性的内容,一个是用户流量,另一个则是系统资源占用情况,那么你要在一个图形上绘制这两种情况,明显是不合理的,对于这种情况,可以建立两个ChartArea,一个用于呈现用户流量,另一个则用于呈现系统资源的占用情况。
    当然了,图表控件并不限制你添加多少个绘图区域,你可以根据你的需要进行添加。对于每一个绘图区域,你可以设置各自的属性,如:X,Y轴属性、背景等。
    需要注意的是,绘图区域只是一个可以作图的区域范围,它本身并不包含要作图形的各种属性数据。
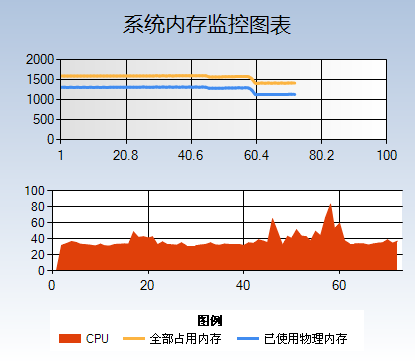
    多绘图区效果图如下,分为上下两个绘图区域,分别表示不同的绘图数据:

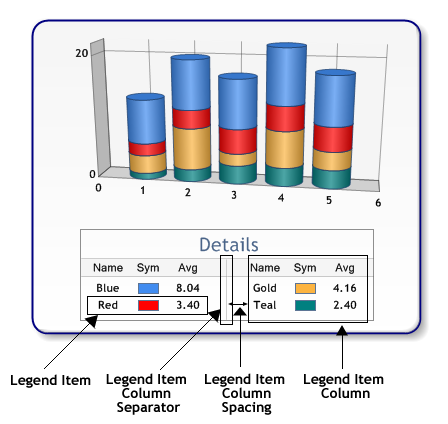
   Legends图例集合
    Legends是一个图例的集合,即标注图形中各个线条或颜色的含义,同样,一个图片也可以包含多个图例说明,比如像上面说的多个图表区域的方式,则可以建立多个图例,每别说明各个绘图区域的信息,具体的图例配置说明此处就不详细说明了,可以参考一下官网的例子,写得丰富的详细了:)也上一张图例的效果图吧~
Series图表序列
     图表序列,应该是整个绘图中最关键的内容了,通俗点说,即是实际的绘图数据区域,实际呈现的图形形状,就是由此集合中的每一个图表来构成的,可以往集合里面添加多个图表,每一个图表可以有自己的绘制形状、样式、独立的数据等。
    需要注意的是,每一个图表,你可以指定它的绘制区域(见ChartAreas的说明),让此图表呈现在某个绘图区域,也可以让几个图表在同一个绘图区域叠加,如下图:


上面两幅图,分别表示了把图表放在不同的绘制区域和放在同一个绘制区域的情况。
     继续回到ChartAreas章节举的例子,同时要显示用户的流量还要显示系统的占用情况,对于这种时候,应该建立两个Series,一个用于呈现用户的流量,另一个则用于呈现系统的占用情况。它们分别属于各自的绘图区域。
Titles标题合集
    根据字面含义即可以理解,是图表的标题配置,同样可以添加多个标题,以及设置标题的样式及文字、位置等属性。多看一下它的属性即能明白各自的含义。
三。其它属性
    相对来说,我觉得比较有用的属性有三个,分别是:Label、Tooltip以及Url链接。
    Label即标签的含义,可以在图片的关键位置进行一些关键数字或文字的描述,如下图:
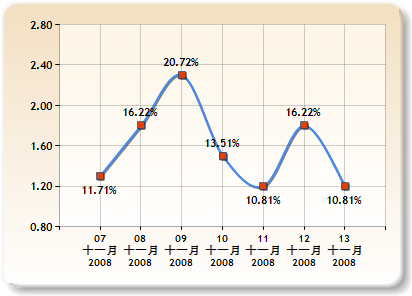
像上图:X轴和Y轴的文字便是标签,以及图表曲线中的红点上的文字,也是标签,添加了标签,可以让人更容易的对内容进行理解。
    Tooltip即提示的含义,用于在各个关键点,如:标签、图形关键点、标题等当鼠标移动上去的时候,提示用户一些相关的详细或说明信息,例如上图,可以给曲线中的每一个点增加Tooltip的属性,写上需要详细说明的内容,比如:详细的销售明细,那么,在鼠标移动到这个点的时候,会自动弹出提示信息。
    Tooltip可以支持简单方式以及自定义的方式,简单方式即像平时Html页面设置的title之类的属性效果,而自定义的方式,则可以实现图形、文本等各种复杂的提示信息显示。详细的方式请参考官方例子的:Interactivity and AJAX/Tooltips以及Interactivity and AJAX/Client Side Scripts下面的相关例子。
    Url链接,图表控件中,有一大半的控件都有Url及Tooltip的属性,你可以设置此属性,在鼠标点击的时候,代到其它相应的页面去。
   建议大家看看官方例子中的Interactivity and AJAX部份,很精彩:)
例子:建立一个Cpu信息和内存使用的实时统计表
    下面写一个小例子,建立一个系统的内存实时统计图表,使用到了Ajax的方法,以及Windows Api取得系统内存的方法。
    首先,建立一个Aspx页面,拖动一个图表控件到页面,设置图表控件的属性如下:
   其中,MEMORY_INFO,ComputerInfo是一个定义的结构体及调用Win32 API接口的一个访问类。程序分别取得每一个图表对象,每次加载的时候,都重新取得当前的内存和Cpu信息,再在图表上添加一个点,需要注意的是,一定要设置图表控件的EnableViewState属性为True,否则无法记录状态。
 
Code

Code highlighting produced by Actipro CodeHighlighter (freeware)
http://www.CodeHighlighter.com/

--><asp:Chart ID="ChartMemory" runat="server" BackColor="LightSteelBlue"
BackGradientStyle
="TopBottom" BackSecondaryColor="White" EnableTheming="False"
EnableViewState
="True" Height="363px" Width="415px">
<Legends>
<asp:Legend Alignment="Center" Docking="Bottom" Name="Legend1" Title="图例">
</asp:Legend>
</Legends>
<Titles>
<asp:Title Font="微软雅黑, 16pt" Name="Title1" Text="系统内存监控图表">
</asp:Title>
</Titles>
<Series>
<asp:Series BorderColor="White" BorderWidth="3" ChartArea="ChartArea1"
ChartType
="Spline" Legend="Legend1" Name="已使用物理内存" XValueType="Double"
YValueType
="Double">
</asp:Series>
<asp:Series BorderWidth="3" ChartArea="ChartArea1" ChartType="Spline"
Legend
="Legend1" Name="全部占用内存">
</asp:Series>
<asp:Series ChartArea="ChartArea2" ChartType="StackedArea" Legend="Legend1"
Name
="CPU">
</asp:Series>
</Series>
<ChartAreas>
<asp:ChartArea BackColor="224, 224, 224" BackGradientStyle="LeftRight"
Name
="ChartArea1">
</asp:ChartArea>
<asp:ChartArea Name="ChartArea2">
</asp:ChartArea>
</ChartAreas>
</asp:Chart> 


一共建立了两个绘图区,一个用于呈现内存使用情况的在ChartArea1区域,另一个则是呈现Cpu使用情况的,放置在ChartArea2区域了。一共有三个图表,分别表示已使用的物理内存、全部占用的物理内存,以及Cpu使用显示的情况。
添加一个Ajax的计时器以及Ajax的ScriptManager,UpdatePanel,把计时器和图表控件都拖进UpdatePanel里面。设置计时器的间隔时间为一秒钟(1000),双击计时器,写如下代码:
Code

Code highlighting produced by Actipro CodeHighlighter (freeware)
http://www.CodeHighlighter.com/

-->static PerformanceCounter pc =new PerformanceCounter("Processor", "% Processor Time", "_Total");
protectedvoid Timer1_Tick(object sender, EventArgs e)
{
MEMORY_INFO MemInfo
=new MEMORY_INFO();
ComputerInfo.GlobalMemoryStatus(
ref MemInfo);
//UseMemory
Series series = ChartMemory.Series[0];
int xCount = series.Points.Count ==0?0 : series.Points.Count -1;
double lastXValue = series.Points.Count ==0?1 : series.Points[xCount].XValue +1;
double lastYValue = (double)(MemInfo.dwTotalPhys-MemInfo.dwAvailPhys)/1024/1024;
series.Points.AddXY(lastXValue, lastYValue);
//Total Memory
series = ChartMemory.Series[1];
lastYValue
= (double)(MemInfo.dwTotalVirtual+MemInfo.dwTotalPhys-MemInfo.dwAvailPhys - MemInfo.dwAvailVirtual)/1024/1024;
series.Points.AddXY(lastXValue, lastYValue);

//CPU
series = ChartMemory.Series[2];
lastYValue
= (double)pc.NextValue();
series.Points.AddXY(lastXValue, lastYValue);

// Remove points from the left chart side if number of points exceeds 100.
while (this.ChartMemory.Series[0].Points.Count >80)
{
// Remove series points
foreach (Series s inthis.ChartMemory.Series)
{
s.Points.RemoveAt(
0);
}
}
// Adjust categorical scale
double axisMinimum =this.ChartMemory.Series[0].Points[0].XValue;
this.ChartMemory.ChartAreas[0].AxisX.Minimum = axisMinimum;
this.ChartMemory.ChartAreas[0].AxisX.Maximum = axisMinimum +99;
}


   附上取得内存信息的类代码:
 
Code

Code highlighting produced by Actipro CodeHighlighter (freeware)
http://www.CodeHighlighter.com/

-->///<summary>
///取得计算机的系统信息
///</summary>
publicclass ComputerInfo
{
///<summary>
/// 取得Windows的目录
///</summary>
///<param name="WinDir"></param>
///<param name="count"></param>
[DllImport("kernel32")]
publicstaticexternvoid GetWindowsDirectory(StringBuilder WinDir, int count);
///<summary>
/// 获取系统路径
///</summary>
///<param name="SysDir"></param>
///<param name="count"></param>
[DllImport("kernel32")]
publicstaticexternvoid GetSystemDirectory(StringBuilder SysDir, int count);
///<summary>
/// 取得CPU信息
///</summary>
///<param name="cpuinfo"></param>
[DllImport("kernel32")]
publicstaticexternvoid GetSystemInfo(ref CPU_INFO cpuinfo);
///<summary>
/// 取得内存状态
///</summary>
///<param name="meminfo"></param>
[DllImport("kernel32")]
publicstaticexternvoid GlobalMemoryStatus(ref MEMORY_INFO meminfo);
///<summary>
/// 取得系统时间
///</summary>
///<param name="stinfo"></param>
[DllImport("kernel32")]
publicstaticexternvoid GetSystemTime(ref SYSTEMTIME_INFO stinfo);

public ComputerInfo()
{
}
}

//定义CPU的信息结构
[StructLayout(LayoutKind.Sequential)]
publicstruct CPU_INFO
{
publicuint dwOemId;
publicuint dwPageSize;
publicuint lpMinimumApplicationAddress;
publicuint lpMaximumApplicationAddress;
publicuint dwActiveProcessorMask;
publicuint dwNumberOfProcessors;
publicuint dwProcessorType;
publicuint dwAllocationGranularity;
publicuint dwProcessorLevel;
publicuint dwProcessorRevision;
}
//定义内存的信息结构
[StructLayout(LayoutKind.Sequential)]
publicstruct MEMORY_INFO
{
publicuint dwLength;
publicuint dwMemoryLoad;
publicuint dwTotalPhys;
publicuint dwAvailPhys;
publicuint dwTotalPageFile;
publicuint dwAvailPageFile;
publicuint dwTotalVirtual;
publicuint dwAvailVirtual;
}
//定义系统时间的信息结构
[StructLayout(LayoutKind.Sequential)]
publicstruct SYSTEMTIME_INFO
{
publicushort wYear;
publicushort wMonth;
publicushort wDayOfWeek;
publicushort wDay;
publicushort wHour;
publicushort wMinute;
publicushort wSecond;
publicushort wMilliseconds;
}


    运行的效果图如下


yaohao 2010-05-06 13:22
自己看  
  1、折线图  
  <HTML>  
  <HEAD>  
  <META   NAME="GENERATOR"   Content="Microsoft   FrontPage   4.0">  
  <TITLE>   Êý&frac34;ÝÏÔÊ&frac34;Í&frac14;   </TITLE>  
  <SCRIPT   ID="clientEventHandlersJS"   LANGUAGE="javascript">  
  function   window_onload()    
  {  
  t=0;  
  mschart1.chartType   =1; //Í&frac14;ÐÎÑùÊ&frac12;£º3DÖùÍ&frac14;  
    
  mschart1.Title.VtFont.Size       =10; //±êÌâ´óС£º10  
  mschart1.Title.VtFont.VtColor.Blue   =true; //±êÌâÑÕÉ«£ºÀ¶É«  
  mschart1.Title.VtFont.Style                 =1; //±êÌâÐÎÊ&frac12;£º´ÖÌ塢бÌå  
  mschart1.TitleText                                   =document.form1.chtitle.value; //±êÌâÄÚÈÝ  
    
  mschart1.Legend.VtFont.Size                       =9; //ϵÁÐÎÄ×Ö×ÖÌå´óС£º9  
  mschart1.Legend.Location.LocationType   =4; //ϵÁÐÎÄ×ÖÏÔÊ&frac34;λÖãºÓÒ&sup2;¿  
  mschart1.ShowLegend     =true;  
  if   (document.form1.ccount.value==1)  
  {   mschart1.ShowLegend                           =false;   } //Èç&sup1;û×ÜÏßÊýΪ1£¬ÏµÁÐÎÄ×Ö&sup2;»ÏÔÊ&frac34;  
    
  mschart1.Plot.Axis(0).Labels(1).VtFont.Size     =10; //XÖá´óС£º10  
  mschart1.Plot.Axis(1).Labels(1).VtFont.Size     =10; //YÖá´óС£º10  
  mschart1.Plot.Axis(2).Labels(1).VtFont.Size     =10; //ZÖá´óС£º10  
  mschart1.Plot.Axis(0).Labels(1).VtFont.Style   =1; //XÖáÐÎÊ&frac12;£º´ÖÌå  
    
  mschart1.ColumnCount   =document.form1.ccount.value; //×Ü&sup1;&sup2;ÏßÊý  
  mschart1.RowCount   =document.form1.rcount.value; //ÿÏßÉϵãÊý  
    
  for   (i=0;   i<document.form1.rcount.value;   i++)  
  {  
  for   (j=0;   j<document.form1.ccount.value;   j++)  
  {    
  mschart1.Row         =i+1;  
  mschart1.Column   =j+1;  
    
  if   (document.form1.ccount.value>1)  
  {   mschart1.ColumnLabel   =document.form1.cname(j).value;   }  
  else  
  {   mschart1.ColumnLabel   =document.form1.cname.value;       }  
    
  if   ((document.form1.rcount.value*document.form1.ccount.value)>1)  
  {   mschart1.Data   =document.form1.rc_data(t).value;   }  
  else  
  {   mschart1.Data   =document.form1.rc_data.value;         }  
    
  t++;  
  }  
  if   (document.form1.rcount.value>1)  
  {   mschart1.RowLabel   =document.form1.rname(i).value; }  
  else  
  {   mschart1.RowLabel   =document.form1.rname.value; }  
  }  
  }  
    
  function   select1_onchange()  
  {  
  mschart1.chartType   =select1.value  
  mschart1.Plot  
  }  
  </SCRIPT>  
  </HEAD>  
    
  <BODY   TOPMARGIN="0"   LANGUAGE="javascript"   ONLOAD="return   window_onload()">  
  <TABLE   BGCOLOR="#EEEEEE">  
  <TR   ALIGN="center"><TD>  
  <TABLE   WIDTH=100%><TR   align=center><TD><Font   size=2   color=blue><b><%=Request.Form("chtitle")%></b></FONT></TD></TR></TABLE>  
  <HR   COLOR="#F3C905">  
  <OBJECT   CLASSID="clsid:3A2B370C-BA0A-11D1-B137-0000F8753F5D"   CODEBASE="mschart.cab"   DATA=""   ID="mschart1"   STYLE="HEIGHT:350px;   LEFT:0px;   TOP:0px;   WIDTH:700px"></OBJECT>    
  <BR>  
  <HR   COLOR="#F3C905">  
  <FONT   SIZE="2"   COLOR="blue"><B>ÇëÑ¡ÔñÍ&frac14;±íÏÔÊ&frac34;·&frac12;Ê&frac12;:  
  <SELECT   NAME="select1"   LANGUAGE="javascript"   ONCHANGE="return   select1_onchange()">  
  <OPTION   value=1>¶þάֱ·&frac12;Í&frac14;</OPTION>  
  <OPTION   value=0>Èýάֱ·&frac12;Í&frac14;</OPTION>  
  <OPTION   value=3>¶þάÕÛÏßÍ&frac14;</OPTION>  
  <OPTION   value=2>ÈýάÕÛÏßÍ&frac14;</OPTION>  
  <OPTION   value=5>¶þάÃæ»ýÍ&frac14;</OPTION>  
  <OPTION   value=4>ÈýάÃæ»ýÍ&frac14;</OPTION>  
  </SELECT>  
      
  °æȨËùÓУºÉϺ£Ò×&frac12;Ü&frac14;ÆËã»ú&frac14;&frac14;ÊõÓÐÏÞ&sup1;«Ë&frac34;</B></font>  
  <HR   COLOR="#F3C905">  
  </TD></TR>  
  </TABLE>  
    
  <FORM   NAME="form1"   ID="form1">  
  <input   type="hidden"   name="chtitle"   id="chtitle"   value=""   >  
    
  <input   type="hidden"   name="ccount"     id="ccount"     value=<%=Request.Form("ccount")%>         >  
  <%for   i=1   to   Request.Form("ccount")%>  
  <input   type="hidden"   name="cname"       id="cname"       value="<%=Request.Form("cname")(i)%>">  
  <%next%>  
    
  <input   type="hidden"   name="rcount"     id="rcount"     value=<%=Request.Form("rcount")%>         >  
  <%for   i=1   to   Request.Form("rcount")%>  
  <input   type="hidden"   name="rname"       id="rname"       value="<%=Request.Form("rname")(i)%>">  
  <%next%>  
    
  <%for   i=1   to   Request.Form("rcount")*Request.Form("ccount")%>  
  <%  
  if   Request.Form("rc_data_type")=1   then  
  xvalue   =   Request.Form("rc_data1")(i)  
  end   if  
  if   Request.Form("rc_data_type")=2   then  
  xvalue   =   Request.Form("rc_data2")(i)  
  end   if  
  if   Request.Form("rc_data_type")=3   then  
  xvalue   =   Request.Form("rc_data3")(i)  
  end   if  
  %>  
  <input   type="hidden"   name="rc_data"   id="rc_data"   value=<%=xvalue%>>  
  <%next%>  
  </FORM>  
  </BODY>  
  </HTML>  
    
    
  2、饼图  
  <HTML>  
  <HEAD>  
  <META   NAME="GENERATOR"   Content="Microsoft   Visual   Studio   6.0">  
  <TITLE>   Êý&frac34;ÝÏÔÊ&frac34;Í&frac14;   </TITLE>  
  <SCRIPT   ID="clientEventHandlersJS"   LANGUAGE="javascript">  
  function   window_onload()    
  {  
  t=0;  
  mschart1.chartType   =14; //Í&frac14;ÐÎÑùÊ&frac12;£º±ýÍ&frac14;  
    
  mschart1.Title.VtFont.Size                   =10; //±êÌâ´óС£º10  
  mschart1.Title.VtFont.VtColor.Blue   =true; //±êÌâÑÕÉ«£ºÀ¶É«  
  mschart1.Title.VtFont.Style                 =1; //±êÌâÐÎÊ&frac12;£º´ÖÌ塢бÌå  
  mschart1.TitleText                                   =document.form1.chtitle.value; //±êÌâÄÚÈÝ  
    
  mschart1.Legend.VtFont.Size                       =9; //ϵÁÐÎÄ×Ö×ÖÌå´óС£º9  
  mschart1.Legend.Location.LocationType   =6; //ϵÁÐÎÄ×ÖÏÔÊ&frac34;λÖ㺵×&sup2;¿  
  mschart1.ShowLegend                                       =true; //ϵÁÐÎÄ×ÖÏÔÊ&frac34;  
    
  mschart1.Plot.Axis(0).Labels(1).VtFont.Size     =10; //XÖá´óС£º10  
  mschart1.Plot.Axis(1).Labels(1).VtFont.Size     =10; //YÖá´óС£º10  
  mschart1.Plot.Axis(2).Labels(1).VtFont.Size     =10; //ZÖá´óС£º10  
  mschart1.Plot.Axis(0).Labels(1).VtFont.Style   =1; //XÖáÐÎÊ&frac12;£º´ÖÌå  
    
  mschart1.ColumnCount   =document.form1.ccount.value; //ÿ¿éÉÏ·Ö¸îÊý  
  mschart1.RowCount         =document.form1.rcount.value; //×Ü&sup1;&sup2;¿éÊý  
    
  for   (i=0;   i<document.form1.rcount.value;   i++)  
  {  
  for   (j=0;   j<document.form1.ccount.value;   j++)  
  {    
  mschart1.Row         =i+1;  
  mschart1.Column   =j+1;  
    
  if   (document.form1.ccount.value>1)  
  {   mschart1.ColumnLabel   =document.form1.cname(j).value+"("+document.form1.rc_data(j).value+"%";    
      for   (x=1;   x<document.form1.rcount.value;   x++)  
      {   mschart1.ColumnLabel   =mschart1.ColumnLabel+",   "+document.form1.rc_data(document.form1.ccount.value*x+j).value+"%";   }  
      mschart1.ColumnLabel   =mschart1.ColumnLabel+")";  
  }  
  else  
  {   mschart1.ColumnLabel   =document.form1.cname.value;   }  
    
  if   ((document.form1.rcount.value*document.form1.ccount.value)>1)  
  {   mschart1.Data   =document.form1.rc_data(t).value;   }  
  else  
  {   mschart1.Data   =document.form1.rc_data.value;         }  
    
  t++;  
  }  
  if   (document.form1.rcount.value>1)  
  {   mschart1.RowLabel   =document.form1.rname(i).value;   }  
  else  
  {   mschart1.RowLabel   =document.form1.rname.value;         }  
  }  
  }  
    
  function   select1_onchange()    
  {  
  mschart1.chartType   =select1.value    
  mschart1.Plot  
  }  
  </SCRIPT>  
  </HEAD>  
    
  <BODY   TOPMARGIN="0"   LANGUAGE="javascript"   ONLOAD="return   window_onload()">  
  <TABLE   BGCOLOR="#EEEEEE">  
  <TR   ALIGN="center"><TD>  
  <TABLE   WIDTH=100%><TR   align=center><TD><Font   size=2   color=blue><b><%=Request.Form("chtitle")%></b></FONT></TD></TR></TABLE>  
  <HR   COLOR="#F3C905">  
  <OBJECT   CLASSID="clsid:3A2B370C-BA0A-11D1-B137-0000F8753F5D"   CODEBASE="mschart.cab"   DATA=""   ID="mschart1"   STYLE="HEIGHT:350px;   LEFT:0px;   TOP:0px;   WIDTH:750px"></OBJECT>    
  <BR>  
  <HR   COLOR="#F3C905">  
  <FONT   SIZE="2"   COLOR="blue"><B>ÇëÑ¡ÔñÍ&frac14;±íÏÔÊ&frac34;·&frac12;Ê&frac12;:  
  <SELECT   NAME="select1"   LANGUAGE="javascript"   ONCHANGE="return   select1_onchange()">  
  <OPTION   value=14>±ýÍ&frac14;</OPTION>  
  <OPTION   value=1>¶þάֱ·&frac12;Í&frac14;</OPTION>  
  <OPTION   value=0>Èýάֱ·&frac12;Í&frac14;</OPTION>  
  </SELECT>  
      
  °æȨËùÓУºÉϺ£Ò×&frac12;Ü&frac14;ÆËã»ú&frac14;&frac14;ÊõÓÐÏÞ&sup1;«Ë&frac34;</B></font>  
  <HR   COLOR="#F3C905">  
  </TD></TR>  
  </TABLE>  
    
  <FORM   NAME="form1"   ID="form1">  
  <input   type="hidden"   name="chtitle"   id="chtitle"   value=""   >  
    
  <%  
  ccount   =   Request.Form("ccount")  
  if   CInt(Request.Form("ccount"))>CInt(Request.Form("rc_data_point"))   then  
  ccount   =   Request.Form("rc_data_point")+1  
  end   if  
  %>  
  <input   type="hidden"   name="ccount"     id="ccount"     value=<%=ccount%>                                         >  
  <%for   i=1   to   Request.Form("ccount")%>  
  <%if   i=Request.Form("rc_data_point")+1   then%>  
  <input   type="hidden"   name="cname"   id="cname"   value="ÆäËû">  
  <%  
  exit   for  
      end   if  
  %>  
  <input   type="hidden"   name="cname"       id="cname"       value="<%=Request.Form("cname")(i)%>">  
  <%next%>  
    
  <input   type="hidden"   name="rcount"     id="rcount"     value="<%=Request.Form("rcount")%>"     >  
  <%for   i=1   to   Request.Form("rcount")%>  
  <input   type="hidden"   name="rname"       id="rname"       value="<%=Request.Form("rname")(i)%>">  
  <%next%>  
    
  <%rc_data_point   =   0%>  
  <%xvalue                 =   0%>  
  <%if   Request.Form("rcount")>=1   then    
      for   i=1   to   Request.Form("ccount")%>  
  <%  
  xvalue   =   xvalue   +   Request.Form("rc_data1")(i)  
    
  if   (rc_data_point<CInt(Request.Form("rc_data_point")))   or   (rc_data_point=CInt(Request.Form("ccount"))-1)   then  
  %>  
  <input   type="hidden"   name="rc_data"   id="rc_data"   value=<%=formatnumber(xvalue,2,-1)%>>  
  <%  
  xvalue   =   0  
  end   if  
    
  rc_data_point   =   rc_data_point+1  
  if   rc_data_point   mod   CInt(Request.Form("ccount"))=0   then  
  rc_data_point   =   0  
  end   if  
  %>  
  <%next  
      end   if%>  
    
  <%if   Request.Form("rcount")>=2   then    
      for   i=1   to   Request.Form("ccount")%>  
  <%  
  xvalue   =   xvalue   +   Request.Form("rc_data2")(i)  
    
  if   (rc_data_point<CInt(Request.Form("rc_data_point")))   or   (rc_data_point=CInt(Request.Form("ccount"))-1)   then  
  %>  
  <input   type="hidden"   name="rc_data"   id="rc_data"   value=<%=formatnumber(xvalue,2,-1)%>>  
  <%  
  xvalue   =   0  
  end   if  
    
  rc_data_point   =   rc_data_point+1  
  if   rc_data_point   mod   CInt(Request.Form("ccount"))=0   then  
  rc_data_point   =   0  
  end   if  
  %>  
  <%next  
      end   if%>  
    
  <%if   Request.Form("rcount")>=3   then    
      for   i=1   to   Request.Form("ccount")%>  
  <%  
  xvalue   =   xvalue   +   Request.Form("rc_data3")(i)  
    
  if   (rc_data_point<CInt(Request.Form("rc_data_point")))   or   (rc_data_point=CInt(Request.Form("ccount"))-1)   then  
  %>  
  <input   type="hidden"   name="rc_data"   id="rc_data"   value=<%=formatnumber(xvalue,2,-1)%>>  
  <%  
  xvalue   =   0  
  end   if  
    
  rc_data_point   =   rc_data_point+1  
  if   rc_data_point   mod   CInt(Request.Form("ccount"))=0   then  
  rc_data_point   =   0  
  end   if  
  %>  
  <%next  
      end   if%>  
  </FORM>  
  </BODY>  
  </HTML>  


huwlnew 2010-05-06 13:24
基本的数据绑定
一.数据源   

  说到绘制图表,可能很多人的第一反应除了是图表呈现的方式外,更关心的便是数据如何添加,记得在很多年前,哪时要绘制一个数据曲线图,一直找不到好的呈现方式,后来使用了SVG的绘图模式,不过在添加数据的时候可谓吃尽了苦头,毕竟,SVG只是一种描述语言,要动态的实现一个图表的绘制,是非常困难的.对于微软的图表控件,数据添加是一件很简单的方式,它支持多种数据添加方式,如:
  1. 可以在图表的设计界面,在属性设置窗口中的Series属性下的Points中添加需要的数据.
  2. 可以在图表的设计界面中,在属性中绑定一个数据源.
  3. 可以在后台代码中,动态添加数据.
  4. 可以在后台代码中设置一个或多个数据源,直接绑定到图表中.
  在此处,我只着重讲解一下第3,4两点.对于第3点,相对来说比较简单,在后台代码中,找到要添加代码的Series,通过它下面Points的Add、AddXY、AddY等方法,即可以实现数据的添加.例如:
[pre]Code

Code highlighting produced by Actipro CodeHighlighter (freeware)
http://www.CodeHighlighter.com/

-->double t;
            
for(t =0; t <= (2.5* Math.PI); t += Math.PI/6)
            {
                
double ch1 = Math.Sin(t);
                
double ch2 = Math.Sin(t-Math.PI/2);
                Chart1.Series[
"Channel 1"].Points.AddXY(t, ch1);
                Chart1.Series[
"Channel 2"].Points.AddXY(t, ch2);
            }
[/pre]
(注:代码摘自微软的例子,上例中,Chart1为图表的名字,Channel 1、Channel 2分别表示两个Series数据序列)
二.绑定数据
      先来看看图表控件都支持什么类型的数据绑定,根据官方文档的说法,只要是实现了IEnumerable接口的数据类型,都可以绑定到图表控件中,例如:DataView, DataReader, DataSet, DataRow, DataColumn, Array, List, SqlCommand, OleDbCommand, SqlDataAdapter, 及OleDbDataAdapter对象。
      对于开发来说,最常用的还是DataView、DataReader、DataSet、DataRow、Array、List这几种类型了,有几点需要注意一下:
  1. 图表控件支持多数据源的绑定,例如:X轴绑定一个数据集ds1,Y轴可以绑定另一个数据集ds2,当然也可以是X轴绑定到一个List数据对象,Y轴绑定到一个DataView对象等等。
  2. 图表控件的绑定方式一般有两种,常规绑定及交差表的绑定。
  3. 图表控件的Y轴数据,支持一次绑定多个值,以绘制时间、区域、使用量等之类的图形。
  绑定数据的流程如下:

   大意是,绑定数据里面是否有分组数据需要绑定,如果有,则调用交叉表绑定的方法。否则判断是否时绑定X轴和Y轴(包括标签、超链接、图例文字等自定义属性),如果是,则调用Points.DataBind方法进行绑定操作。再判断是否有不同的X轴或Y轴数据,如果有,则分别调用X,Y轴的绑定方法Points.DataBindX,Points.DataBindY进行数据绑定。最后,再判断是否需要进行多个Y轴值的绑定。
    下面分别对几种数据绑定的方法进行一下说明:
1.绑定一张数据表
  绑定一张数据表,例如绑定一张普通的数据表,表数据如下:
REPS
ID Name RegionID Sales
1 Aaron 1 10440
2 Larry 2 17772
3 Andrew 3 23880
4 Mary 1 7663
5 Sally 4 21773
6 Nguyen 2 32294
7 Francis 4 11983
8 Jerry 3 14991

绑定方法的代码:
[pre]Code

Code highlighting produced by Actipro CodeHighlighter (freeware)
http://www.CodeHighlighter.com/

-->string mySelectQuery="SELECT Name, Sales FROM REPS;";
OleDbConnection myConnection
=new OleDbConnection(myConnectionString);
OleDbCommand myCommand
=new OleDbCommand(mySelectQuery, myConnection);
myCommand.Connection.Open();
OleDbDataReader myReader
= myCommand.ExecuteReader(CommandBehavior.CloseConnection);
Chart1.DataBindTable(myReader,
"Name");
myReader.Close();
myConnection.Close();
[/pre]
因为数据源中只有两列Name和Sales,因此在调用Chart1.DataBindTable方法的时候,告诉了图表X轴的名称为Name,因此自动将Sales设置为Y轴的数据了.生成的图形如下:

如果修改一下Sql语句为:SELECT Name,ID,RegionID FROM REPS;其它都不变化,再看看图表是如何处理另外两个字段的,生成的图表如下:

此时,图表自动将ID,RegionID字段当成了Y值,生成了两个Series,因此每个用户都有两个值,生成的图形也有两个柱状图.
上面是一种动态绑定的方式,有人可能会问了,如果我想确定我要绑定的列,比如:X轴绑定某个字段,Y轴绑定某个字段如何操作呢?对于这种绑定,有几种方法可以实现.
第一种:这种方法可能是很常见的,在原来的.NET编程中出现的机率非常之高,方法如下:
[pre]Code

Code highlighting produced by Actipro CodeHighlighter (freeware)
http://www.CodeHighlighter.com/

-->// 设置数据源,myDv是一个取出数据集的DataView
    chart1.DataSource = myDv;

    
// 分别设置图表的X值和Y值
    chart1.Series["Series1"].XValueMember ="Name";
    chart1.Series[
"Series1"].YValueMembers ="Sales";

    
// 绑定设置的数据
    chart1.DataBind();
[/pre]
第二种:即直接调用点的绑定方法 
[pre]Code

Code highlighting produced by Actipro CodeHighlighter (freeware)
http://www.CodeHighlighter.com/

-->//myReader为取得的DataReader对象
Chart1.Series["Series1"].Points.DataBindXY(myReader, "Name", myReader, "Sales");
[/pre]
第三种:调用DataBind的方法实现
[pre]Code

Code highlighting produced by Actipro CodeHighlighter (freeware)
http://www.CodeHighlighter.com/

-->Chart1.Series["Series1"].Points.DataBind(myReader, "Name", "Sales", "");[/pre]
上面几种方法得到的效果都是一样的.当然了,上面三种方法需要自己建立Series,要显示两个柱状图,像上面的例子中的图形,那么得手动建立两个Series,然后分别进行上面的绑定操作。
此处说一下Label和Tooltip的绑定方式,要在绑定的图表中显示标签(Label)及提示(Tooltip),可以在绑定的时候,设置绑定的属性.对于上面的第一、二种方法,可以调用如下的方法来设置Label和Tooltip;例如,两个数据序列名称分别为Series1和Series2,设置代码如下:
[pre]Code

Code highlighting produced by Actipro CodeHighlighter (freeware)
http://www.CodeHighlighter.com/

-->Chart1.Series["Series1"].Label ="#VAL";
            Chart1.Series[
"Series1"].Points.DataBind(myDs.Tables[0].DefaultView, "Name", "ID", "");
            Chart1.Series[
"Series2"].Label ="#VAL";
            Chart1.Series[
"Series2"].Points.DataBind(myDs.Tables[0].DefaultView, "Name", "RegionID", "");[/pre]
其中的#VAL是Label和Tooltip的通配符,表示取默认Y轴变量的意思。具体的详细操作可以参考例程:Chart Features/Labels下面的内容。以后有空我也写一篇Label的和其它变量的设置吧。
对于第三种调用的绑定则稍微不同,如下:
[pre]Code

Code highlighting produced by Actipro CodeHighlighter (freeware)
http://www.CodeHighlighter.com/

-->Chart1.Series["Series1"].Points.DataBind(myDs.Tables[0].DefaultView, "Name", "ID", "Label=ID,ToolTip=RegionID");
            Chart1.Series[
"Series2"].Points.DataBind(myDs.Tables[0].DefaultView, "Name", "RegionID", "Label=RegionID,ToolTip=ID");[/pre]
其实就是利用第三个属性,通过格式化的字符串来设置绑定属性,Label表示标签,ToolTip表示提示信息,Url表示超链接等等。最后生成的图片如下:

2.绑定一个交叉表
  微软的图表控件提供了一个交叉表数据的绑定方法DataBindCrossTable,它可以根据数据动态的生成数据序列(Series),借用官方的例子,数据库的表数据如下:

REPSALES
Name Year Sales Commissions
John 2002 55676.55 2699.33
Mary 2002 44333 2299
Andrew 2002 64455.4 3636
John 2003 49884 2355
Mary 2003 52994 2487
Andrew 2003 66449 3794
John 2004 62994 3593
Mary 2004 54993 2599
Andrew 2004 78993 4852

我们先看看DataBindCrossTable的参数,它有两个重载方法,分别是:
public void DataBindCrossTable (
IEnumerable dataSource,
string seriesGroupByField,
string xField,
string yFields,
string otherFields,
PointSortOrder sortingOrder
)
以及
public void DataBindCrossTable (
IEnumerable dataSource,
string seriesGroupByField,
string xField,
string yFields,
string otherFields
)
每个参数的含义如下:
dataSource 要绑定的数据源.
seriesGroupByField 要分组统计的数据字段名称,例如按姓名、日期等.
xField X轴绑定的字段名称.
yFields Y轴绑定的字段名称,如果需要绑定多个字段,则用逗号将字段名分开.
otherFields 其它数据字段属性,就是上面刚讲的,标签、提示、Url等属性.
sortingOrder 设置数据是正确还是逆序排列.
  此时要以统计每个用户的年销售曲线,那么分组统计的字段名应该设置为Name,如下:
[pre]Code

Code highlighting produced by Actipro CodeHighlighter (freeware)
http://www.CodeHighlighter.com/

-->Chart1.DataBindCrossTable(
                myReader,
                
"Name",
                
"Year" ,
                
"Sales",
                
"Label=Commissions{C}");[/pre]
用如上的方法绑定,生成的图形如下:
 
相反,如果要统计用户每年的曲线,则将字段反转一下即可,如下:
[pre]Code

Code highlighting produced by Actipro CodeHighlighter (freeware)
http://www.CodeHighlighter.com/

-->Chart1.DataBindCrossTable(
                myReader,
                
"Year",
                
"Name",
                
"Sales",
                
"Label=Commissions{C}");[/pre]
生成的曲线图如下:

  这次就先说到这里咯,说几个需要注意的地方:
  1. 在进行Y轴数据绑定的时候,如果要绑定多个字段,默认情况会出错,那是因为需要设置Y轴的可保存值数量,设置为你需要保存的数量即可,设置的地点在:Series-》YValuesPrePoint,设置为你需要显示的个数即可。
  2. 在进行DataTable绑定的时候,Label、ToolTip等属性的字段格式化比较困难(otherFields 属性),我试了半天,也就试出了一次只能绑定一个字段,因为是和数据集绑定,如果要在标签上增加文字的话,可以使用:Field{xxxx#xxxx},其中#会替换为相应的文字,例如:Field的值为45,那么最后的呈现的结果就是:xxxx45XXXX.

posted on 2011-11-24 11:40  雨婷听雨  阅读(922)  评论(0编辑  收藏  举报

导航