Java折线图简单绘制
先不搞复杂的,就来一个最简单的功能吧!
所需实现的功能:给出一个数组,以自然数序列为横坐标,数组元素值为纵坐标,画出其折线图。
注意:只是折线图,不添加其他坐标轴标签和标题、网格等等。其实只是画折线罢了
了解Swing编程的都知道,应该是画在JPanel里面了,那么图形绘制功能由awt包的Graphics类提供,绘制函数需要JFrame对象去重写函数public void paint(Graphics g)
有了以上的铺垫,就很容易写出了。主函数来生成一个随机的序列,进行绘制测试
package plotUtils;

import java.awt.Color;
import java.awt.Graphics;
import java.util.Random;

import javax.swing.JFrame;

public class ResultPlot extends JFrame{


    private double[] y;
    private int figureHeight = 600;

    /**
     *
     */
    private static final long serialVersionUID = 1L;

    public ResultPlot(double[] y){
        super();
        this.y = y;

        setTitle("Line Draw");
        setBounds(2, 100, 1500, figureHeight);
        setVisible(true);
        setDefaultCloseOperation(JFrame.EXIT_ON_CLOSE);
    }

    @Override
    public void paint(Graphics g) {
        g.setColor(Color.red);
        int biasX = 15;
        int h = 2;
        int biasY = 100;
        g.drawLine(biasX, this.figureHeight-biasY, biasX+h*(y.length), this.figureHeight-biasY);
        g.drawLine(biasX,figureHeight-((int)y[0]+biasY), biasX+h, figureHeight-((int)y[1]+biasY));
        int x1,y1, x2, y2;
        for (int i = 1; i < y.length-1; i++) {
            x1 = biasX+h*i; y1 = figureHeight-((int)y[i]+biasY);
            x2=biasX+h*(i+1); y2=figureHeight-((int)y[i+1]+biasY);
            g.drawLine(x1, y1, x2, y2);
        }
        g.drawString("("+h*(y.length-1)+","+(int)y[y.length-1]+")", biasX+h*(y.length-1), this.figureHeight-((int)y[y.length-1]+biasY));
    }

    public static void main(String[] args) {
        double[] y = new double[700];
        Random rand = new Random();
        for (int i = 0; i < y.length; i++) {
            y[i] = rand.nextInt(200);
        }
        ResultPlot rp = new ResultPlot(y);
    }
}
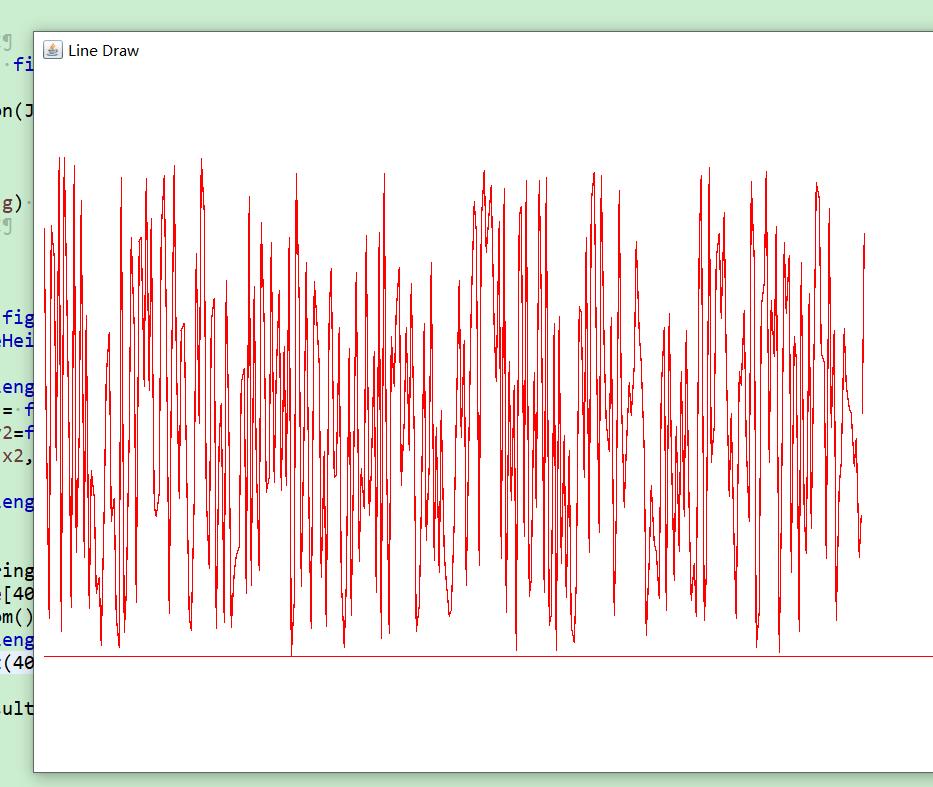
效果如下,画了700个点,效果还是很令人满意的,毕竟需要的功能已经实现了,不过还是绘制的过程挺花时间的。
显然,只要传入一个数组,就可以画出折线了,封装的还是不错的,就是功能不够多,样式不够好看。日后再添