

Python爬取天气数据
一、选题背景
天气预报我们每天都会关注,我们可以根据未来的天气增减衣物、安排出行,每天的气温、风速风向、相对湿度、空气质量等成为关注的焦点。本次使用python中requests和BeautifulSoup库对中国天气网当天和未来14天的数据进行爬取,,之后用matplotlib、numpy、pandas对数据进行可视化处理和分析,得到温湿度度变化曲线、空气质量图、风向雷达图等结果,为获得未来天气信息提供了有效方法。
二、主题式网络爬虫设计方案
1.主题式网络爬虫名称
Python爬虫——爬取天气数据
2.主题式网络爬虫爬取的内容与数据特征分析
爬取近七天天气并对数据进行数据可视化处理
3.主题式网络爬虫设计方案概述
首先查看中国天气网的网址,采用requests.get()方法,请求网页,然后提取有用信息,采用BeautifulSoup库对刚刚获取的字符串进行数据提取,接着将爬取的数据添加到列表中,最后进行数据可视化分析。
三、主题页面的结构特征分析
1.主题页面的结构与特征分析
爬取页面:
http://www.weather.com.cn/weather/101280701.shtml
这里采用BeautifulSoup库对刚刚获取的字符串进行数据提取,首先对网页进行检查,找到需要获取数据的标签
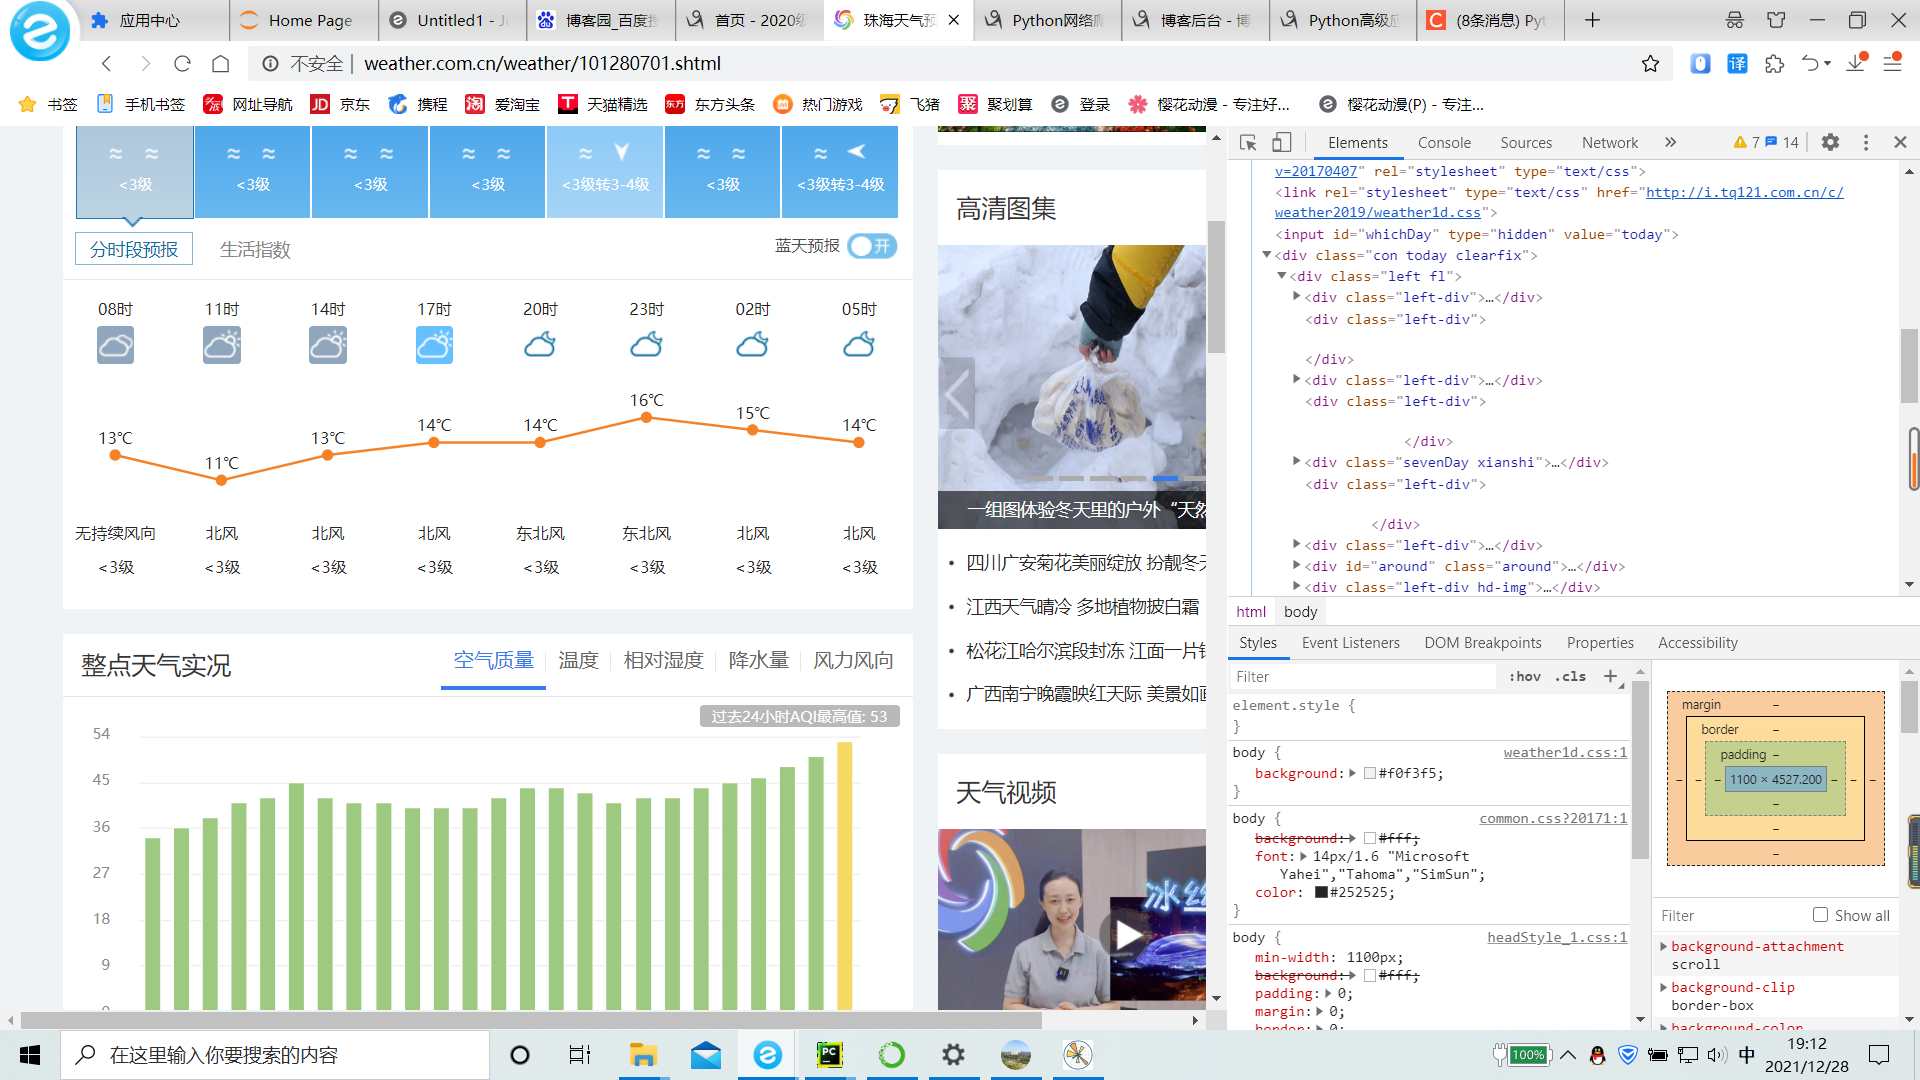
2.Htmls 页面解析
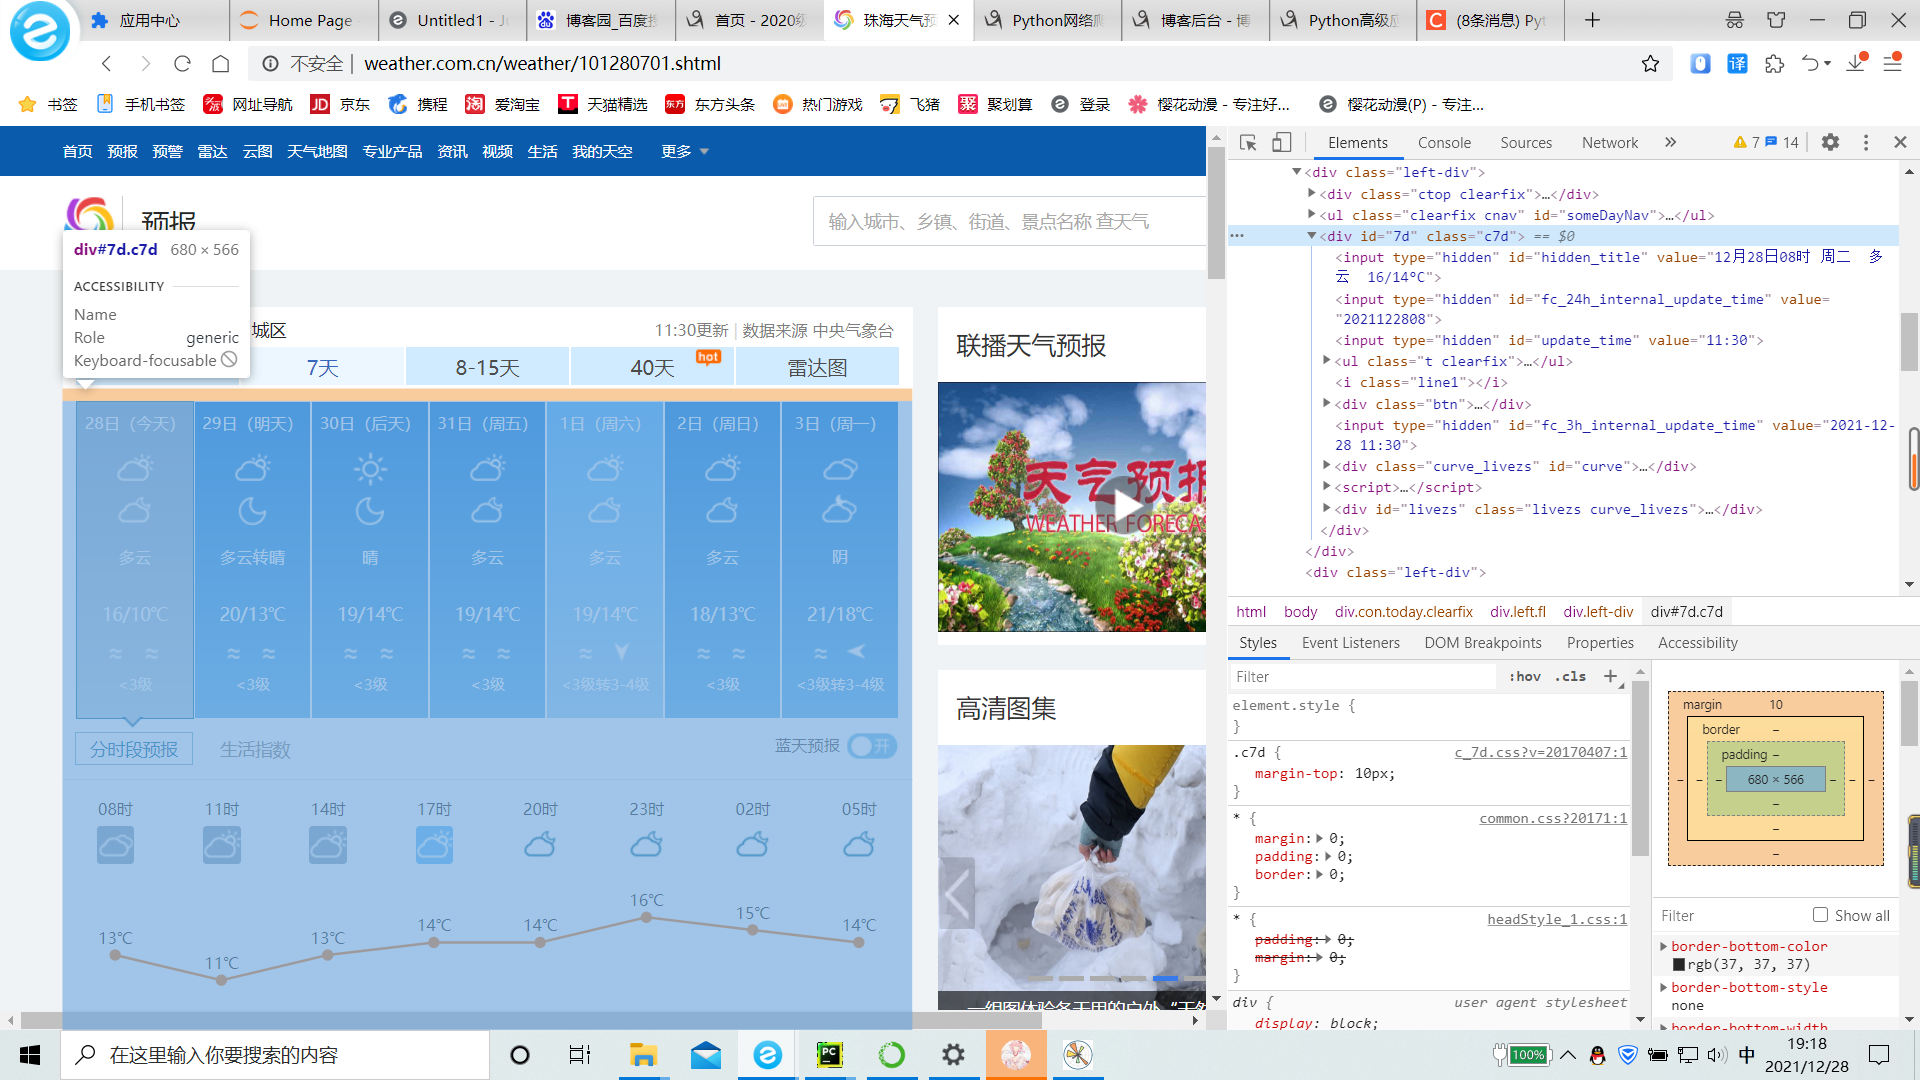
3.节点(标签)查找方法与遍历方法
可以发现7天的数据信息在div标签中并且id=“7d”,并且日期、天气、温度、风级等信息都在ul和li标签中,使用BeautifulSoup对获取的网页文本进行查找div标签id=“7d”,找出他包含的所有的ul和li标签,之后提取标签中相应的数据值,保存到对应列表中。
四、网络爬虫程序设计
1、数据爬取与采集

 1 import requests
 2 from bs4 import BeautifulSoup
 3
 4
 5 def getHTMLText(url, timeout=30):
 6     try:
 7         r = requests.get(url, timeout=30)  # 用requests抓取网页信息
 8         r.raise_for_status()  # 可以让程序产生异常时停止程序
 9         r.encoding = r.apparent_encoding
10         return r.text
11     except:
12         return '产生异常'
13
14
15 def get_data(html):
16     final_list = []
17     soup = BeautifulSoup(html, 'html.parser')  # 用BeautifulSoup库解析网页
18     body = soup.body
19     data = body.find('div', {'id': '7d'})
20     ul = data.find('ul')
21     lis = ul.find_all('li')
22
23     for day in lis:
24         temp_list = []
25
26         date = day.find('h1').string  # 找到日期
27         temp_list.append(date)
28
29         info = day.find_all('p')  # 找到所有的p标签
30         temp_list.append(info[0].string)
31
32         if info[1].find('span') is None:  # 找到p标签中的第二个值'span'标签——最高温度
33             temperature_highest = ' '  # 用一个判断是否有最高温度
34         else:
35             temperature_highest = info[1].find('span').string
36             temperature_highest = temperature_highest.replace('℃', ' ')
37
38         if info[1].find('i') is None:  # 找到p标签中的第二个值'i'标签——最高温度
39             temperature_lowest = ' '  # 用一个判断是否有最低温度
40         else:
41             temperature_lowest = info[1].find('i').string
42             temperature_lowest = temperature_lowest.replace('℃', ' ')
43
44         temp_list.append(temperature_highest)  # 将最高气温添加到temp_list中
45         temp_list.append(temperature_lowest)  # 将最低气温添加到temp_list中
46
47         wind_scale = info[2].find('i').string  # 找到p标签的第三个值'i'标签——风级,添加到temp_list中
48         temp_list.append(wind_scale)
49
50         final_list.append(temp_list)  # 将temp_list列表添加到final_list列表中
51     return final_list
52
53
54 # 用format()将结果打印输出
55 def print_data(final_list, num):
56     print("{:^10}\t{:^8}\t{:^8}\t{:^8}\t{:^8}".format('日期', '天气', '最高温度', '最低温度', '风级'))
57     for i in range(num):
58         final = final_list[i]
59         print("{:^10}\t{:^8}\t{:^8}\t{:^8}\t{:^8}".format(final[0], final[1], final[2], final[3], final[4]))
60
61
62 # 用main()主函数将模块连接
63 def main():
64     url = 'http://www.weather.com.cn/weather/101280701.shtml'
65     html = getHTMLText(url)
66     final_list = get_data(html)
67     print_data(final_list, 7)
68
69
70 main()
运行结果: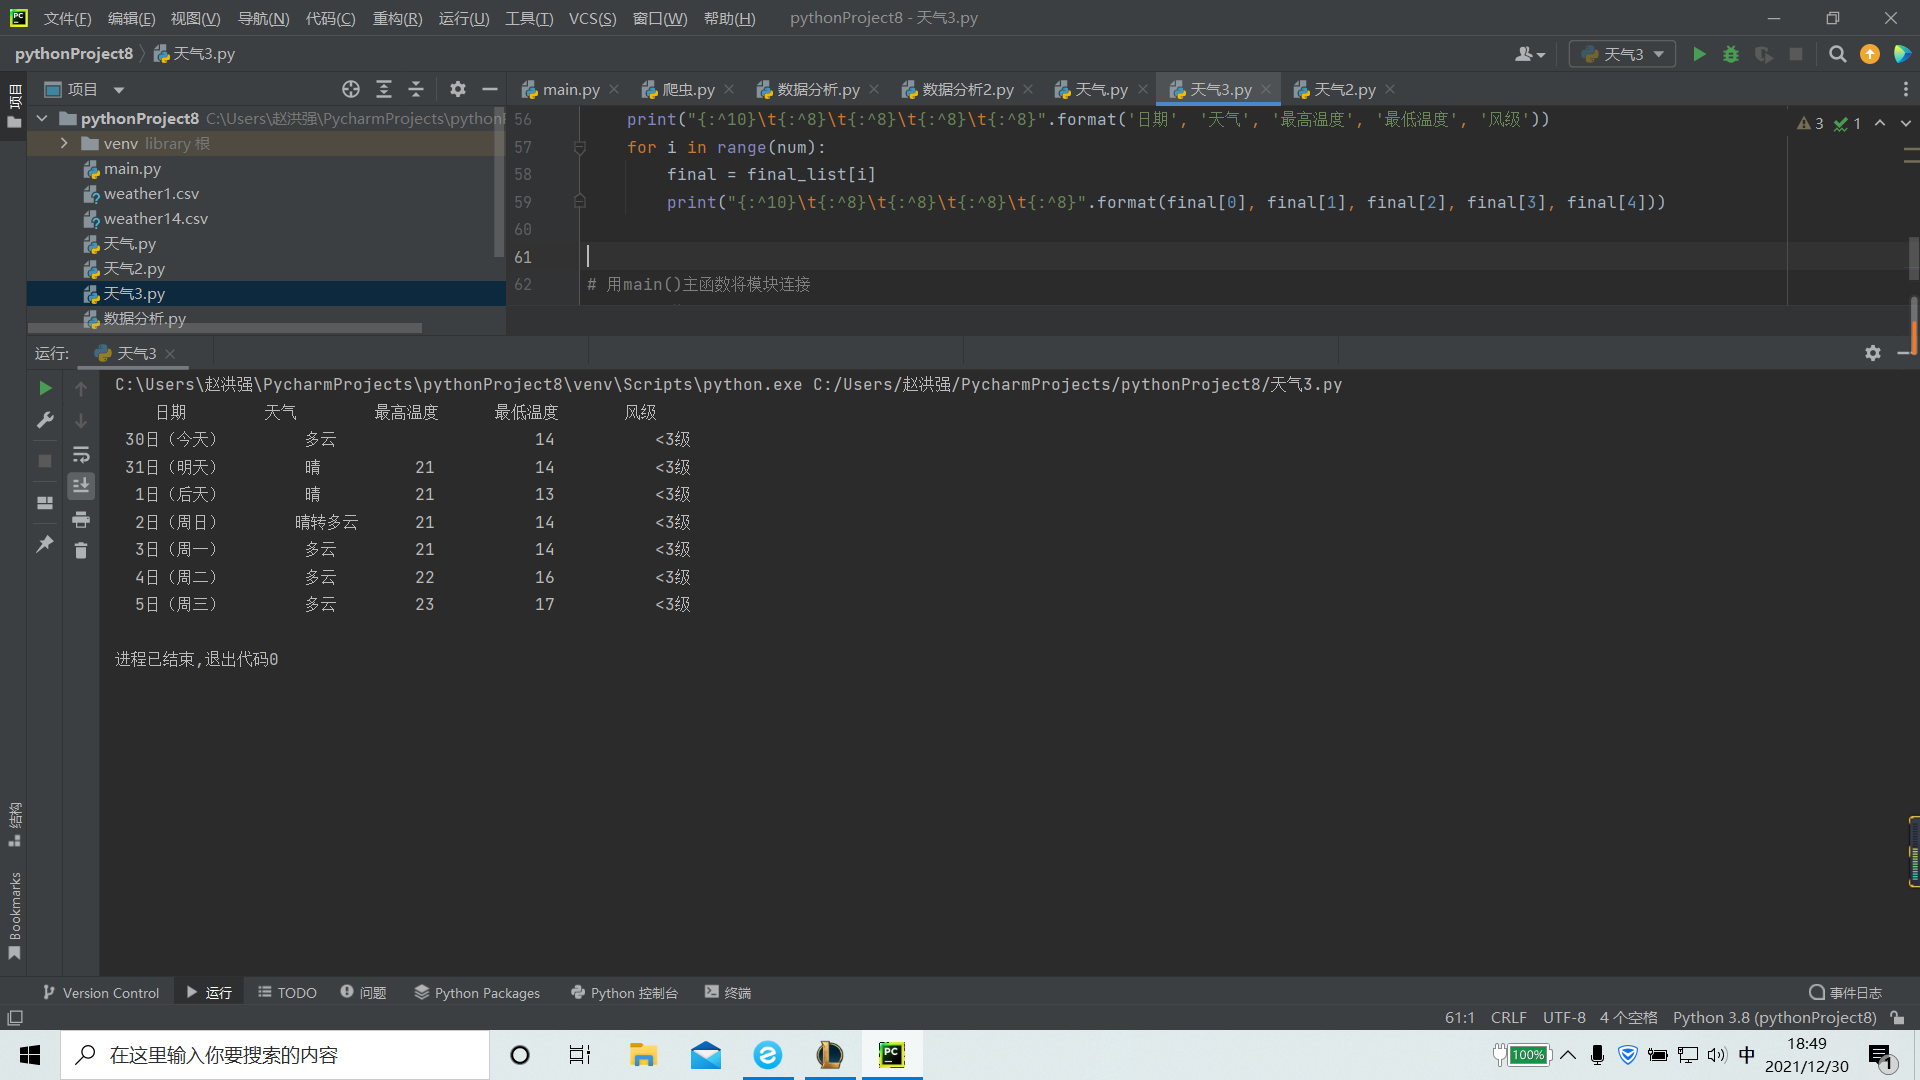
2、数据分析与可视化
(1)当天数据分析
  1 # data1_analysis.py
  2 import matplotlib.pyplot as plt
  3 import numpy as np
  4 import pandas as pd
  5 import math
  6
  7
  8 def tem_curve(data):
  9     """温度曲线绘制"""
 10     hour = list(data['小时'])
 11     tem = list(data['温度'])
 12     for i in range(0, 24):
 13         if math.isnan(tem[i]) == True:
 14             tem[i] = tem[i - 1]
 15     tem_ave = sum(tem) / 24  # 求平均温度
 16     tem_max = max(tem)
 17     tem_max_hour = hour[tem.index(tem_max)]  # 求最高温度
 18     tem_min = min(tem)
 19     tem_min_hour = hour[tem.index(tem_min)]  # 求最低温度
 20     x = []
 21     y = []
 22     for i in range(0, 24):
 23         x.append(i)
 24         y.append(tem[hour.index(i)])
 25     plt.figure(1)
 26     plt.plot(x, y, color='red', label='温度')  # 画出温度曲线
 27     plt.scatter(x, y, color='red')  # 点出每个时刻的温度点
 28     plt.plot([0, 24], [tem_ave, tem_ave], c='blue', linestyle='--', label='平均温度')  # 画出平均温度虚线
 29     plt.text(tem_max_hour + 0.15, tem_max + 0.15, str(tem_max), ha='center', va='bottom', fontsize=10.5)  # 标出最高温度
 30     plt.text(tem_min_hour + 0.15, tem_min + 0.15, str(tem_min), ha='center', va='bottom', fontsize=10.5)  # 标出最低温度
 31     plt.xticks(x)
 32     plt.legend()
 33     plt.title('一天温度变化曲线图')
 34     plt.xlabel('时间/h')
 35     plt.ylabel('摄氏度/℃')
 36     plt.show()
 37
 38
 39 def hum_curve(data):
 40     """相对湿度曲线绘制"""
 41     hour = list(data['小时'])
 42     hum = list(data['相对湿度'])
 43     for i in range(0, 24):
 44         if math.isnan(hum[i]) == True:
 45             hum[i] = hum[i - 1]
 46     hum_ave = sum(hum) / 24  # 求平均相对湿度
 47     hum_max = max(hum)
 48     hum_max_hour = hour[hum.index(hum_max)]  # 求最高相对湿度
 49     hum_min = min(hum)
 50     hum_min_hour = hour[hum.index(hum_min)]  # 求最低相对湿度
 51     x = []
 52     y = []
 53     for i in range(0, 24):
 54         x.append(i)
 55         y.append(hum[hour.index(i)])
 56     plt.figure(2)
 57     plt.plot(x, y, color='blue', label='相对湿度')  # 画出相对湿度曲线
 58     plt.scatter(x, y, color='blue')  # 点出每个时刻的相对湿度
 59     plt.plot([0, 24], [hum_ave, hum_ave], c='red', linestyle='--', label='平均相对湿度')  # 画出平均相对湿度虚线
 60     plt.text(hum_max_hour + 0.15, hum_max + 0.15, str(hum_max), ha='center', va='bottom', fontsize=10.5)  # 标出最高相对湿度
 61     plt.text(hum_min_hour + 0.15, hum_min + 0.15, str(hum_min), ha='center', va='bottom', fontsize=10.5)  # 标出最低相对湿度
 62     plt.xticks(x)
 63     plt.legend()
 64     plt.title('一天相对湿度变化曲线图')
 65     plt.xlabel('时间/h')
 66     plt.ylabel('百分比/%')
 67     plt.show()
 68
 69
 70 def air_curve(data):
 71     """空气质量曲线绘制"""
 72     hour = list(data['小时'])
 73     air = list(data['空气质量'])
 74     print(type(air[0]))
 75     for i in range(0, 24):
 76         if math.isnan(air[i]) == True:
 77             air[i] = air[i - 1]
 78     air_ave = sum(air) / 24  # 求平均空气质量
 79     air_max = max(air)
 80     air_max_hour = hour[air.index(air_max)]  # 求最高空气质量
 81     air_min = min(air)
 82     air_min_hour = hour[air.index(air_min)]  # 求最低空气质量
 83     x = []
 84     y = []
 85     for i in range(0, 24):
 86         x.append(i)
 87         y.append(air[hour.index(i)])
 88     plt.figure(3)
 89
 90     for i in range(0, 24):
 91         if y[i] <= 50:
 92             plt.bar(x[i], y[i], color='lightgreen', width=0.7)  # 1等级
 93         elif y[i] <= 100:
 94             plt.bar(x[i], y[i], color='wheat', width=0.7)  # 2等级
 95         elif y[i] <= 150:
 96             plt.bar(x[i], y[i], color='orange', width=0.7)  # 3等级
 97         elif y[i] <= 200:
 98             plt.bar(x[i], y[i], color='orangered', width=0.7)  # 4等级
 99         elif y[i] <= 300:
100             plt.bar(x[i], y[i], color='darkviolet', width=0.7)  # 5等级
101         elif y[i] > 300:
102             plt.bar(x[i], y[i], color='maroon', width=0.7)  # 6等级
103     plt.plot([0, 24], [air_ave, air_ave], c='black', linestyle='--')  # 画出平均空气质量虚线
104     plt.text(air_max_hour + 0.15, air_max + 0.15, str(air_max), ha='center', va='bottom', fontsize=10.5)  # 标出最高空气质量
105     plt.text(air_min_hour + 0.15, air_min + 0.15, str(air_min), ha='center', va='bottom', fontsize=10.5)  # 标出最低空气质量
106     plt.xticks(x)
107     plt.title('一天空气质量变化曲线图')
108     plt.xlabel('时间/h')
109     plt.ylabel('空气质量指数AQI')
110     plt.show()
111
112
113 def wind_radar(data):
114     """风向雷达图"""
115     wind = list(data['风力方向'])
116     wind_speed = list(data['风级'])
117     for i in range(0, 24):
118         if wind[i] == "北风":
119             wind[i] = 90
120         elif wind[i] == "南风":
121             wind[i] = 270
122         elif wind[i] == "西风":
123             wind[i] = 180
124         elif wind[i] == "东风":
125             wind[i] = 360
126         elif wind[i] == "东北风":
127             wind[i] = 45
128         elif wind[i] == "西北风":
129             wind[i] = 135
130         elif wind[i] == "西南风":
131             wind[i] = 225
132         elif wind[i] == "东南风":
133             wind[i] = 315
134     degs = np.arange(45, 361, 45)
135     temp = []
136     for deg in degs:
137         speed = []
138         # 获取 wind_deg 在指定范围的风速平均值数据
139         for i in range(0, 24):
140             if wind[i] == deg:
141                 speed.append(wind_speed[i])
142         if len(speed) == 0:
143             temp.append(0)
144         else:
145             temp.append(sum(speed) / len(speed))
146     print(temp)
147     N = 8
148     theta = np.arange(0. + np.pi / 8, 2 * np.pi + np.pi / 8, 2 * np.pi / 8)
149     # 数据极径
150     radii = np.array(temp)
151     # 绘制极区图坐标系
152     plt.axes(polar=True)
153     # 定义每个扇区的RGB值(R,G,B),x越大,对应的颜色越接近蓝色
154     colors = [(1 - x / max(temp), 1 - x / max(temp), 0.6) for x in radii]
155     plt.bar(theta, radii, width=(2 * np.pi / N), bottom=0.0, color=colors)
156     plt.title('一天风级图', x=0.2, fontsize=20)
157     plt.show()
158
159
160 def calc_corr(a, b):
161     """计算相关系数"""
162     a_avg = sum(a) / len(a)
163     b_avg = sum(b) / len(b)
164     cov_ab = sum([(x - a_avg) * (y - b_avg) for x, y in zip(a, b)])
165     sq = math.sqrt(sum([(x - a_avg) ** 2 for x in a]) * sum([(x - b_avg) ** 2 for x in b]))
166     corr_factor = cov_ab / sq
167     return corr_factor
168
169
170 def corr_tem_hum(data):
171     """温湿度相关性分析"""
172     tem = data['温度']
173     hum = data['相对湿度']
174     plt.scatter(tem, hum, color='blue')
175     plt.title("温湿度相关性分析图")
176     plt.xlabel("温度/℃")
177     plt.ylabel("相对湿度/%")
178     plt.text(20, 40, "相关系数为:" + str(calc_corr(tem, hum)), fontdict={'size': '10', 'color': 'red'})
179     plt.show()
180     print("相关系数为:" + str(calc_corr(tem, hum)))
181
182
183 def main():
184     plt.rcParams['font.sans-serif'] = ['SimHei']  # 解决中文显示问题
185     plt.rcParams['axes.unicode_minus'] = False  # 解决负号显示问题
186     data1 = pd.read_csv('weather1.csv', encoding='gb2312')
187     print(data1)
188     tem_curve(data1)
189     hum_curve(data1)
190     air_curve(data1)
191     wind_radar(data1)
192     corr_tem_hum(data1)
193
194
195 if __name__ == '__main__':
196     main()
输出结果:1.当天温度变化曲线图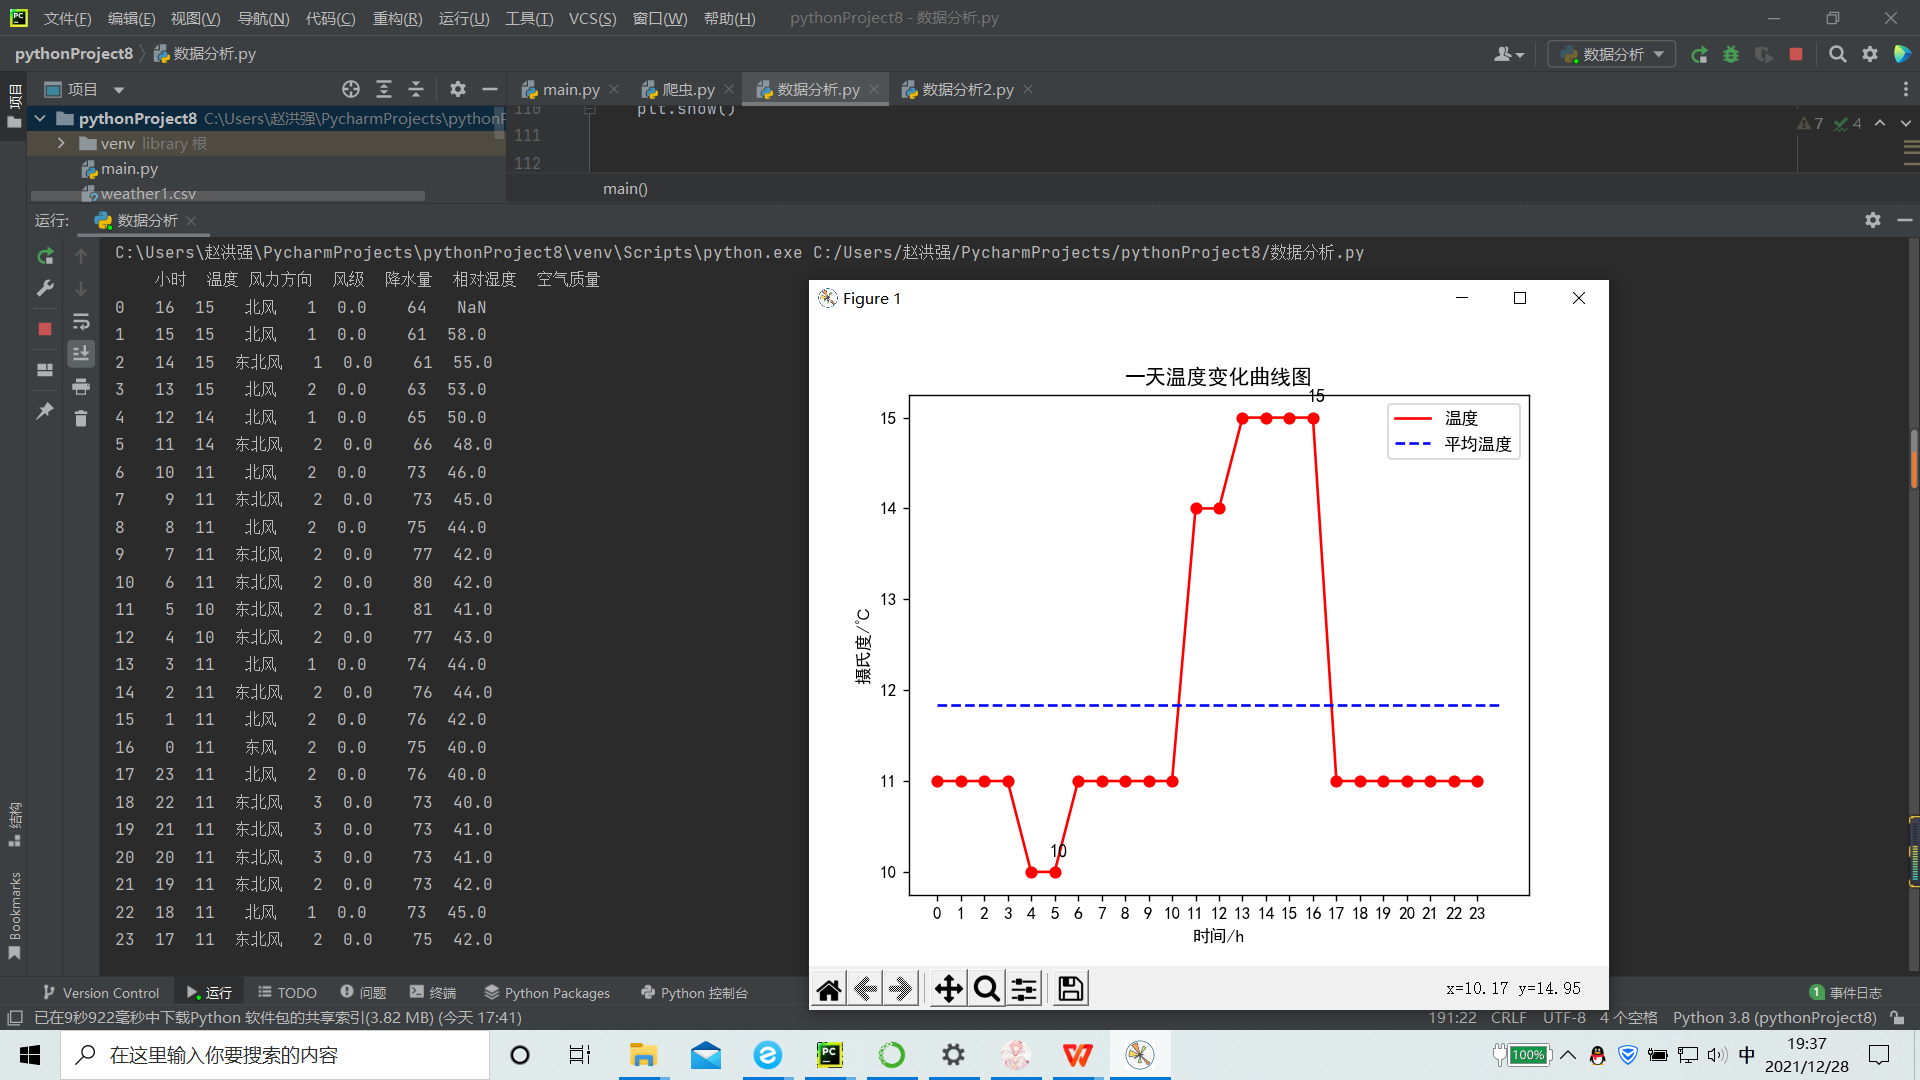
2.相对湿度变化曲线图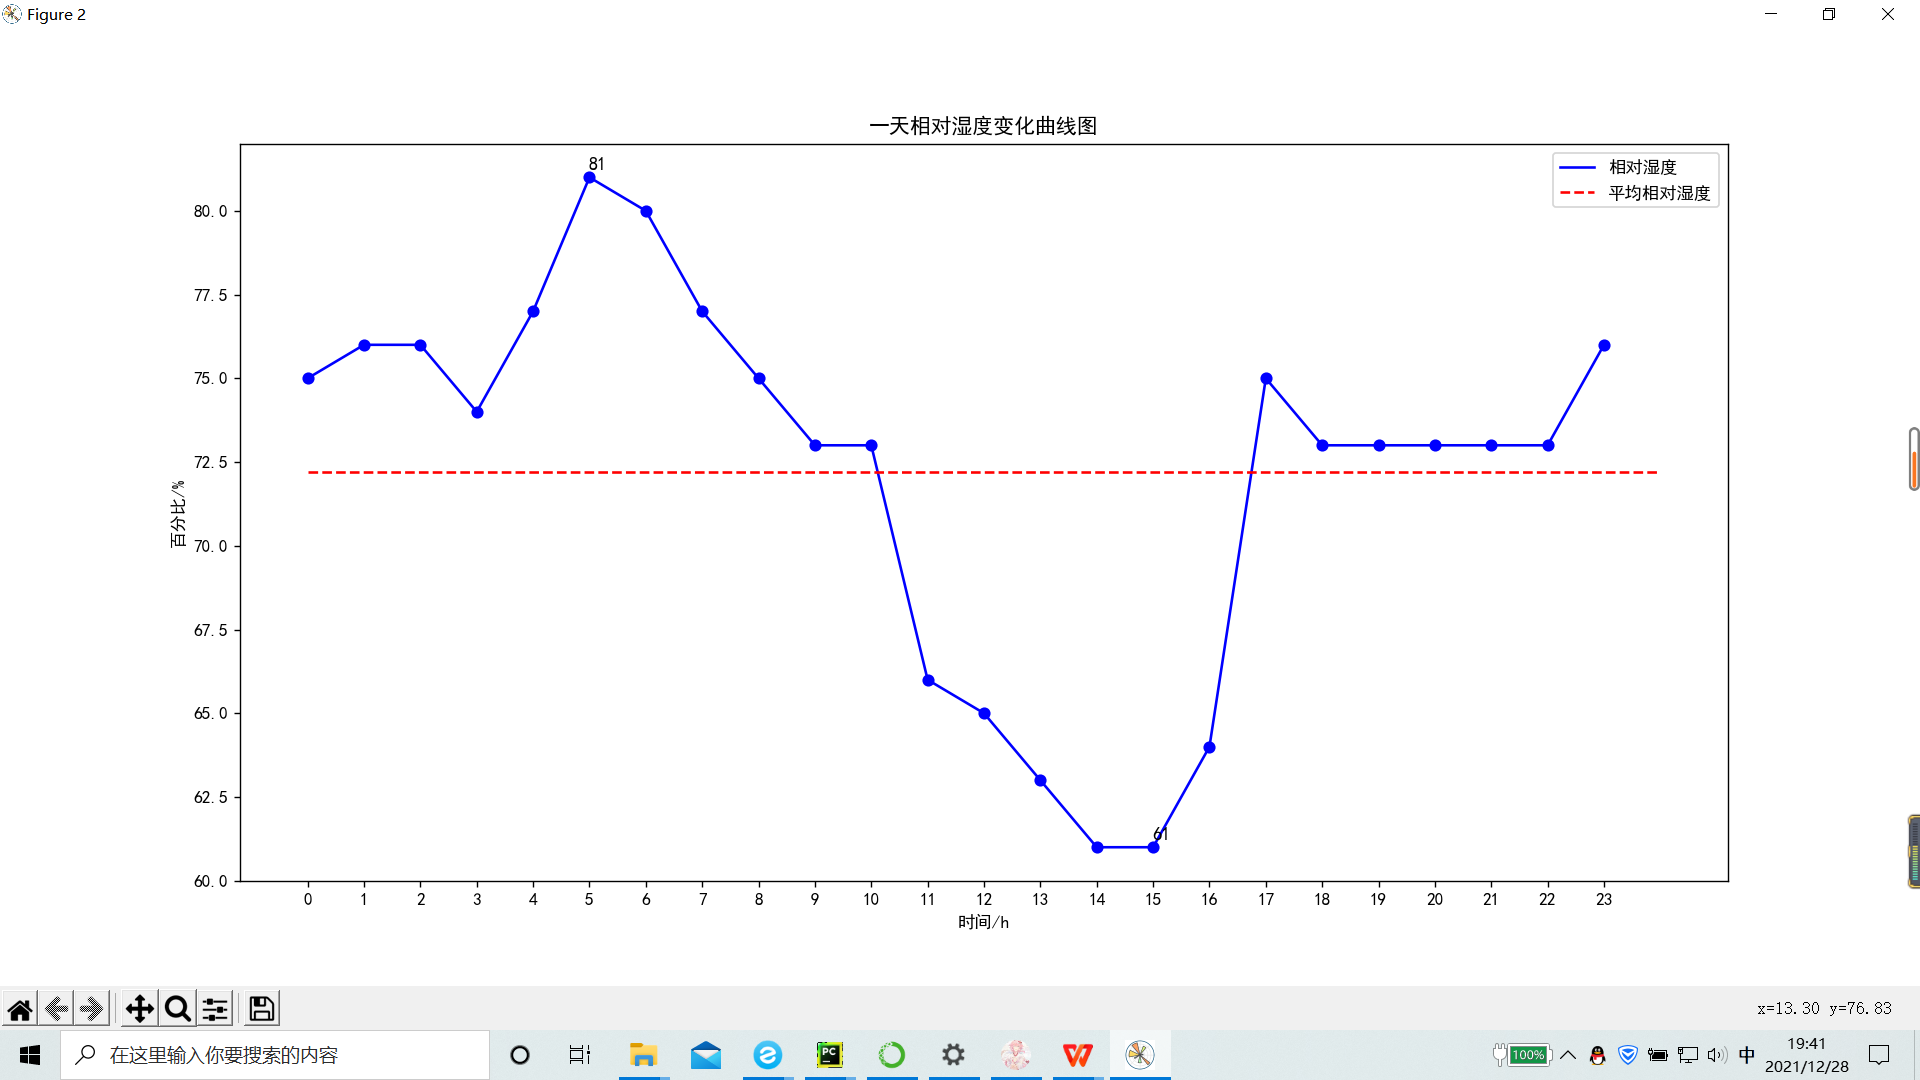
3.空气质量变化曲线图

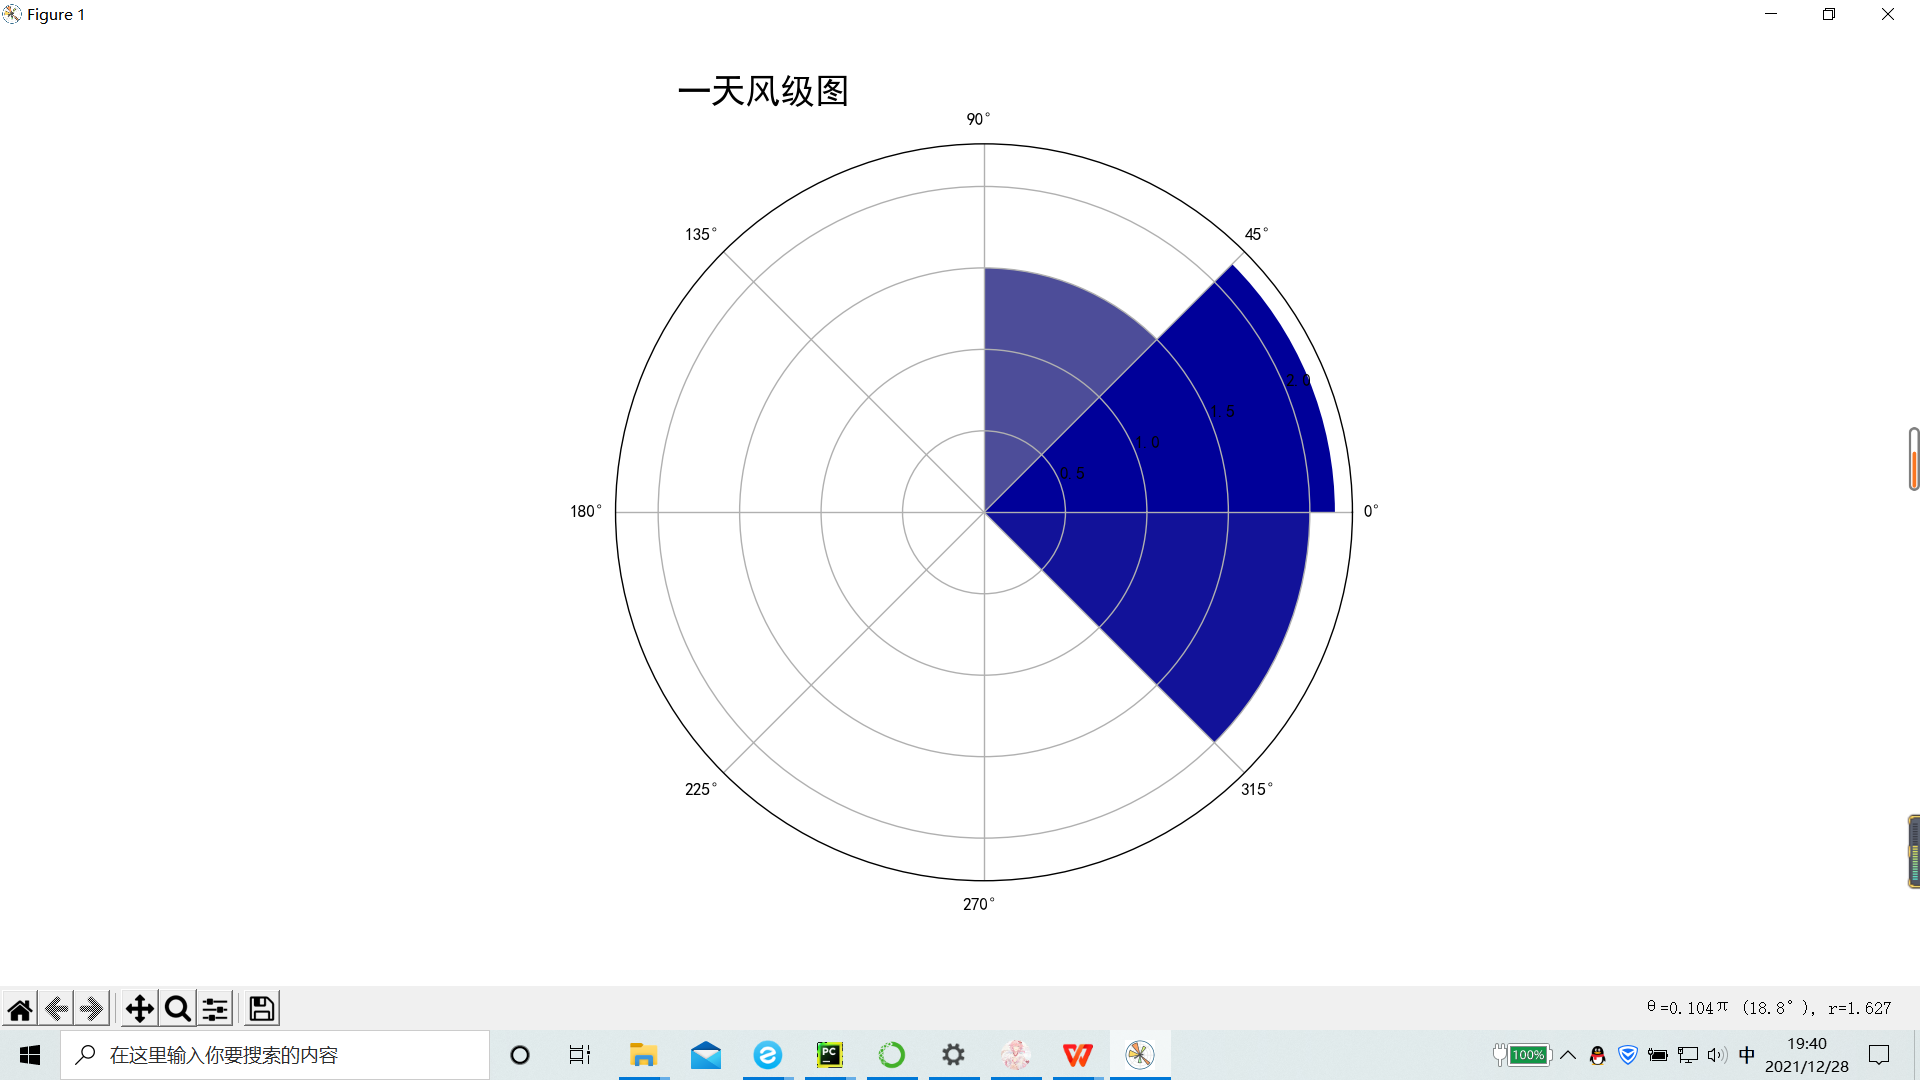
4.风级图
5.温度湿度分析图
(2)未来14天数据分析
  1 # data14_analysis.py
  2 import matplotlib.pyplot as plt
  3 import numpy as np
  4 import pandas as pd
  5 import math
  6
  7
  8 def tem_curve(data):
  9     """温度曲线绘制"""
 10     date = list(data['日期'])
 11     tem_low = list(data['最低气温'])
 12     tem_high = list(data['最高气温'])
 13     for i in range(0, 14):
 14         if math.isnan(tem_low[i]) == True:
 15             tem_low[i] = tem_low[i - 1]
 16         if math.isnan(tem_high[i]) == True:
 17             tem_high[i] = tem_high[i - 1]
 18
 19     tem_high_ave = sum(tem_high) / 14  # 求平均高温
 20     tem_low_ave = sum(tem_low) / 14  # 求平均低温
 21
 22     tem_max = max(tem_high)
 23     tem_max_date = tem_high.index(tem_max)  # 求最高温度
 24     tem_min = min(tem_low)
 25     tem_min_date = tem_low.index(tem_min)  # 求最低温度
 26
 27     x = range(1, 15)
 28     plt.figure(1)
 29     plt.plot(x, tem_high, color='red', label='高温')  # 画出高温度曲线
 30     plt.scatter(x, tem_high, color='red')  # 点出每个时刻的温度点
 31     plt.plot(x, tem_low, color='blue', label='低温')  # 画出低温度曲线
 32     plt.scatter(x, tem_low, color='blue')  # 点出每个时刻的温度点
 33
 34     plt.plot([1, 15], [tem_high_ave, tem_high_ave], c='black', linestyle='--')  # 画出平均温度虚线
 35     plt.plot([1, 15], [tem_low_ave, tem_low_ave], c='black', linestyle='--')  # 画出平均温度虚线
 36     plt.legend()
 37     plt.text(tem_max_date + 0.15, tem_max + 0.15, str(tem_max), ha='center', va='bottom', fontsize=10.5)  # 标出最高温度
 38     plt.text(tem_min_date + 0.15, tem_min + 0.15, str(tem_min), ha='center', va='bottom', fontsize=10.5)  # 标出最低温度
 39     plt.xticks(x)
 40     plt.title('未来14天高温低温变化曲线图')
 41     plt.xlabel('未来天数/天')
 42     plt.ylabel('摄氏度/℃')
 43     plt.show()
 44
 45
 46 def change_wind(wind):
 47     """改变风向"""
 48     for i in range(0, 14):
 49         if wind[i] == "北风":
 50             wind[i] = 90
 51         elif wind[i] == "南风":
 52             wind[i] = 270
 53         elif wind[i] == "西风":
 54             wind[i] = 180
 55         elif wind[i] == "东风":
 56             wind[i] = 360
 57         elif wind[i] == "东北风":
 58             wind[i] = 45
 59         elif wind[i] == "西北风":
 60             wind[i] = 135
 61         elif wind[i] == "西南风":
 62             wind[i] = 225
 63         elif wind[i] == "东南风":
 64             wind[i] = 315
 65     return wind
 66
 67
 68 def wind_radar(data):
 69     """风向雷达图"""
 70     wind1 = list(data['风向1'])
 71     wind2 = list(data['风向2'])
 72     wind_speed = list(data['风级'])
 73     wind1 = change_wind(wind1)
 74     wind2 = change_wind(wind2)
 75
 76     degs = np.arange(45, 361, 45)
 77     temp = []
 78     for deg in degs:
 79         speed = []
 80         # 获取 wind_deg 在指定范围的风速平均值数据
 81         for i in range(0, 14):
 82             if wind1[i] == deg:
 83                 speed.append(wind_speed[i])
 84             if wind2[i] == deg:
 85                 speed.append(wind_speed[i])
 86         if len(speed) == 0:
 87             temp.append(0)
 88         else:
 89             temp.append(sum(speed) / len(speed))
 90     print(temp)
 91     N = 8
 92     theta = np.arange(0. + np.pi / 8, 2 * np.pi + np.pi / 8, 2 * np.pi / 8)
 93     # 数据极径
 94     radii = np.array(temp)
 95     # 绘制极区图坐标系
 96     plt.axes(polar=True)
 97     # 定义每个扇区的RGB值(R,G,B),x越大,对应的颜色越接近蓝色
 98     colors = [(1 - x / max(temp), 1 - x / max(temp), 0.6) for x in radii]
 99     plt.bar(theta, radii, width=(2 * np.pi / N), bottom=0.0, color=colors)
100     plt.title('未来14天风级图', x=0.2, fontsize=20)
101     plt.show()
102
103
104 def weather_pie(data):
105     """绘制天气饼图"""
106     weather = list(data['天气'])
107     dic_wea = {}
108     for i in range(0, 14):
109         if weather[i] in dic_wea.keys():
110             dic_wea[weather[i]] += 1
111         else:
112             dic_wea[weather[i]] = 1
113     print(dic_wea)
114     explode = [0.01] * len(dic_wea.keys())
115     color = ['lightskyblue', 'silver', 'yellow', 'salmon', 'grey', 'lime', 'gold', 'red', 'green', 'pink']
116     plt.pie(dic_wea.values(), explode=explode, labels=dic_wea.keys(), autopct='%1.1f%%', colors=color)
117     plt.title('未来14天气候分布饼图')
118     plt.show()
119
120
121 def main():
122     plt.rcParams['font.sans-serif'] = ['SimHei']  # 解决中文显示问题
123     plt.rcParams['axes.unicode_minus'] = False  # 解决负号显示问题
124     data14 = pd.read_csv('weather14.csv', encoding='gb2312')
125     print(data14)
126     tem_curve(data14)
127     wind_radar(data14)
128     weather_pie(data14)
129
130
131 if __name__ == '__main__':
132     main()
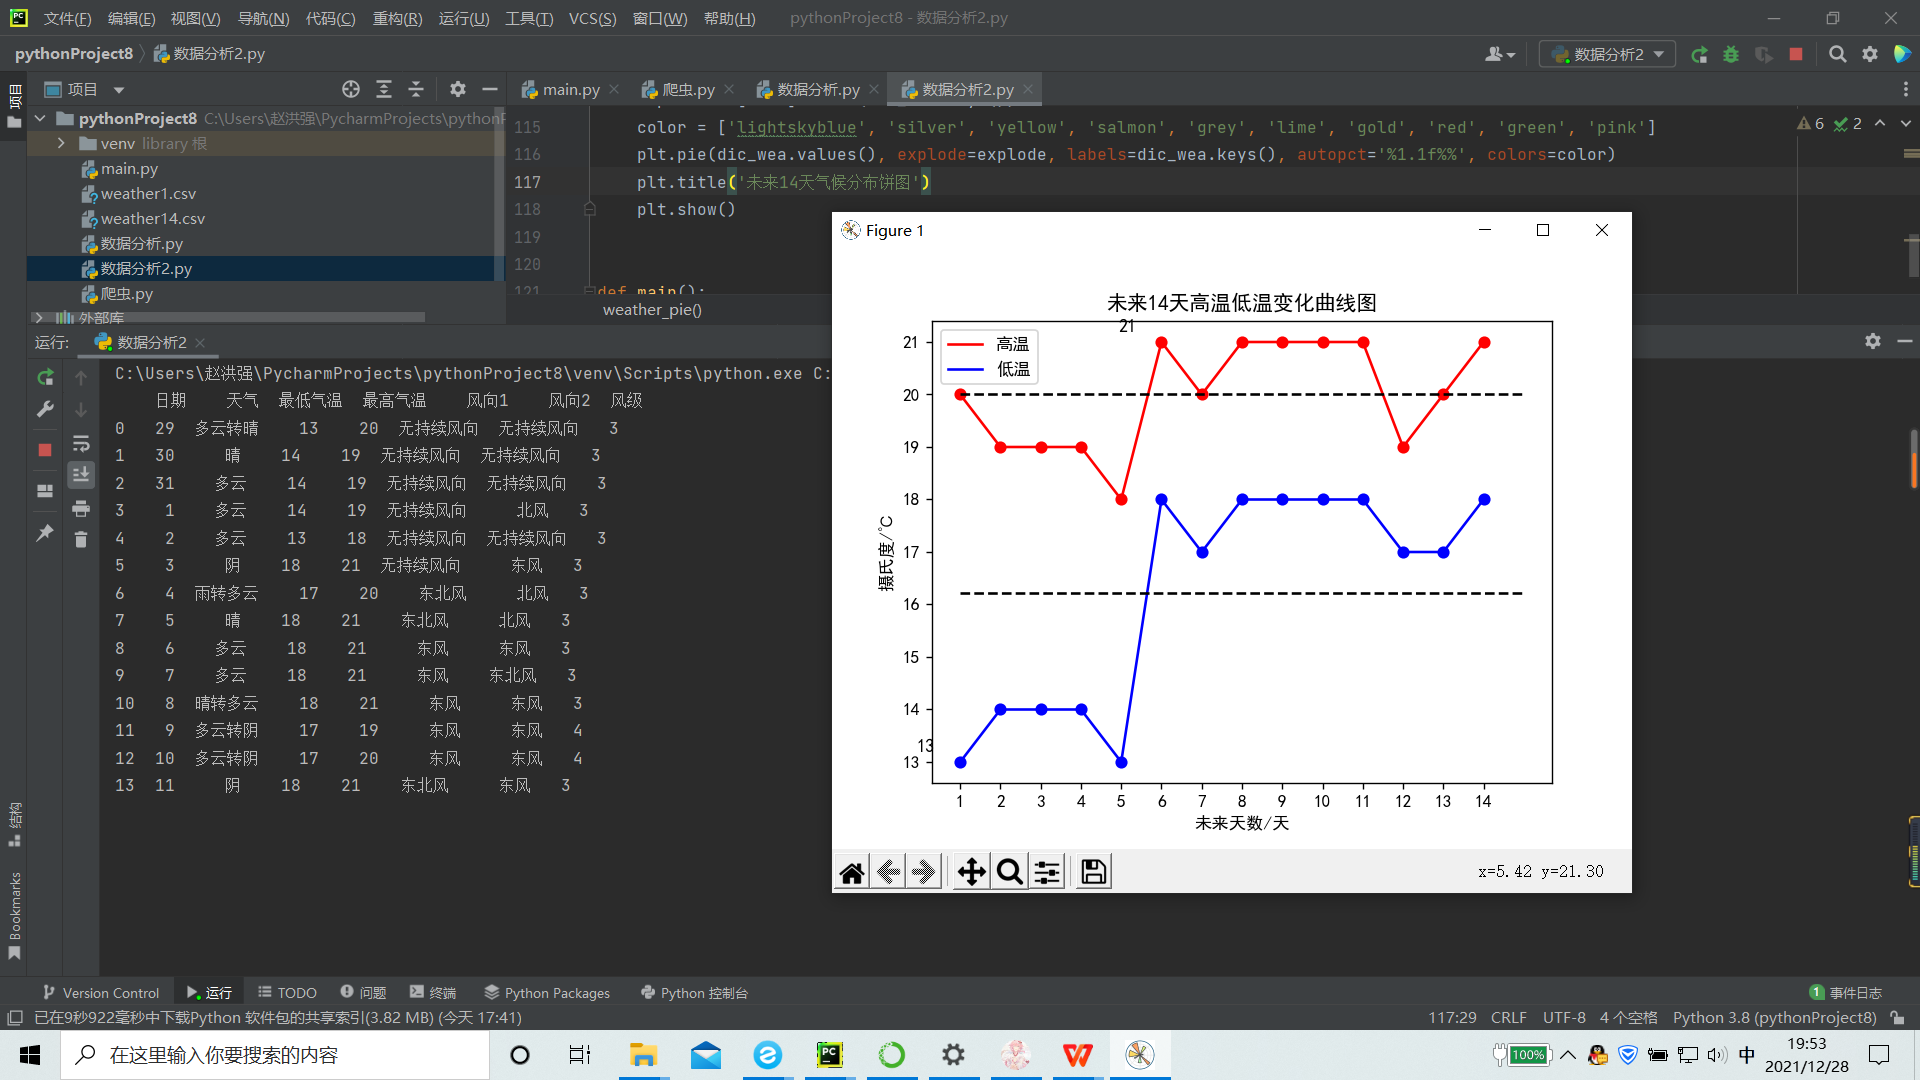
输出结果:1.未来14天气温变化曲线图
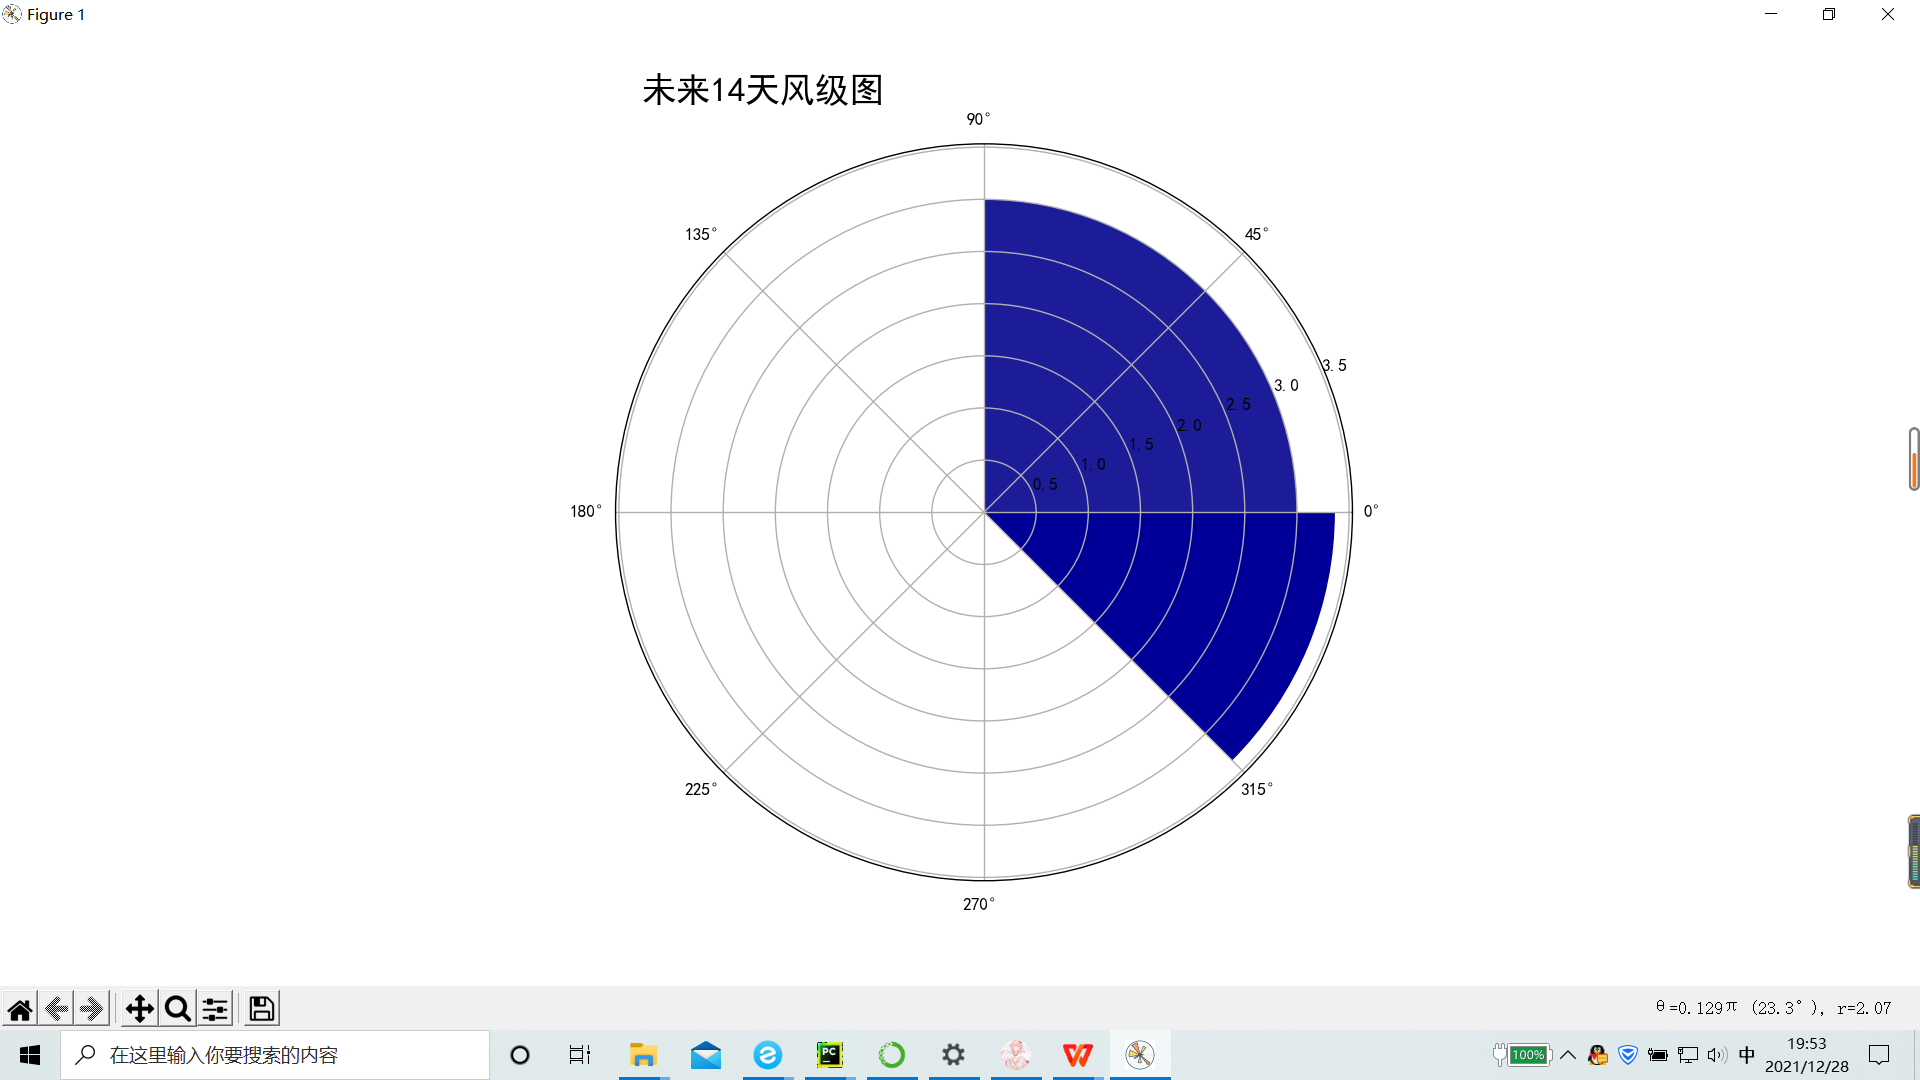
2.未来14天风级图
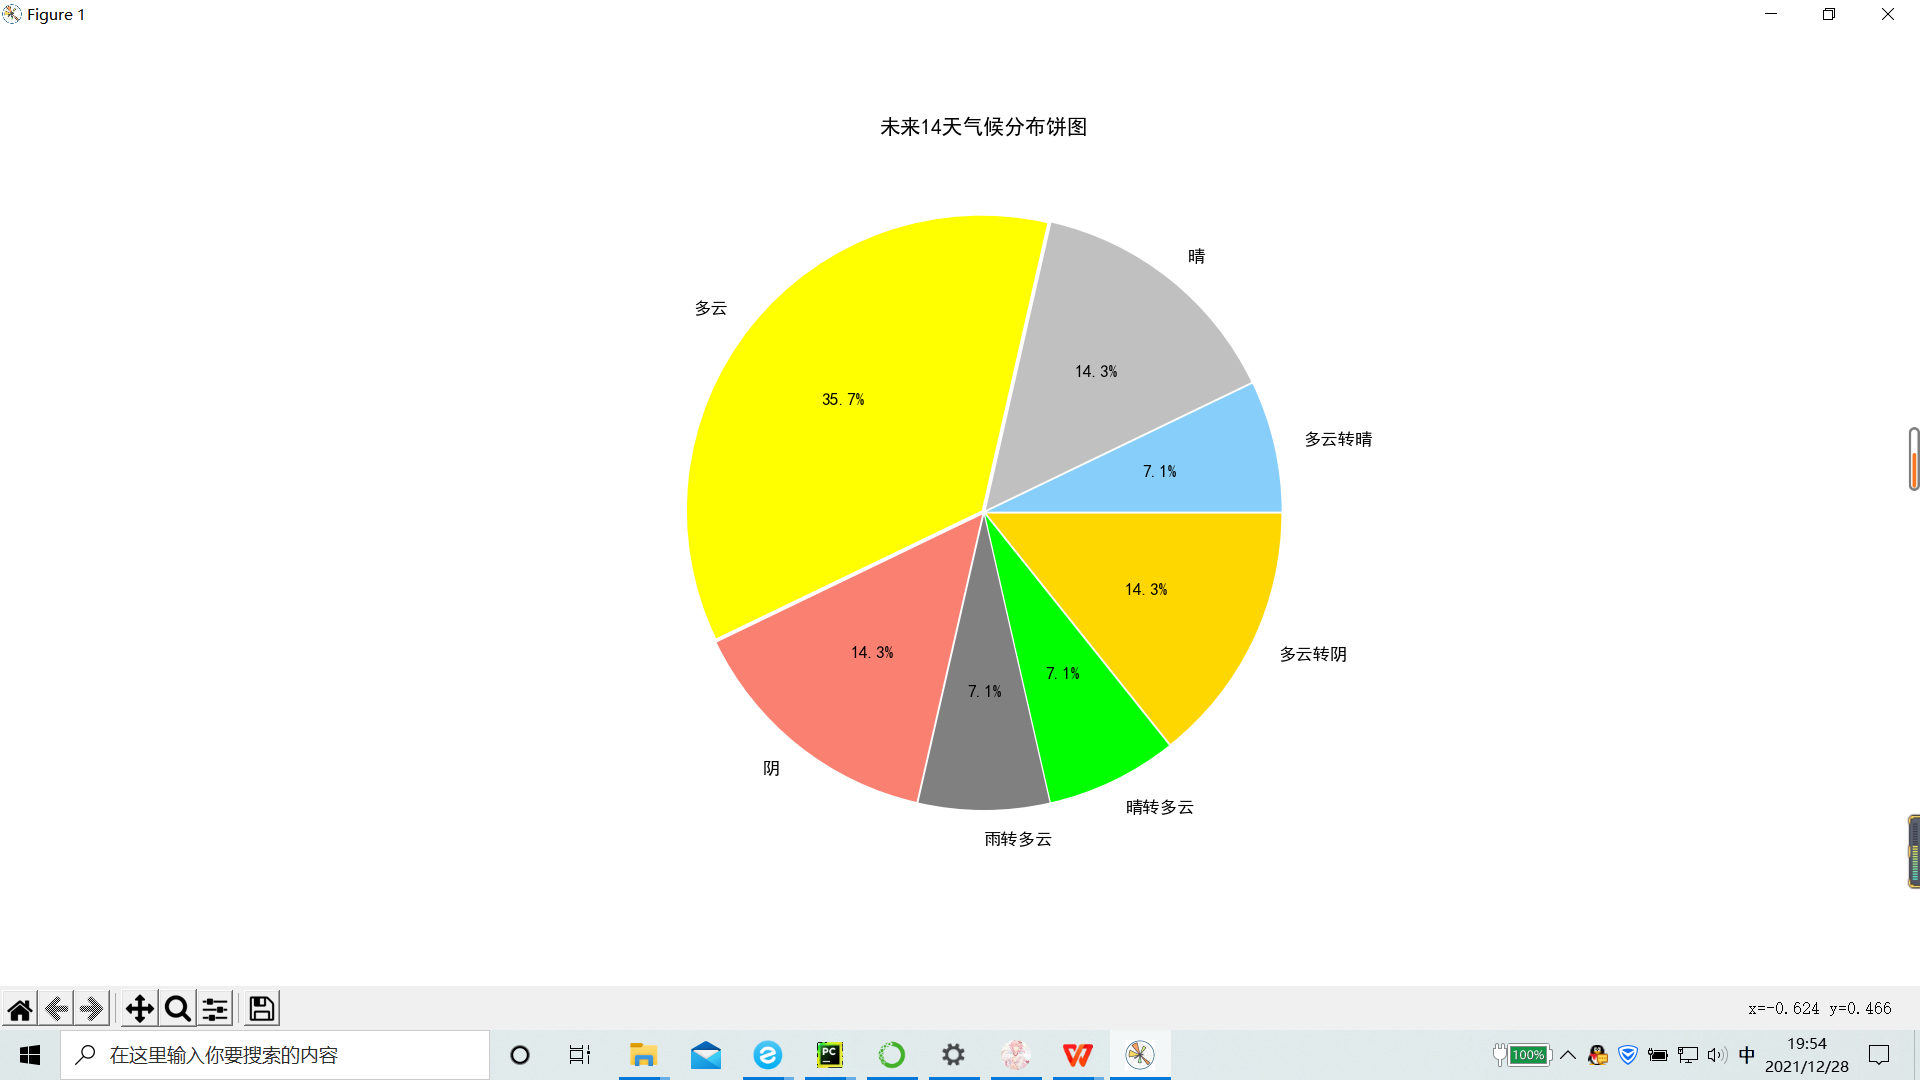
3.未来14天气候分布饼图
五、总结
1.首先根据爬取的温湿度数据进行的分析,温度从早上低到中午高再到晚上低,湿度和温度的趋势相反,通过相关系数发现温度和湿度有强烈的负相关关系,因为随着温度升高水蒸汽蒸发加剧,空气中水分降低湿度降低。当然,湿度同时受气压和雨水的影响,下雨湿度会明显增高。
2.风是由气压在水平方向分布的不均匀导致的。风受大气环流、地形、水域等不同因素的综合影响,表现形式多种多样,如季风、地方性的海陆风、山谷风等,一天的风向也有不同的变化,根据未来14天的风向雷达图可以发现未来所有风向基本都有涉及,并且没有特别的某个风向,原因可能是近期没有降水和气文变化不大,导致风向也没有太大的变化规律。
3.天气是指某一个地区距离地表较近的大气层在短时间内的具体状态。跟某瞬时内大气中各种气象要素分布的综合表现。根据未来14天的天气和温度变化可以大致推断出某个时间的气候,天气和温度之间也是有联系的
4.在完成此设计过程中,我了解到了网络爬虫的一些重要意义,也知道了爬虫的基本思路要指定网址,有需要爬的源,要明确想要得到什么数据,即网页中的标签存储什么数据,要知道建立什么样的规则去爬取网页数据。虽然对数据的爬取还有很多不明白,但是在未来的日子我会去学习更多的知识。


【推荐】国内首个AI IDE,深度理解中文开发场景,立即下载体验Trae
【推荐】编程新体验,更懂你的AI,立即体验豆包MarsCode编程助手
【推荐】抖音旗下AI助手豆包,你的智能百科全书,全免费不限次数
【推荐】轻量又高性能的 SSH 工具 IShell:AI 加持,快人一步
· 基于Microsoft.Extensions.AI核心库实现RAG应用
· Linux系列:如何用heaptrack跟踪.NET程序的非托管内存泄露
· 开发者必知的日志记录最佳实践
· SQL Server 2025 AI相关能力初探
· Linux系列:如何用 C#调用 C方法造成内存泄露
· 无需6万激活码!GitHub神秘组织3小时极速复刻Manus,手把手教你使用OpenManus搭建本
· Manus爆火,是硬核还是营销?
· 终于写完轮子一部分:tcp代理 了,记录一下
· 别再用vector<bool>了!Google高级工程师:这可能是STL最大的设计失误
· 单元测试从入门到精通