def axes_show_y_value(axes, x_data, y_data):
    for x, y in zip(x_data, y_data):
        axes.annotate(str(y),                       # this is the text
                      (x, y),                       # these are the coordinates to position the label
                      textcoords="offset points",   # how to position the text
                      xytext=(0, 4),                # distance from text to points (x,y)
                      size=9,                       # font size of the text
                      ha='center')                  # horizontal alignment can be left, right or center
def axes_general_setting(axes):
    axes.grid(axis='y', linestyle='--', alpha=0.5)
    axes.set_ylim(ymin=0)
    axes.set_title(axes.get_title(), pad=15)
    bottom, top = axes.get_ylim()
    axes.set_ylim(bottom, top+30)
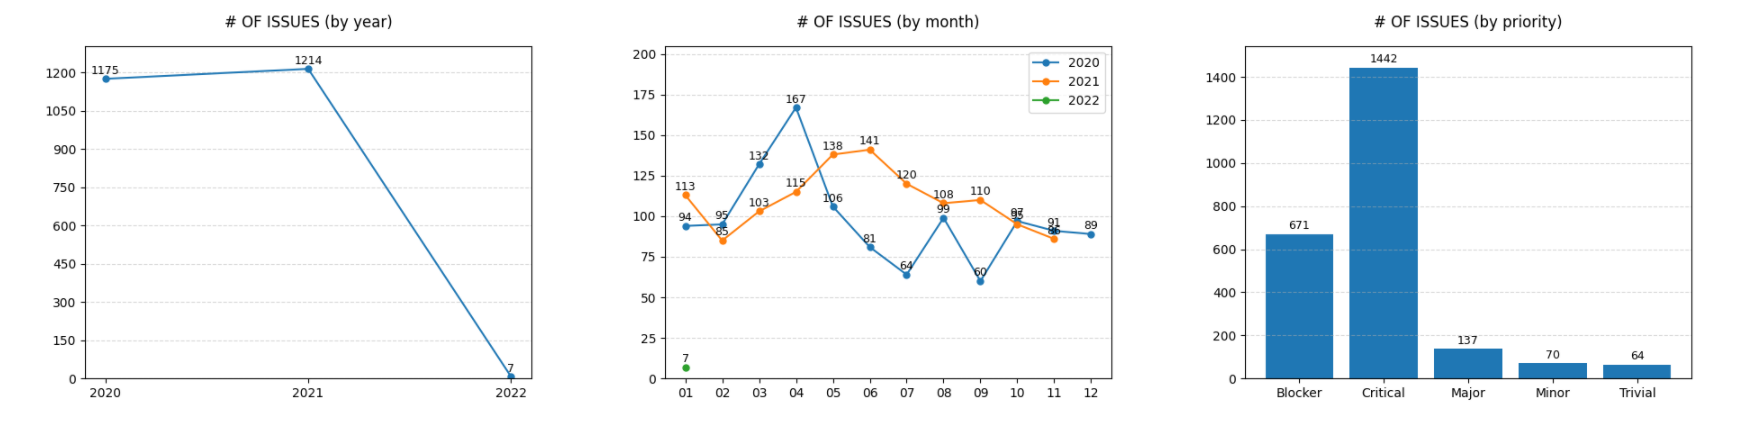
fig1, ax1 = plt.subplots()
ax1.plot(df_year, marker='.', markersize=10)
axes_general_setting(ax1)
ax1.set_title('# OF ISSUES (by year)')
ax1.yaxis.set_major_locator(MaxNLocator(min_n_ticks=1, integer=True))
axes_show_y_value(ax1, df_year.index.tolist(), df_year['cnt'])

fig2, ax2 = plt.subplots()
for year in df_year_month.index.levels[0].tolist():
    ax2.plot(df_year_month.loc[year], marker='.', markersize=10, label=year)
    axes_show_y_value(ax2, df_year_month.loc[year].index.tolist(), df_year_month.loc[year]['cnt'])
axes_general_setting(ax2)
ax2.legend()
ax2.set_title('# OF ISSUES (by month)')
ax2.yaxis.set_major_locator(MaxNLocator(min_n_ticks=1, integer=True))

fig3, ax3 = plt.subplots()
ax3.bar(df_priority.index.tolist(), df_priority['cnt'])
axes_general_setting(ax3)
ax3.set_title('# OF ISSUES (by priority)')
axes_show_y_value(ax3, df_priority.index.tolist(), df_priority['cnt'])


【推荐】国内首个AI IDE,深度理解中文开发场景,立即下载体验Trae
【推荐】编程新体验,更懂你的AI,立即体验豆包MarsCode编程助手
【推荐】抖音旗下AI助手豆包,你的智能百科全书,全免费不限次数
【推荐】轻量又高性能的 SSH 工具 IShell:AI 加持,快人一步
· 震惊!C++程序真的从main开始吗?99%的程序员都答错了
· 【硬核科普】Trae如何「偷看」你的代码?零基础破解AI编程运行原理
· 单元测试从入门到精通
· 上周热点回顾(3.3-3.9)
· winform 绘制太阳,地球,月球 运作规律