vue中echarts的基本用法
1.安装echarts包
npm install echarts --save
2.导入echarts和lodash,lodash用作两个数据合并
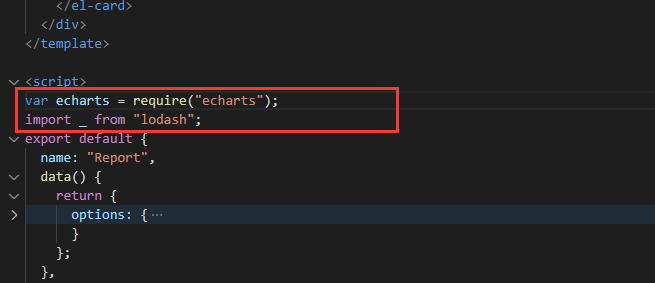
var echarts = require('echarts');
import _ from "lodash";
3.为echarts准备一个具备大小的dom
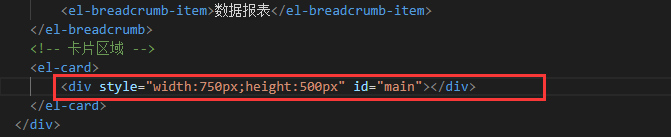
<div style="width:750px;height:500px" id="main"></div>
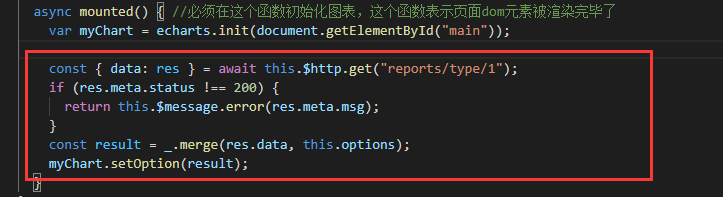
4.基于准备好的dom,初始化echarts
var myChart = echarts.init(document.getElementById('main'));
5.准备数据和配置项
 const { data: res } = await this.$http.get("reports/type/1");
    if (res.meta.status !== 200) {
      return this.$message.error(res.meta.msg);
    }
    // 用_merge方法把服务器返回的数据和data中的options做一下合并,如果不合并的话图表会确一些鼠标跟随的效果
    // data中的options数据是从接口文档拷贝的,接口文档给的
    const result = _.merge(res.data, this.options);
6.展示数据
myChart.setOption(result);
注意:以上四五六步都必须写在mounted函数里面
结果