Svg 画图(电池)
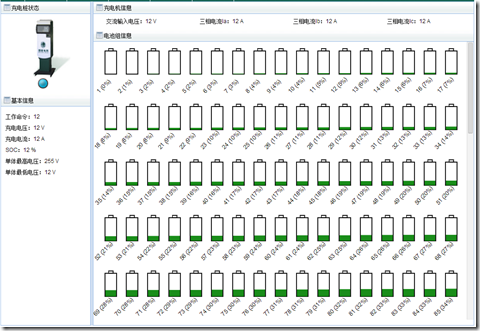
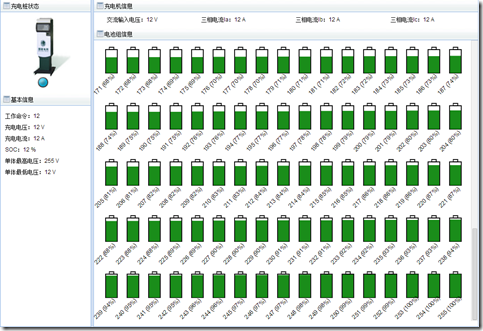
公司现在在做充电桩项目,其中要显示充电桩的电池充电情况,功能展示的时候要画图,之前做的时候准备使用HightChar来画,但是,hightchar好像没有这样的电池图形,最后,项目经理要我自己通过svg画,所以到网上找了一些网址学习svg,其中就有:点击这里,下面我就粘贴下代码和显示图片效果,希望能够帮助到一些朋友。
这里显示的是js文件:
$(function () {
    var id = getQueryString("id");
    QueryData(id);
    QueryItemData(id);
});

function QueryData(id) {
    zwobj.url = '../../WebService/ChargePileDetailService.ashx?action=QueryByZhuanId';
    zwobj.data = { id: id };
    ajaxData();
}

function QueryItemData(id) {
    zwobj.url = '../../WebService/ChargePileDetailService.ashx?action=QueryItemData';
    zwobj.data = { id: id };
    ajaxData();
}

//-----------------------------------------------------------------------

function ajax_QueryByZhuanId(data) {
    var len = data.Data.length;
    if (len <= 0) {
        return;
    }
    $("#gzml").append(data.Data[0].Gzml);
    $("#cddy").append(data.Data[0].Cddy + " V");
    $("#cddl").append(data.Data[0].Cddl + " A");
    $("#soc").append(data.Data[0].Soc + " %");
    $("#dtzgdy").append(data.Data[0].DtdyMax + " V");
    $("#dtzddy").append(data.Data[0].DtdyMin + " V");
    $("#jlsrdy").append(data.Data[0].Srjldy + " V");
    $("#sxdl-ia").append(data.Data[0].Ia + " A");
    $("#sxdl-ib").append(data.Data[0].Ib + " A");
    $("#sxdl-ic").append(data.Data[0].Ic + " A");
}

function ajax_QueryItemData(data) {
    $("#svg-img").empty();
    var dtMaxDy;
    var len = data.DtdyMax.length;
    if (len <= 0) {
        dtMaxDy = 255;
    } else {
        dtMaxDy = data.DtdyMax[0].dtdymax;
    }

    var x1 = 32.5, x2 = 25, x3 = 26, x4 = 15, x = -48;
    var y1 = 15, y2 = 20, y3 = 46, y4 = 85;
    var html = '<svg width="100%" height="1800px" version="1.1" xmlns="http://www.w3.org/2000/svg">';
    for (var i = 0, j = 0, k = 0; i < 255; i++) {
        var percent = percentItem(dtMaxDy, data.DataItemList[i].dtdy);
        percent = Math.ceil(percent);
        if (i % 17 == 0 && i != 0) {
            k++;
            j = 0;
        }
        if (k > 0) {
            html += '<rect x="' + (x1 + (46 * j)) + '" y="' + (y1 + 120 * k) + '" width="10" height="5" style="fill:white;stroke:black;stroke-width:2;opacity:0.9"/>';
            html += '<rect x="' + (x2 + (46 * j)) + '" y="' + (y2 + 120 * k) + '" width="25" height="50" style="fill:white;stroke:black;stroke-width:2;opacity:0.9"/>';

            var h = fillHeight(dtMaxDy, data.DataItemList[i].dtdy);
            var y = fillY((y2 + 120 * k), h);
            html += '<rect x="' + (x3 + (46 * j)) + '" y="' + y + '" width="23" height="' + h + '" style="fill:green;opacity:0.9"/>';

            switch (k) {
                case 1:
                    html += '<text x="' + ((x * k) + (23 * j)) + '" y="' + (y4 + 170 * k) + '" style="fill: #000" transform="translate(' + ((x * k) + (23 * j)) + ', 20) rotate(-45, ' + ((x * k) + (23 * j)) + ',110)">' + (i + 1) + ' (' + percent + '%)</text>';
                    break;
                case 2:
                case 3:
                case 4:
                case 5:
                    html += '<text x="' + ((x * k) + (23 * j) + ((-11) + (k - 2) * -13)) + '" y="' + (y4 + 170 * k) + '" style="fill: #000" transform="translate(' + ((x * k) + (23 * j) + ((-11) + (k - 2) * -13)) + ', 20) rotate(-45, ' + ((x * k) + (23 * j) + ((-11) + (k - 2) * -13)) + ',110)">' + (i + 1) + ' (' + percent + '%)</text>';
                    break;
                case 6:
                case 7:
                case 8:
                    html += '<text x="' + ((x * k) + (23 * j) + ((-11) + (k - 2) * -13)) + '" y="' + (y4 + 171 * k) + '" style="fill: #000" transform="translate(' + ((x * k) + (23 * j) + ((-11) + (k - 2) * -13)) + ', 20) rotate(-45, ' + ((x * k) + (23 * j) + ((-11) + (k - 2) * -13)) + ',110)">' + (i + 1) + ' (' + percent + '%)</text>';
                    break;
                case 9:
                case 10:
                    html += '<text x="' + ((x * k) + (23 * j) + ((-8) + (k - 2) * -13)) + '" y="' + (y4 + 170.5 * k) + '" style="fill: #000" transform="translate(' + ((x * k) + (23 * j) + ((-8) + (k - 2) * -13)) + ', 20) rotate(-45, ' + ((x * k) + (23 * j) + ((-8) + (k - 2) * -13)) + ',110)">' + (i + 1) + ' (' + percent + '%)</text>';
                    break;
                case 11:
                case 12:
                case 13:
                    html += '<text x="' + ((x * k) + (23 * j) + ((-5) + (k - 2) * -13)) + '" y="' + (y4 + 170.5 * k) + '" style="fill: #000" transform="translate(' + ((x * k) + (23 * j) + ((-5) + (k - 2) * -13)) + ', 20) rotate(-45, ' + ((x * k) + (23 * j) + ((-5) + (k - 2) * -13)) + ',110)">' + (i + 1) + ' (' + percent + '%)</text>';
                    break;
                case 14:
                    html += '<text x="' + ((x * k) + (23 * j) + ((-3) + (k - 2) * -13)) + '" y="' + (y4 + 170.2 * k) + '" style="fill: #000" transform="translate(' + ((x * k) + (23 * j) + ((-3) + (k - 2) * -13)) + ', 20) rotate(-45, ' + ((x * k) + (23 * j) + ((-3) + (k - 2) * -13)) + ',110)">' + (i + 1) + ' (' + percent + '%)</text>';
                    break;
                default:
                    html += '<text x="' + ((x * k) + (23 * j)) + '" y="' + (y4 + 170 * k) + '" style="fill: #000" transform="translate(' + ((x * k) + (23 * j)) + ', 20) rotate(-45, ' + ((x * k) + (23 * j)) + ',110)">' + (i + 1) + ' (' + percent + '%)</text>';
                    break;
            }
            j++;
        }
        else {
            html += '<rect x="' + (x1 + (46 * i)) + '" y="' + y1 + '" width="10" height="5" style="fill:white;stroke:black;stroke-width:2;opacity:0.9"/>';
            html += '<rect x="' + (x2 + (46 * i)) + '" y="' + y2 + '" width="25" height="50" style="fill:white;stroke:black;stroke-width:2;opacity:0.9"/>';
            var h22 = fillHeight(dtMaxDy, data.DataItemList[i].dtdy);
            var y22 = fillY(y2, h22);
            html += '<rect x="' + (x3 + (46 * i)) + '" y="' + y22 + '" width="23" height="' + h22 + '" style="fill:green;opacity:0.9"/>';
            html += '<text x="' + (x4 + (23 * i)) + '" y="' + y4 + '" style="fill: #000" transform="translate(' + (x4 + (23 * i)) + ', 20) rotate(-45, ' + (x4 + (23 * i)) + ',110)">' + (i + 1) + ' (' + percent + '%)</text>';
        }
    }
    html += '</svg>';
    $("#svg-img").append(html);
}

//求填充电池的高度(50是图形的高度)
function fillHeight(itemMaxDy, itemDy) {
    return (50 * itemDy) / itemMaxDy;
}

//求填充电池的y点坐标
function fillY(y1, h) {
    return (y1 + 50 - h);
}

//求单体百分比
function percentItem(itemMaxDy, itemDy) {
    return (itemDy / itemMaxDy) * 100;
}
这里显示的是cs文件效果:
using System;
using System.Collections;
using System.Collections.Generic;
using System.Data;
using System.Linq;
using System.Reflection;
using System.ServiceModel.Channels;
using System.Web;
using System.Web.Script.Serialization;
using ChargingPile.Model;
using ChargingPile.DAL;

namespace ChargingPile.UI.WEB.WebService
{
    /// <summary>
    /// Summary description for ChargePileDetailService
    /// </summary>
    public class ChargePileDetailService : IHttpHandler
    {
        private readonly JavaScriptSerializer _jss = new JavaScriptSerializer();
        public void ProcessRequest(HttpContext context)
        {
            context.Response.ContentType = "text/plain";
            var action = context.Request.Params["action"];
            var curType = GetType();
            var method = curType.GetMethod(action, BindingFlags.NonPublic | BindingFlags.Public | BindingFlags.Instance);
            if (method != null)
            {
                method.Invoke(this, new object[] { HttpContext.Current });
            }
        }

        /// <summary>
        /// 根据桩id获取数据采集实时表数据
        /// </summary>
        /// <param name="httpContext"></param>
        public void QueryByZhuanId(HttpContext httpContext)
        {
            var dataAcquisitionNewDal = new DataAcquisitionNewDal();
            var id = httpContext.Request.Params["id"];
            var hashTable = new Hashtable();
            try
            {
                var data = dataAcquisitionNewDal.QueryById(id);
                var list = (from row in data.AsEnumerable()
                            select new DataAcquisitionNew()
                                {
                                    Gzml = row.Field<string>("gzml"),
                                    Cddy = row.Field<decimal>("cddy"),
                                    Cddl = row.Field<decimal>("cddl"),
                                    Soc = row.Field<decimal>("soc"),
                                    DtdyMax = row.Field<decimal>("dtdymax"),
                                    DtdyMin = row.Field<decimal>("DtdyMin"),
                                    Srjldy = row.Field<decimal>("Srjldy"),
                                    Ia = row.Field<decimal>("Ia"),
                                    Ib = row.Field<decimal>("Ib"),
                                    Ic = row.Field<decimal>("Ic")
                                }).ToList();

                hashTable["IsSuccess"] = true;
                hashTable["Data"] = list;
                hashTable["JsExecuteMethod"] = "ajax_QueryByZhuanId";
                var json = _jss.Serialize(hashTable);
                httpContext.Response.Write(json);
            }
            catch (Exception e)
            {
                hashTable["IsSuccess"] = false;
                hashTable["Msg"] = "错误" + e.Message;
                var json = _jss.Serialize(hashTable);
                httpContext.Response.Write(json);
                throw;
            }
        }

        public void QueryItemData(HttpContext context)
        {
            var dataAcquisitionNewDal = new DataAcquisitionNewDal();
            var id = context.Request.Params["id"];
            var hashTable = new Hashtable();
            try
            {
                var data = dataAcquisitionNewDal.QueryByItems(id);
                var dtList = (from row in data.AsEnumerable()
                              select new
                              {
                                  dtid = row.Field<decimal>("dtid"),
                                  dtdy = row.Field<decimal>("dtdy")
                              }).ToList();
                var dtdyMaxList = (from row in data.AsEnumerable()
                                   select new
                                   {
                                       dtdymax = row.Field<decimal>("dtdymax")
                                   }).ToList().Distinct();
                for (var i = 1; i <= 255; i++)
                {
                    var item = from li in dtList
                               where li.dtid == i
                               select li;
                    if (!item.Any())
                    {
                        dtList.Add(new { dtid = (decimal)i, dtdy = (decimal)0 });
                    }
                }

                hashTable["IsSuccess"] = true;
                hashTable["DataItemList"] = dtList.OrderBy(s => s.dtid).ToList();
                hashTable["DtdyMax"] = dtdyMaxList.ToList();
                hashTable["JsExecuteMethod"] = "ajax_QueryItemData";
                var json = _jss.Serialize(hashTable);
                context.Response.Write(json);
            }
            catch (Exception e)
            {
                hashTable["IsSuccess"] = false;
                hashTable["Msg"] = "错误" + e.Message;
                var json = _jss.Serialize(hashTable);
                context.Response.Write(json);
                throw;
            }
        }


        public bool IsReusable
        {
            get
            {
                return false;
            }
        }
    }
}
效果如图:
总结:
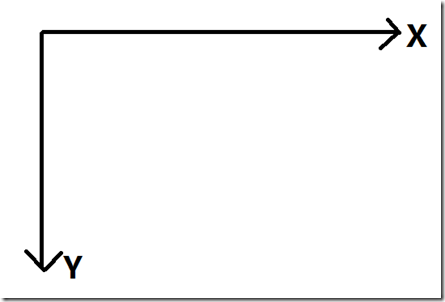
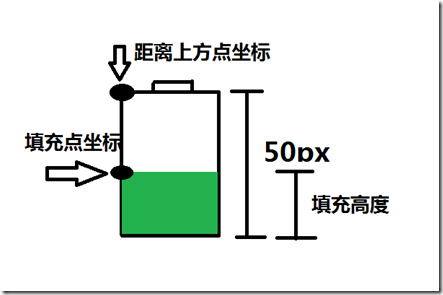
每篇博客都要写些文字来总结,就是充当字数,要不然博客园不允许发表到首页^_^,我还是来总结下svg画图功能吧,svg画图最基本的就是确定坐标点,如图:
注意:只有找准坐标点,那么才能画图,过程中涉及到一些小调整和算法,这个代码里都有我就不多说了,再多说一句,画图时一点一点的画,不要着急。^_^


【推荐】国内首个AI IDE,深度理解中文开发场景,立即下载体验Trae
【推荐】编程新体验,更懂你的AI,立即体验豆包MarsCode编程助手
【推荐】抖音旗下AI助手豆包,你的智能百科全书,全免费不限次数
【推荐】轻量又高性能的 SSH 工具 IShell:AI 加持,快人一步
· 如何编写易于单元测试的代码
· 10年+ .NET Coder 心语,封装的思维:从隐藏、稳定开始理解其本质意义
· .NET Core 中如何实现缓存的预热?
· 从 HTTP 原因短语缺失研究 HTTP/2 和 HTTP/3 的设计差异
· AI与.NET技术实操系列:向量存储与相似性搜索在 .NET 中的实现
· 周边上新:园子的第一款马克杯温暖上架
· Open-Sora 2.0 重磅开源!
· .NET周刊【3月第1期 2025-03-02】
· 分享 3 个 .NET 开源的文件压缩处理库,助力快速实现文件压缩解压功能!
· [AI/GPT/综述] AI Agent的设计模式综述