使用Python matplotlib做动态曲线
今天看到“Python实时监控CPU使用率”的教程:
https://www.w3cschool.cn/python3/python3-ja3d2z2g.html
自己也学习如何使用Python matplotlib库画图,便照葫芦画瓢做了个动态的正弦曲线。
脚本如下:
import matplotlib.pyplot as plt
import matplotlib.font_manager as font_manager
import numpy as np

POINTS = 100
sin_list = [0] * POINTS
indx = 0

fig, ax = plt.subplots()
ax.set_ylim([-2, 2])
ax.set_xlim([0, POINTS])
ax.set_autoscale_on(False)
ax.set_xticks(range(0, 100, 10))
ax.set_yticks(range(-2, 3, 1))
ax.grid(True)

line_sin, = ax.plot(range(POINTS), sin_list, label='Sin() output', color='cornflowerblue')
ax.legend(loc='upper center', ncol=4, prop=font_manager.FontProperties(size=10))


def sin_output(ax):
    global indx, sin_list, line_sin
    if indx == 20:
        indx = 0
    indx += 1

    sin_list = sin_list[1:] + [np.sin((indx / 10) * np.pi)]
    line_sin.set_ydata(sin_list)
    ax.draw_artist(line_sin)
    ax.figure.canvas.draw()


timer = fig.canvas.new_timer(interval=100)
timer.add_callback(sin_output, ax)
timer.start()
plt.show()
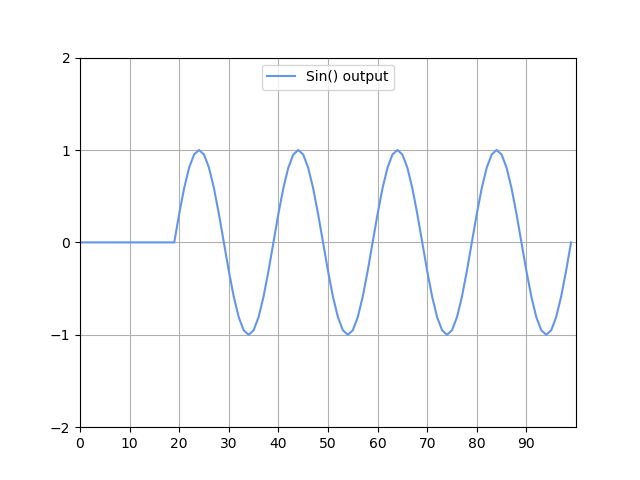
运行图:
参考:


 浙公网安备 33010602011771号