基于TensorFlow和Python的机器学习(笔记2)
基于TensorFlow和Python的机器学习(笔记2)
LSTM模型摘要
|
Model: "sequential_1" _________________________________________________________________ Layer (type) Output Shape Param # ================================================================= embedding_1 (Embedding) (None, 380, 32) 121600
dropout_2 (Dropout) (None, 380, 32) 0
lstm (LSTM) (None, 32) 8320
dense_2 (Dense) (None, 256) 8448
dropout_3 (Dropout) (None, 256) 0
dense_3 (Dense) (None, 1) 257
================================================================= Total params: 138,625 Trainable params: 138,625 Non-trainable params: 0 _________________________________________________________________ |
LSTM模型摘要
嵌入层 丢弃层 LSTM层 全连接层,隐藏层 丢弃层 输出层 |
dropout层 全连接层加dropout层防止模型过拟合,提升模型泛化能力 卷积网络中参数较少,加入dropout作用甚微。
添加dropout层,可以防止模型过拟合。每一次迭代时,会按照指定比例随机将神经元输出至零。
User Reviews译文:用户评论
LSTM长短期记忆模型
|
import urllib.request # 用于下载文件 import os # 用于确认文件是否存在 import tarfile # 用于解压文件
import numpy
folder = 'data' # 如果文件夹不存在,就创建文件夹 if not os.path.exists(folder): os.mkdir(folder) # 文件下载地址,斯坦福大学 url = 'http://ai.stanford.edu/~amaas/data/sentiment/aclImdb_v1.tar.gz' filepath = 'data/calImdb_v1.tar.gz' # 文件存储路径 # 如果文件不存在就下载 if not os.path.isfile(filepath): result = urllib.request.urlretrieve(url=url, filename=filepath) print('下载成功', result) # 下载成功 ('data/calImdb_v1.tar.gz', <http.client.HTTPMessage object at 0x0000016CB8183D30>)
# 解压下载的文件 if not os.path.exists('data/aclImdb'): tfile = tarfile.open(filepath, 'r:gz') tfile.extractall('data/') print('解压成功') # 导入Tokenizer模块,用于创建Tokenizer字典 from keras.preprocessing.text import Tokenizer # 导入sequence模块,用于将字符串取长补短 from keras_preprocessing import sequence
# 导入re模块,用于删除文本中的HTML标签 import re
def remove_tags(text): reg = re.compile(r'<[^>]+>') # text中匹配的内容全部替换为空字符串,并返回全部替换后的内容 return reg.sub('', text)
def read_files(file_type): path = 'data/aclImdb/' file_list = [] # 文件路径列表 # 获取正面评价文件 positive_path = path + file_type + '/pos/' for f in os.listdir(positive_path): file_list.append(positive_path + f) # 获取负面评价文件 negative_path = path + file_type + '/neg/' for f in os.listdir(negative_path): file_list.append(negative_path + f) print(f'{file_type}文件列表成功读取,共计{len(file_list)}') # 创建标签,前12500个位正面评价项,标签1,后12500项为负面评价,标签0 all_labels = ([1] * 12500 + [0] * 12500) # 从文件列表读取所有文本内容 all_texts = [] for fi in file_list: # 遍历所有文件路径 with open(fi, 'r', encoding='utf-8') as file: lines = file.readlines() # 读取所有行 text = ' '.join(lines) # 连接所有行 text = remove_tags(text) # 去除HTML标记 all_texts.append(text) # 添加到列表 print(f'{file_type}文件读取成功 labels个数={len(all_labels)},texts个数={len(all_texts)}') return all_labels, all_texts
train_label, train_text = read_files('train') test_label, test_text = read_files('test') train_label = numpy.array(train_label) # 将list转换为ndarray test_label = numpy.array(test_label) # 将list转换为ndarray # train文件列表成功读取,共计25000 # train文件读取成功 labels个数=25000,texts个数=25000 # test文件列表成功读取,共计25000 # test文件读取成功 labels个数=25000,texts个数=25000 # train_label=numpy.ndarray(test_label)??? # test_label=numpy.ndarray(test_label)??? # 查看数据 # print(train_label[12499])#1 # print(train_text[12499])#Working-class romantic... # print(train_label[12500])#0 # print(train_text[12500])#Story of a man who... token_size = 3800 # 根据文本内容,建立Token字典 token = Tokenizer(num_words=token_size) token.fit_on_texts(train_text)
# 查看token对象 # #读取的文章数量 # print(token.document_count) # #词汇统计量,按照出现次数由高到低依次排列 # print(token.word_index)#'whelk': 89660, "shite'": 89661} # print(type(token.word_index))#<class 'dict'>
# 将文字转化为数字序列sequence train_seq = token.texts_to_sequences(train_text) test_seq = token.texts_to_sequences(test_text)
# print(train_text[0])#Bromwell High is a cartoon comedy. # print(train_seq[0])#[308, 6, 3, 1068, 208, 8, 29, 1, # print(len(train_text[0]))#806 # print(len(train_seq[0]))#106 max_len = 380 # 截长补短 # {ndarray: (25000, 100)}[[ 29 1 168 ... 11 8 214], [ 544 38 511 ... 5 335 404], train = sequence.pad_sequences(train_seq, maxlen=max_len) test = sequence.pad_sequences(test_seq, maxlen=max_len)
# print(len(train_seq[0]) )#106 # print(len(train[0]))#100 # print(train_seq[0]) # print(train[0]) # # print(len(train_seq[11]) )#77 # print(len(train[11]))#100 # print(train_seq[11]) # print(train[11])#[ 0 0 0 0 0 0
# 创建模型 from keras.models import Sequential from keras.layers.core import Dense, Dropout, Activation, Flatten from keras.layers import Embedding
# 加入嵌入层Embedding # 嵌入层将数字列表转换为向量格式 # output_dim=32将数字列表转换为32维度的向量 # input_dim=2000词典token的容量2000 # 2000个词转换为onehot格式就是有2000维 # input_length=100输入句子长度,统一转换为200维的数字列表 model = Sequential() model.add(Embedding(output_dim=32, input_dim=token_size, input_length=max_len)) # 嵌入层 model.add(Dropout(rate=0.2)) # 加入多层感知机MLP model.add(Flatten()) # 平坦层 # 256个神经元,激活函数relu model.add(Dense(units=256, activation='relu')) # 隐藏层 model.add(Dropout(rate=0.35)) # 稀疏层 model.add(Dense(units=1, activation='sigmoid')) # 输出层 model.summary() # 查看模型概述
# 训练模型 # loss='binary_crossentropy'损失函数交叉熵 # optimizer='adam'优化器adam # metrics=['accuracy']度量标准 准确率 model.compile(loss='binary_crossentropy', optimizer='adam', metrics=['accuracy'])
# 训练 # x=train输入数据 y=train_label标签数据 # epochs=10训练10个周期,batch_size=100每个批次训练100条数据 # verbose=2每训练完成一个周期,就打印一条日志, # validation_split=0.2 将训练数据切分20%用作验证数据 # 将训练号的数据保存到本地,避免重复训练 folder = 'save_model' data_path = folder + '\\' + 'imdb_model_data_big.h5' if not os.path.exists(folder): os.mkdir(folder)
try: model.load_weights(data_path) # train_history=model.history print('模型加载成功', data_path) except: print('模型加载失败,开始一个新的训练', data_path) train_history = model.fit(x=train, y=train_label, epochs=10, batch_size=100, verbose=2, validation_split=0.2) model.save_weights(data_path) print('模型保存成功', data_path)
# train_history=model.fit(x=train,y=train_label,epochs=10,batch_size=100,verbose=2,validation_split=0.2) # x=test输入数据,y=test_label输入标签, # verbose=1 显示进度条 scores = model.evaluate(x=test, y=test_label, verbose=1) # [0.9706318974494934, 0.8091599941253662]token词典容量2000,句子长度max_len=100 # [0.771744430065155, 0.8501999974250793]token词典容量3800,句子长度max_len=380 print(scores) predict = model.predict(x=test) print(predict[:10]) # [[0.999992 ] [0.9999999 ] [0.01608694] [0.99999934] predict = predict.reshape(-1) sentiment_dict = {1: '正面的', 0: '负面的'}
def show_sentiment(i): print(test_text[i]) print('真实值= ', sentiment_dict[test_label[i]]) print('预测值= ', sentiment_dict[predict[i]])
show_sentiment(22) # Despite the title and unlike some other stories about love and war,... # 真实值= 正面的 # 预测值= 正面的
# 《西部世界》S1的影评 # https://www.imdb.com/title/tt4227538/reviews?ref_=tt_ql_3 pos_text = [ 'This show got me instantly hooked on. Evan Rachel Wood is extremely beautiful and gorgeous. She acts well too. Ed Harris looks menacing . Many other characters get introduced and they act really well. The visuals are spectacular and the action sequences are brilliant. Anthony Hopkins is the icing on the cake. Brilliant show .I am loving this.'] neg_text = [ 'The film is built on a time loop, a constant return to the same events, their different development, but always the same result, but the meaning. What\'s the point?Emptiness, cruelty.The series does not relax, does not intrigue, is a little nervous and annoying.Lots of blood, brutality, murder.I did not understand the meaning and purpose of the series, I could not watch the season.Boring meaningless dialogues, a bunch of murders that could not have happened, so simply between two words some hero killed several people. Why?'] # pos_seq[[827], [], [9], [586], [], [586], [], pos_seq = token.texts_to_sequences(pos_text) neg_seq = token.texts_to_sequences(neg_text)
# pos_seq_pad ={ndarray: (344, 100)} [[ 0 0 0 ... 0 0 827], [ 0 0 0 ... 0 0 0] # pos_seq_pad=sequence.pad_sequences(pos_seq,maxlen=max_len) # neg_seq_pad=sequence.pad_sequences(neg_seq,maxlen=max_len) # print(len(pos_seq[0]),len(pos_seq_pad[0]))# 44 100 # print(len(neg_seq[0]),len(neg_seq_pad[0]))# 80 100 # # # predict=model.predict(pos_seq_pad) # print(predict)#[[0.99994254]] # print(sentiment_dict[round(predict[0][0])])#正面的 # predict=model.predict(neg_seq_pad) # print(predict)#[[4.8185284e-05]] # print(sentiment_dict[round(predict[0][0])])#负面的
def predict_review(text): seq = token.texts_to_sequences([text]) pad_seq = sequence.pad_sequences(seq, maxlen=max_len) predict = model.predict(pad_seq) return sentiment_dict[round(predict[0][0])]
# 10/10 text = 'The episode itself is so beautifully written and it slowly builds and puts a story together. It also creates a desire for the viewer to watch more of the series, I have watched the first 3 seasons, but this episode might be my favorite because I have never seen anything like it in the TV world, I can\'t find a single flaw with the storytelling and the world that has been created is absolutely fantastic and mysterious. Any new TV or even movie writer should take inspiration from how this \"The Original\" was written.' print('文本=', text) print('预测=', predict_review(text)) # 预测= 正面的 # 1/10,2001: A Space Odyssey (1968)User Reviews text = 'I\'m sorry, good music and cool special effects do not make a good movie! What the heck? I mean, I saw this movie when I was a kid, and I didn\'t like it. Now, I have a growing appreciation for movies, and I wanted to write a comment from a more grown up point of view. I had 2 hours to spare and I watched this movie, I swear I nearly went insane. I normally put on the subtitles, in case I miss something or misunderstand the dialoug, 89% of the movie is silent! Apes?! I could just go to the zoo and say I saw this movie! I could watch "Star Wars" and say I saw this movie! It\'s the same friggin\' thing. I\'m not trying to be so harsh on this film, but how can anyone find this entertaining?! How?! Unless you are 150 years old, that is the only way I could understand. Geez, people. This movie is so out dated and needs to be thrown away, especially from the top 250! Why are so many bad movies on top 250?! I\'m getting sick of these over hyped movies!' print('文本=', text) print('预测=', predict_review(text)) # 预测= 负面的
# 建立LSTM模型 from keras.layers import LSTM
model2 = Sequential() # Embeddings层的功能是,将“数字列表”转换为“向量列表”; # input_dim=3800表示token字典容量,字典有多少个词,每个词转换成onehot就有多少维度 # output_dim=32表示想要输出的词向量维度,可以根据需要指定,但是要和LSTM参数一致 # input_length=380每个文本的词汇数量,也就是句子长度 model2.add(Embedding(input_dim=token_size, output_dim=32, input_length=max_len)) # Dropout丢弃层(所谓丢弃就是将权值w置0) 丢弃比例20% # Dropout层的功能是,每次训练迭代时,会随机的在神经网络中放弃指定比例的神经元,以避免过度拟合overfitting; model2.add(Dropout(rate=0.2)) # 长短期记忆Long Short Term Memory,LSTM,也是一种递归神经网络,专门设计用来解决RNN的长期依赖问题; # RNN在训练时会有长期依赖问题,这是由于RNN模型在训练时会遇到梯度消失或爆炸; # 训练时计算和反向传播,梯度倾向于在每一时刻递增或递减,经过一段时间后,会发散到无穷大或收敛到0; # 简单来说,长期依赖的问题就是每一个时间的间隔不断增大时,RNN会丧失学习到连接远处的信息的能力。 # 多层感知器MLP或者卷积神经网络CNN都只能依照当前的状态进行识别 # 如果要处理时间序列问题,就必须使用RNN和LSTM模型。 model2.add(LSTM(32)) # 全连接层 神经元个数256 激活函数 热卤 model2.add(Dense(units=256, activation='relu')) # Dropout丢弃层(所谓丢弃就是将权值w置0) 丢弃比例20% model2.add(Dropout(rate=0.2)) # 全连接层,输出层 units=1神经元个数1,激活函数 四个猫 model2.add(Dense(units=1, activation='sigmoid')) # 打印模型概述/摘要 print('LSTM模型摘要') print(model2.summary())
# 训练模型 model2.compile(loss='binary_crossentropy',optimizer='adam',metrics=['accuracy'])#... data_path = folder + '\\' + 'imdb_model_data_lstm.h5' try: model2.load_weights(data_path) # train_history=model.history print('模型加载成功', data_path) except: print('模型加载失败,开始一个新的训练', data_path) train_history = model2.fit(x=train, y=train_label, epochs=10, batch_size=100, verbose=2, validation_split=0.2) model2.save_weights(data_path) print('模型保存成功', data_path)
scores2 = model2.evaluate(x=test, y=test_label, verbose=1) print(scores2) #[0.5193130373954773, 0.8575599789619446] |
模型概述
|
Model: "sequential" _________________________________________________________________ Layer (type) Output Shape Param # ================================================================= embedding (Embedding) (None, 100, 32) 64000 dropout (Dropout) (None, 100, 32) 0 flatten (Flatten) (None, 3200) 0 dense (Dense) (None, 256) 819456 dropout_1 (Dropout) (None, 256) 0 dense_1 (Dense) (None, 1) 257 ================================================================= Total params: 883,713 Trainable params: 883,713 Non-trainable params: 0 _________________________________________________________________ 进程已结束,退出代码0 |
模型结构 嵌入层 稀疏层 平坦层 密集层,隐藏 稀疏层 密集层,输出 |
截长补短
train=sequence.pad_sequences(train_seq,maxlen=100)
test=sequence.pad_sequences(test_seq,maxlen=100)
|
截长 |
[308, 6, 3, 1068, 208, 8, 29, 1, 168, 54, 13, 45, 81, 40, 391, 109, 137, 13, 57, 149, 7, 1, 481, 68, 5, 260, 11, 6, 72, 5, 631, 70, 6, 1, 5, 1, 1530, 33, 66, 63, 204, 139, 64, 1229, 1, 4, 1, 222, 899, 28, 68, 4, 1, 9, 693, 2, 64, 1530, 50, 9, 215, 1, 386, 7, 59, 3, 1470, 798, 5, 176, 1, 391, 9, 1235, 29, 308, 3, 352, 343, 142, 129, 5, 27, 4, 125, 1470, 5, 308, 9, 532, 11, 107, 1466, 4, 57, 554, 100, 11, 308, 6, 226, 47, 3, 11, 8, 214] [ 29 1 168 54 13 45 81 40 391 109 137 13 57 149 7 1 481 68 5 260 11 6 72 5 631 70 6 1 5 1 1530 33 66 63 204 139 64 1229 1 4 1 222 899 28 68 4 1 9 693 2 64 1530 50 9 215 1 386 7 59 3 1470 798 5 176 1 391 9 1235 29 308 3 352 343 142 129 5 27 4 125 1470 5 308 9 532 11 107 1466 4 57 554 100 11 308 6 226 47 3 11 8 214] |
|
补短 |
[9, 419, 1, 18, 45, 4, 1, 202, 135, 67, 51, 217, 2, 69, 220, 9, 257, 419, 1, 632, 132, 59, 65, 3, 7, 8, 3, 51, 202, 132, 11, 464, 69, 220, 45, 4, 1, 135, 67, 810, 7, 217, 765, 137, 13, 54, 1374, 1726, 38, 217, 77, 1, 18, 6, 158, 6, 446, 527, 9, 77, 419, 85, 1, 441, 229, 12, 995, 95, 470, 198, 1, 18, 31, 708, 42, 4, 160] [ 0 0 0 0 0 0 0 0 0 0 0 0 0 0 0 0 0 0 0 0 0 0 0 9 419 1 18 45 4 1 202 135 67 51 217 2 69 220 9 257 419 1 632 132 59 65 3 7 8 3 51 202 132 11 464 69 220 45 4 1 135 67 810 7 217 765 137 13 54 1374 1726 38 217 77 1 18 6 158 6 446 527 9 77 419 85 1 441 229 12 995 95 470 198 1 18 31 708 42 4 160] |
对比
|
旧版 |
keras.preprocessing |
|
新版 |
keras_preprocessing |
IMDB情感分析
|
import urllib.request#用于下载文件 import os#用于确认文件是否存在 import tarfile#用于解压文件
import numpy
folder='data' #如果文件夹不存在,就创建文件夹 if not os.path.exists(folder):os.mkdir(folder) #文件下载地址,斯坦福大学 url='http://ai.stanford.edu/~amaas/data/sentiment/aclImdb_v1.tar.gz' filepath='data/calImdb_v1.tar.gz'#文件存储路径 #如果文件不存在就下载 if not os.path.isfile(filepath): result=urllib.request.urlretrieve(url=url,filename=filepath) print('下载成功',result) #下载成功 ('data/calImdb_v1.tar.gz', <http.client.HTTPMessage object at 0x0000016CB8183D30>)
#解压下载的文件 if not os.path.exists('data/aclImdb'): tfile=tarfile.open(filepath,'r:gz') tfile.extractall('data/') print('解压成功') #导入Tokenizer模块,用于创建Tokenizer字典 from keras.preprocessing.text import Tokenizer #导入sequence模块,用于将字符串取长补短 from keras_preprocessing import sequence
#导入re模块,用于删除文本中的HTML标签 import re def remove_tags(text): reg=re.compile(r'<[^>]+>') #text中匹配的内容全部替换为空字符串,并返回全部替换后的内容 return reg.sub('',text)
def read_files(file_type): path='data/aclImdb/' file_list=[]#文件路径列表 #获取正面评价文件 positive_path=path+file_type+'/pos/' for f in os.listdir(positive_path): file_list.append(positive_path+f) #获取负面评价文件 negative_path=path+file_type+'/neg/' for f in os.listdir(negative_path): file_list.append(negative_path+f) print(f'{file_type}文件列表成功读取,共计{len(file_list)}') #创建标签,前12500个位正面评价项,标签1,后12500项为负面评价,标签0 all_labels=([1]*12500+[0]*12500) #从文件列表读取所有文本内容 all_texts=[] for fi in file_list:#遍历所有文件路径 with open(fi,'r',encoding='utf-8') as file: lines=file.readlines()#读取所有行 text= ' '.join(lines)#连接所有行 text=remove_tags(text)#去除HTML标记 all_texts.append(text)#添加到列表 print(f'{file_type}文件读取成功 labels个数={len(all_labels)},texts个数={len(all_texts)}') return all_labels,all_texts
train_label,train_text=read_files('train') test_label,test_text=read_files('test') train_label=numpy.array(train_label)#将list转换为ndarray test_label=numpy.array(test_label)#将list转换为ndarray # train文件列表成功读取,共计25000 # train文件读取成功 labels个数=25000,texts个数=25000 # test文件列表成功读取,共计25000 # test文件读取成功 labels个数=25000,texts个数=25000 # train_label=numpy.ndarray(test_label)??? # test_label=numpy.ndarray(test_label)??? #查看数据 # print(train_label[12499])#1 # print(train_text[12499])#Working-class romantic... # print(train_label[12500])#0 # print(train_text[12500])#Story of a man who...
#根据文本内容,建立Token字典 token=Tokenizer(num_words=2000) token.fit_on_texts(train_text)
#查看token对象 # #读取的文章数量 # print(token.document_count) # #词汇统计量,按照出现次数由高到低依次排列 # print(token.word_index)#'whelk': 89660, "shite'": 89661} # print(type(token.word_index))#<class 'dict'>
#将文字转化为数字序列sequence train_seq=token.texts_to_sequences(train_text) test_seq=token.texts_to_sequences(test_text)
# print(train_text[0])#Bromwell High is a cartoon comedy. # print(train_seq[0])#[308, 6, 3, 1068, 208, 8, 29, 1, # print(len(train_text[0]))#806 # print(len(train_seq[0]))#106
#截长补短 train=sequence.pad_sequences(train_seq,maxlen=100) test=sequence.pad_sequences(test_seq,maxlen=100)
# print(len(train_seq[0]) )#106 # print(len(train[0]))#100 # print(train_seq[0]) # print(train[0]) # # print(len(train_seq[11]) )#77 # print(len(train[11]))#100 # print(train_seq[11]) # print(train[11])#[ 0 0 0 0 0 0
#创建模型 from keras.models import Sequential from keras.layers.core import Dense,Dropout,Activation,Flatten from keras.layers import Embedding
#加入嵌入层Embedding #嵌入层将数字列表转换为向量格式 # output_dim=32将数字列表转换为32维度的向量 # input_dim=2000词典token的容量2000 # 2000个词转换为onehot格式就是有2000维 # input_length=100输入句子长度,统一转换为200维的数字列表 model=Sequential() model.add(Embedding(output_dim=32,input_dim=2000,input_length=100))#嵌入层 model.add(Dropout(rate=0.2)) #加入多层感知机MLP model.add(Flatten())#平坦层 #256个神经元,激活函数relu model.add(Dense(units=256,activation='relu'))#隐藏层 model.add(Dropout(rate=0.35))#稀疏层 model.add(Dense(units=1,activation='sigmoid'))#输出层 model.summary()#查看模型概述
#训练模型 #loss='binary_crossentropy'损失函数交叉熵 #optimizer='adam'优化器adam #metrics=['accuracy']度量标准 准确率 model.compile(loss='binary_crossentropy',optimizer='adam',metrics=['accuracy'])
#训练 #x=train输入数据 y=train_label标签数据 #epochs=10训练10个周期,batch_size=100每个批次训练100条数据 #verbose=2每训练完成一个周期,就打印一条日志, # validation_split=0.2 将训练数据切分20%用作验证数据 train_history=model.fit(x=train,y=train_label,epochs=10,batch_size=100,verbose=2,validation_split=0.2) #x=test输入数据,y=test_label输入标签, # verbose=1 显示进度条 scores=model.evaluate(x=test,y=test_label,verbose=1) #[0.9706318974494934, 0.8091599941253662] print(scores) predict=model.predict(x=test) print(predict[:10])#[[0.999992 ] [0.9999999 ] [0.01608694] [0.99999934] predict=predict.reshape(-1) sentiment_dict={1:'正面的',0:'负面的'} def show_sentiment(i): print(test_text[i]) print('真实值= ',sentiment_dict[test_label[i]]) print('预测值= ', sentiment_dict[predict[i]])
show_sentiment(22) # Despite the title and unlike some other stories about love and war,... # 真实值= 正面的 # 预测值= 正面的
|
深度模型的关系图

|
jürgen schmidhuber 递归神经网络之父 54岁的Jürgen Schmidhuber出生于德国,是瑞士人工智能实验室(IDSIA)的研发主任,被称为递归神经网络之父。Schmidhuber本人创立的公司Nnaisense正专注于人工智能技术研发。此前,他开发的算法让人类能够与计算机对话,还能让智能手机将普通话翻译成英语。 |
|
|
ACM 2018 图灵奖得主公布,深度学习三巨头 Geoffrey Hinton、Yoshua Bengio 和 Yann LeCun 三人共享此殊荣。此次 ACM 大奖的颁布,一方面让人感叹「终于」、「实至名归」之外,也让人不禁想起 LSTM 之父 JÜRGEN SCHMIDHUBER,他是否也应该获此荣誉呢? 在官方公告中,ACM 介绍说,「因三位巨头在深度神经网络概念和工程上的突破,使得 DNN 成为计算的一个重要构成,从而成为 2018 年图灵奖得主。」 |
 |


|
verbose |
执行日志 |
|
0 |
不输出任何日志信息 |
|
1 |
显示进度条 |
|
2 |
每执行一个epoch输出一条记录 |
Embeddings层的功能是,将“数字列表”转换为“向量列表”;
Dropout层的功能是,每次训练迭代时,会随机的在神经网络中放弃指定比例的神经元,以避免过度拟合overfitting;
深度学习模型
- 多层感知机MLP
- 长短期记忆LSTM
- 递归神经网络RNN


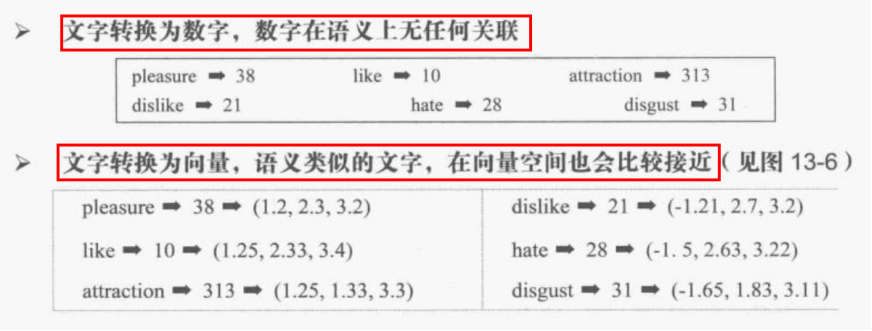
词嵌入是一种自然语言处理技术,其原理是将文字映射成多维几何空间的向量。
语义类似的文字向量在多维的几何克难攻坚的距离也比较相近。
前面我们将“影评文字”转换为数字,但是数字在语义上无任何关联。
为了让每一个文字有关联性,必须转换为向量。
文字数据处理流程图

CIFAR10改进模型
|
Model: "sequential" _________________________________________________________________ Layer (type) Output Shape Param # ================================================================= conv2d (Conv2D) (None, 32, 32, 32) 896
dropout (Dropout) (None, 32, 32, 32) 0
conv2d_1 (Conv2D) (None, 32, 32, 32) 9248
max_pooling2d (MaxPooling2D (None, 16, 16, 32) 0 )
conv2d_2 (Conv2D) (None, 16, 16, 64) 18496
dropout_1 (Dropout) (None, 16, 16, 64) 0
conv2d_3 (Conv2D) (None, 16, 16, 64) 36928
max_pooling2d_1 (MaxPooling (None, 8, 8, 64) 0 2D)
conv2d_4 (Conv2D) (None, 8, 8, 128) 73856
dropout_2 (Dropout) (None, 8, 8, 128) 0
conv2d_5 (Conv2D) (None, 8, 8, 128) 147584
max_pooling2d_2 (MaxPooling (None, 4, 4, 128) 0 2D)
flatten (Flatten) (None, 2048) 0
dropout_3 (Dropout) (None, 2048) 0
dense (Dense) (None, 2500) 5122500
dropout_4 (Dropout) (None, 2500) 0
dense_1 (Dense) (None, 1500) 3751500
dropout_5 (Dropout) (None, 1500) 0
dense_2 (Dense) (None, 10) 15010
================================================================= Total params: 9,176,018 Trainable params: 9,176,018 Non-trainable params: 0 _________________________________________________________________ |
优化后的CNN结构
卷积层1 ①卷积 ②Dropout ③卷积 ④池化
卷积层2 ①卷积 ②Dropout ③卷积 ④池化
卷积层3 ①卷积 ②Dropout ③卷积 ④池化
神经网络 ①平坦层 ②Dropout ③全连接 ④Dropout ⑤全连接 ⑥Dropout ⑦输出 |
三层卷积的模型
|
# 导入包 import os.path from keras.datasets import cifar10 import numpy as np
np.random.seed(10) import matplotlib.pyplot as plt
# 下载数据集 (x_img_train, y_label_train), (x_img_test, y_label_test) = cifar10.load_data() print('train img shape', x_img_train.shape) print('train label shape', y_label_train.shape) print('test img shape', x_img_test.shape) print('test label shape', y_label_test.shape) # train img shape (50000, 32, 32, 3) # train label shape (50000, 1) # test img shape (10000, 32, 32, 3) # test label shape (10000, 1) # 图片数据归一化 x_img_train_normalize = x_img_train.astype('float32') / 255.0 x_img_test_normalize = x_img_test.astype('float32') / 255.0 # 标签数据独热码 from keras.utils import np_utils
y_label_train_onehot = np_utils.to_categorical(y_label_train) y_label_test_onehot = np_utils.to_categorical(y_label_test) # 导入模型容器 from keras.models import Sequential # 导入层 from keras.layers import Dense, Dropout, Activation, Flatten from keras.layers import Conv2D, MaxPooling2D, ZeroPadding2D
# 创建模型 model = Sequential() # 添加卷积层1 # filters=32随机生成32种滤镜 #不同的滤镜分别对图像进行卷积运算,就会产生不同的图片 #filters个数就是输出的图片个数 # kernel_size=(3,3)卷积核大小3*3 #卷积运算不会改变图片分辨率,也不会改变图片个数 # input_shape=(32,32,3)输入图像尺寸,32*32像素,3原色 # activation='relu'激活函数为relu # padding='same'表示卷积后的图片大小与原图相同 # 卷积运算不会改变图像大小,仍为32*32 model.add(Conv2D(filters=32, kernel_size=(3, 3), input_shape=(32, 32, 3), activation='relu', padding='same')) # 加入Dropout层,避免过拟合 model.add(Dropout(rate=0.3)) #增加一个卷积层 model.add(Conv2D(filters=32, kernel_size=(3, 3), activation='relu', padding='same')) # 池化层,池化层会减小图片分辨率 #pool_size=(2, 2)单个维度上看,将水平方向和垂直方向的像素个数分别减半 #从整体上看,每4个为一个池子,取池子中的最大值代表该池子的值,也就是最大池化 #池化可以提取更加宏观的特征,同时可以大幅减小数据处理量 # 缩减采样/下采样/降采样 # pool_size=(2,2)将32*32图像缩减为16*16 # 图像个数不变,仍为32 model.add(MaxPooling2D(pool_size=(2, 2)))
# 添加卷积层2 # filters=64创建64个滤镜,将原来的32个图像变为64个 model.add(Conv2D(filters=64, kernel_size=(3, 3), activation='relu', padding='same')) # 加入Dropout层,避免过拟合 # 随机放弃25%的神经元 model.add(Dropout(rate=0.3)) #增加一个卷积层 model.add(Conv2D(filters=64, kernel_size=(3, 3), activation='relu', padding='same')) # 缩减采样,将16*16的图像编程8*8 model.add(MaxPooling2D(pool_size=(2, 2))) #卷积层3 # filters滤镜个数会改变图片个数 # MaxPooling缩减采样不会改变图片个数,但是会改变图像分辨率 # Conv2D卷积运算不会改变图像分辨率,也不会改变图片个数,但是能够从中提取图片特征
model.add(Conv2D(filters=128,kernel_size=(3,3),activation='relu',padding='same')) model.add(Dropout(rate=0.3)) model.add(Conv2D(filters=128,kernel_size=(3,3),activation='relu',padding='same')) model.add(MaxPooling2D(pool_size=(2,2))) # 平坦层,将64个8*8的图片编程1维向量8*8*64=4096 model.add(Flatten()) model.add(Dropout(rate=0.3)) # 建立隐藏层,共1024个神经元 model.add(Dense(units=2500, activation='relu')) model.add(Dropout(rate=0.3)) model.add(Dense(units=1500, activation='relu')) model.add(Dropout(rate=0.3)) # 输出层,神经元个数10,对应10种分类结果 model.add(Dense(units=10, activation='softmax'))
print(model.summary())
# 模型设置/装配 model.compile(loss='categorical_crossentropy', optimizer='adam', metrics=['accuracy']) # 训练模型 # x标准化的图片特征值作为输入 # y图片标签值,onehot格式 # validation_split验证集数据切分比例,将训练集中的20%作为验证数据,80%作为训练数据 # epochs=10执行10个训练周期 # batch_size=128每个训练批次,输入128个图片数据 # verbose=2显示训练过程+
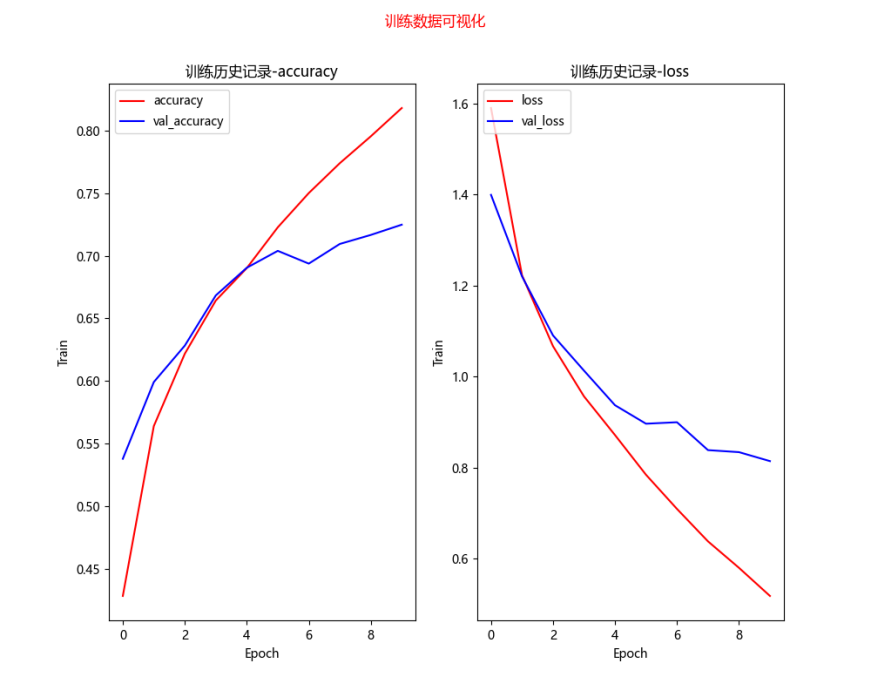
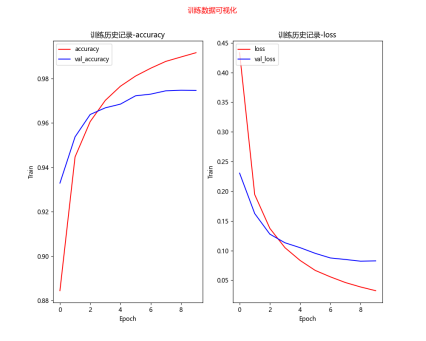
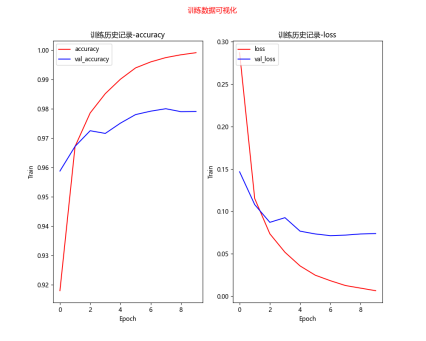
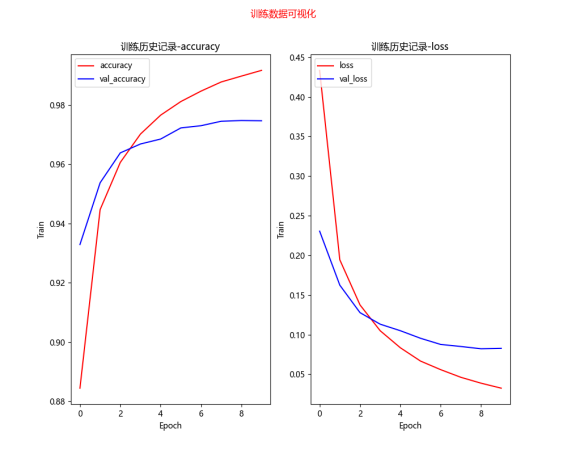
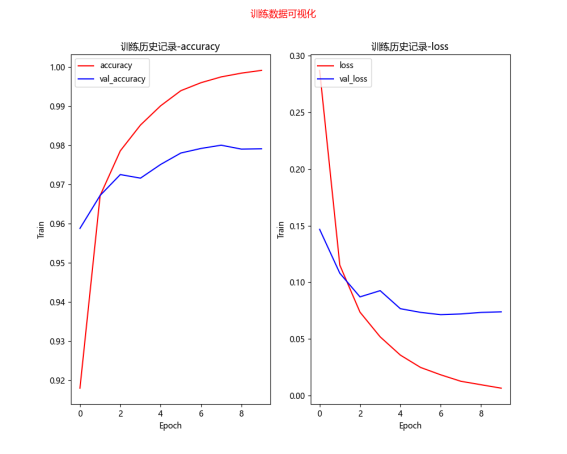
# 训练结果可视化 def show_train_history(train_history): fig = plt.gcf() # 构造一个图表 fig.set_size_inches(10, 8) # 设置图表尺寸,英寸为单位 fig.suptitle('训练数据可视化', color='red') ax1 = plt.subplot(1, 2, 1) # 1行2列的第一个子图表 # 训练数据-准确度 ax1.plot(train_history.history['accuracy'], c='red') # 验证数据-准确度 ax1.plot(train_history.history['val_accuracy'], c='blue') ax1.set_title('训练历史记录-accuracy') # 设置子图表1的标题 ax1.set_xlabel('Epoch') # x轴标签 ax1.set_ylabel('Train') # y轴标签 # 设置子图表1的图例 ax1.legend(['accuracy', 'val_accuracy'], loc='upper left') ax2 = plt.subplot(1, 2, 2) # 1行2列的第二个子图表 # 训练数据-损失值 ax2.plot(train_history.history['loss'], c='red') # 验证数据-损失值 ax2.plot(train_history.history['val_loss'], c='blue') ax2.set_title('训练历史记录-loss') # 设置子图表2的标题 ax2.set_xlabel('Epoch') # x轴标签 ax2.set_ylabel('Train') # y轴标签 # 设置子图表2的图例 ax2.legend(['loss', 'val_loss'], loc='upper left')
plt.show() # 绘制图表
#将训练号的数据保存到本地,避免重复训练 folder = 'save_model' data_path = folder + '\\' + 'cifar10_model_data3.h5' if not os.path.exists(folder): os.mkdir(folder)
try: model.load_weights(data_path) # train_history=model.history print('模型加载成功', data_path) except: print('模型加载失败,开始一个新的训练', data_path) train_history = model.fit(x_img_train_normalize, y_label_train_onehot, validation_split=0.2, epochs=50, batch_size=300, verbose=2) model.save_weights(data_path) print('模型保存成功', data_path) # 绘制训练历史数据图像 show_train_history(train_history)
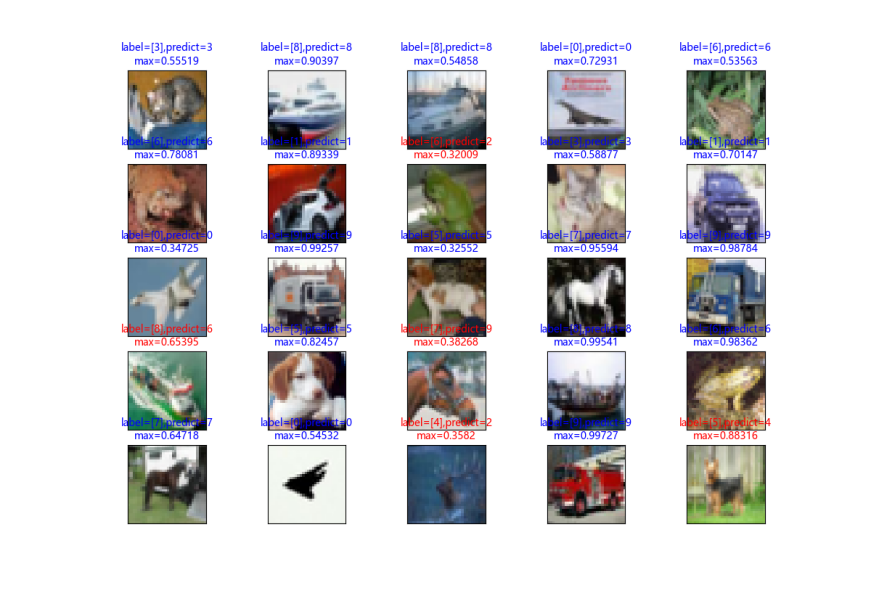
# 模型准确率评估 scores = model.evaluate(x_img_test_normalize, y_label_test_onehot, verbose=0) # 预测 predictions = model.predict(x_img_test_normalize) print('测试得分为') print(scores) # 打印准确率数据 #2层训练10次 [0.8053444623947144, 0.725600004196167] 验证集准确率、测试集准确率 #3层训练10次 [0.6961806416511536, 0.760699987411499]验证集准确率、测试集准确率 #3层训练50次[0.805533230304718, 0.796999990940094]验证集准确率、测试集准确率 # 显示系列图片及其标签,和预测值(如有) def plot_images(images, labels, predics, idx, num=10): fig = plt.gcf() # 构造一个图表 fig.set_size_inches(12, 14) # 设置图表尺寸,英寸为单位 if num > 25: num = 25 # 最多显示25张子图 for i in range(num): ax = plt.subplot(5, 5, 1 + i) # 绘制子图,5行5列中的第i+1个 ax.imshow(images[idx], cmap='binary') # 显示图片 以二维矩阵的形式传递图片数据 binary表示灰度显示 title = f'label={labels[idx]}' # 设置子标题 color = 'blue' # 标题颜色 默认blue if predics is not None: # 如有预测信息,则一并显示 index = np.argmax(predics[idx]) # 最大值索引,即预测值 val = str(round(max(predics[idx]), 5)) # 概率 title += f',predict={index}\nmax={val}' # 标题 if labels[idx] != index: color = 'red' # 预测错误,标题红色 ax.set_title(title, color=color, fontsize=10) # 设置子标题 ax.set_xticks([]) # 设置x轴刻度为空,即不显示x轴刻度 ax.set_yticks([]) idx += 1 # 下一个 plt.show() # 显示整个图表
# 预测结果可视化 # 预测数据可视化 # 下标从0开始,共显示25项数据 plot_images(x_img_test, y_label_test, predictions, idx=0, num=25)
# 可以从pandas创建混淆矩阵 # 混淆矩阵的输入必须是一维的 # 在创建混淆矩阵之前,必须查看确认输入参数的维度 print(predictions.shape) print(y_label_test.shape)
# 独热码转换为普通码 def onehot_convert(predict): res = [] for p in predict: res.append(np.argmax(p)) return res
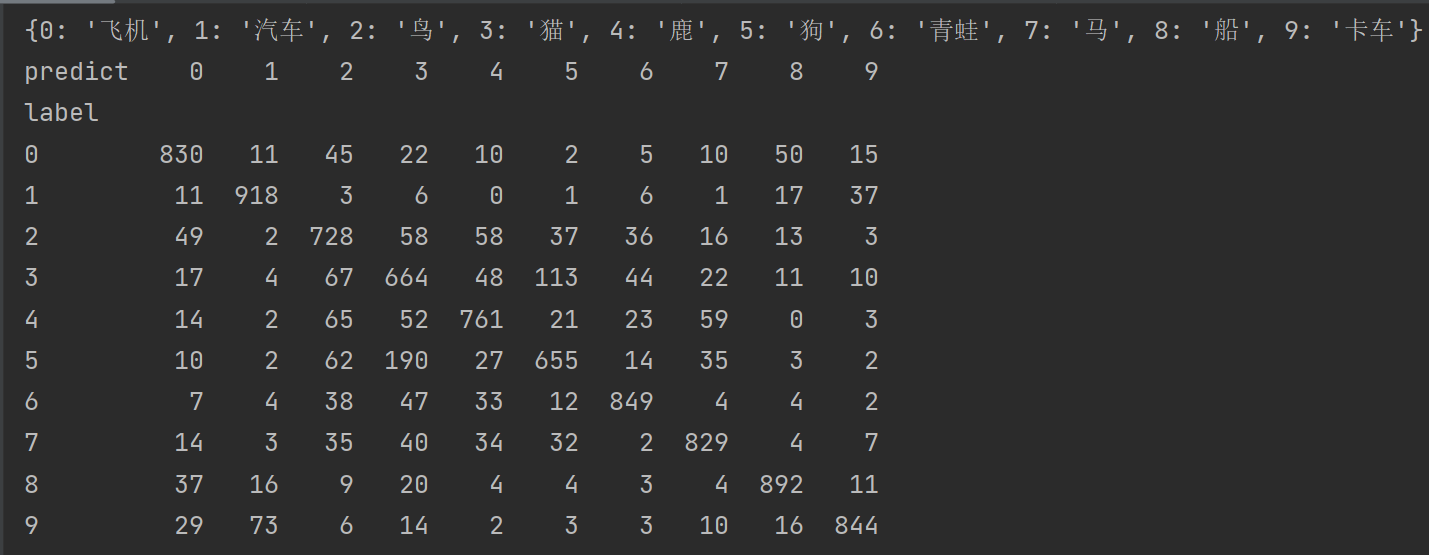
pre = onehot_convert(predictions) label_test = y_label_test.reshape(-1) import pandas as pd label_dict={0:'飞机',1:'汽车',2:'鸟',3:'猫',4:'鹿',5:'狗',6:'青蛙',7:'马',8:'船',9:'卡车'} crosstab = pd.crosstab(label_test, pre, rownames=['label'], colnames=['predict']) print(label_dict) print(crosstab)
测试得分为
|

CIFAR预测结果的混淆矩阵
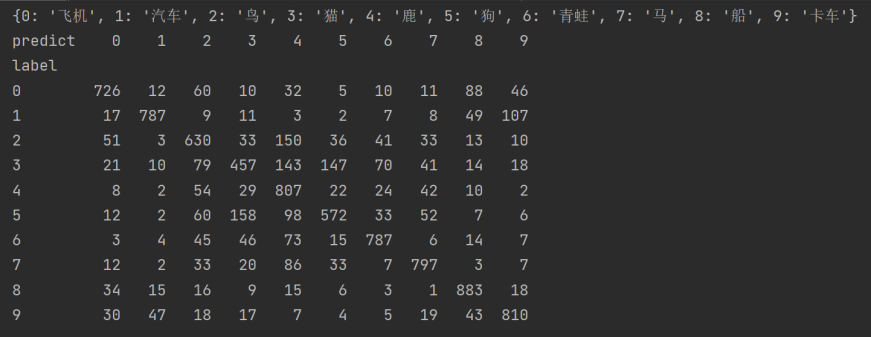
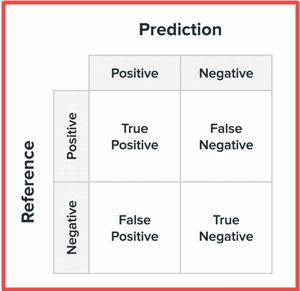
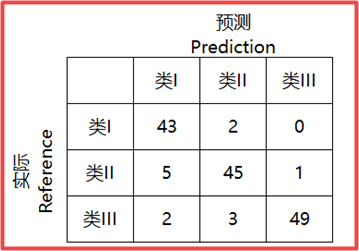
混淆矩阵=误差矩阵=匹配矩阵
True Positive(TP):真正类。样本的真实类别是正类,并且模型识别的结果也是正类。
False Negative(FN):假负类。样本的真实类别是正类,但是模型将其识别为负类。
False Positive(FP):假正类。样本的真实类别是负类,但是模型将其识别为正类。
True Negative(TN):真负类。样本的真实类别是负类,并且模型将其识别为负类。
从混淆矩阵当中,可以得到更高级的分类指标:Accuracy(精确率),Precision(正确率或者准确率),Recall(召回率),Specificity(特异性),Sensitivity(灵敏度)。
Bert:Bidirectional Encoder Representations from Transformers
一种从Transformers模型得来的双向编码表征模型。
论文地址https://arxiv.org/pdf/1810.04805
word2vec介绍《Efficient Estimation of Word Representations inVector Space》
word2vec是一种将word转为向量的方法,其包含两种算法,分别是skip-gram和CBOW,它们的最大区别是skip-gram是通过中心词去预测中心词周围的词,而CBOW是通过周围的词去预测中心词。
CRF如何提取特征?
CRF中有两类特征函数,分别是状态特征和转移特征,状态特征用当前节点(某个输出位置可能的状态中的某个状态称为一个节点)的状态分数表示,转移特征用上一个节点到当前节点的转移分数表示。
什么是CRF?
CRF,全称 Conditional Random Fields,中文名:条件随机场。是给定一组输入序列的条件下,另一组输出序列的条件概率分布模型。
什么是随机场?
我们先来说什么是随机场。
The collection of random variables is called a stochastic process.A stochastic process that is indexed by a spatial variable is called a random field.
随机变量的集合称为随机过程。由一个空间变量索引的随机过程,称为随机场。
为什么叫条件随机场?
条件随机场(CRF),就是给定了一组观测状态(照片可能的状态/可能出现的词)下的马尔可夫随机场。也就是说CRF考虑到了观测状态这个先验条件,这也是条件随机场中的条件一词的含义。
pre-training预训练
fine-tuning微调
masked-LM=MLM
MLM掩码语言模型(Masked Language Model)
词嵌入word embedding
这种将高维度的词表示转换为低维度的词表示的方法,我们称之为词嵌入(word embedding)。
CSV文件=comma-separated value=逗号分隔值 文件格式
h5文件=Hierarchical Data Format层次数据文件格式
Hierarchical英 [ˌhaɪəˈrɑːkɪk(ə)l] 美 [ˌhaɪəˈrɑːrkɪkl]
adj. 分等级的,等级制度的 层次
GLUE (General Lanuage Understanding Evaluation)
GLUE基准测试是一系列不同的自然语言理解任务。
embedding 英 [ɪmˈbedɪŋ] 美 [ɪmˈbedɪŋ] 把(物体)嵌入
Corpus英 [ˈkɔːpəs] 美 [ˈkɔːrpəs]n. 文集,全集;语料库;
Masked英 [mɑːskt] 美 [mæskt] 掩饰;给……戴面具;遮蔽;盖住(气味等);(涂刷时)掩盖(mask 的过去式及过去分词)蒙面 遮掩的 隐藏的
为了训练一个深度双向表征,作者简单的随机mask一些百分比的输入tokens,然后预测那些被mask掉的tokens。
这一步称为“masked-LM”(MLM),尽管在文献中它通常被称为完型填空任务(Cloze task)。
CIFAR10数据集 项目实战
|
#导入包 import os.path from keras.datasets import cifar10 import numpy as np np.random.seed(10) import matplotlib.pyplot as plt
# 下载数据集 (x_img_train, y_label_train), (x_img_test, y_label_test) = cifar10.load_data() print('train img shape', x_img_train.shape) print('train label shape', y_label_train.shape) print('test img shape', x_img_test.shape) print('test label shape', y_label_test.shape) # train img shape (50000, 32, 32, 3) # train label shape (50000, 1) # test img shape (10000, 32, 32, 3) # test label shape (10000, 1) # 图片数据归一化 x_img_train_normalize = x_img_train.astype('float32') / 255.0 x_img_test_normalize = x_img_test.astype('float32') / 255.0 # 标签数据独热码 from keras.utils import np_utils
y_label_train_onehot = np_utils.to_categorical(y_label_train) y_label_test_onehot = np_utils.to_categorical(y_label_test) # 导入模型容器 from keras.models import Sequential # 导入层 from keras.layers import Dense, Dropout, Activation, Flatten from keras.layers import Conv2D, MaxPooling2D, ZeroPadding2D
# 创建模型 model = Sequential() # 添加卷积层1 # filters=32随机生成32种滤镜 # kernel_size=(3,3)卷积核大小3*3 # input_shape=(32,32,3)输入图像尺寸,32*32像素,3原色 # activation='relu'激活函数为relu # padding='same'表示卷积后的图片大小与原图相同 # 卷积运算不会改变图像大小,仍为32*32 model.add(Conv2D(filters=32, kernel_size=(3, 3), input_shape=(32, 32, 3), activation='relu', padding='same')) # 加入Dropout层,避免过拟合 model.add(Dropout(rate=0.25)) # 池化层 # 缩减采样/下采样/降采样 # pool_size=(2,2)将32*32图像缩减为16*16 # 图像个数不变,仍为32 model.add(MaxPooling2D(pool_size=(2, 2)))
# 添加卷积层2 # filters=64创建64个滤镜,将原来的32个图像变为64个 model.add(Conv2D(filters=64, kernel_size=(3, 3), activation='relu', padding='same')) # 加入Dropout层,避免过拟合 # 随机放弃25%的神经元 model.add(Dropout(rate=0.25)) # 缩减采样,将16*16的图像编程8*8 model.add(MaxPooling2D(pool_size=(2, 2))) # 平坦层,将64个8*8的图片编程1维向量8*8*64=4096 model.add(Flatten()) model.add(Dropout(rate=0.25)) # 建立隐藏层,共1024个神经元 model.add(Dense(units=1024, activation='relu')) model.add(Dropout(rate=0.25)) # 输出层,神经元个数10,对应10种分类结果 model.add(Dense(units=10, activation='softmax'))
print(model.summary())
# 模型设置/装配 model.compile(loss='categorical_crossentropy', optimizer='adam',metrics=['accuracy']) # 训练模型 # x标准化的图片特征值作为输入 # y图片标签值,onehot格式 # validation_split验证集数据切分比例,将训练集中的20%作为验证数据,80%作为训练数据 # epochs=10执行10个训练周期 # batch_size=128每个训练批次,输入128个图片数据 # verbose=2显示训练过程+ folder='save_model' data_path=folder+'\\'+'cifar10_model_data.h5' if not os.path.exists(folder):os.mkdir(folder) train_history=None try : model.load_weights(data_path) # train_history=model.history print('模型加载成功',data_path) except: print('模型加载失败,开始一个新的训练', data_path) train_history = model.fit(x_img_train_normalize, y_label_train_onehot, validation_split=0.2, epochs=10, batch_size=128, verbose=2) model.save_weights(data_path) print('模型保存成功', data_path)
# 训练结果可视化 def show_train_history(train_history): fig = plt.gcf() # 构造一个图表 fig.set_size_inches(10, 8) # 设置图表尺寸,英寸为单位 fig.suptitle('训练数据可视化', color='red') ax1 = plt.subplot(1, 2, 1) # 1行2列的第一个子图表 # 训练数据-准确度 ax1.plot(train_history.history['accuracy'], c='red') # 验证数据-准确度 ax1.plot(train_history.history['val_accuracy'], c='blue') ax1.set_title('训练历史记录-accuracy') # 设置子图表1的标题 ax1.set_xlabel('Epoch') # x轴标签 ax1.set_ylabel('Train') # y轴标签 # 设置子图表1的图例 ax1.legend(['accuracy', 'val_accuracy'], loc='upper left') ax2 = plt.subplot(1, 2, 2) # 1行2列的第二个子图表 # 训练数据-损失值 ax2.plot(train_history.history['loss'], c='red') # 验证数据-损失值 ax2.plot(train_history.history['val_loss'], c='blue') ax2.set_title('训练历史记录-loss') # 设置子图表2的标题 ax2.set_xlabel('Epoch') # x轴标签 ax2.set_ylabel('Train') # y轴标签 # 设置子图表2的图例 ax2.legend(['loss', 'val_loss'], loc='upper left')
plt.show() # 绘制图表
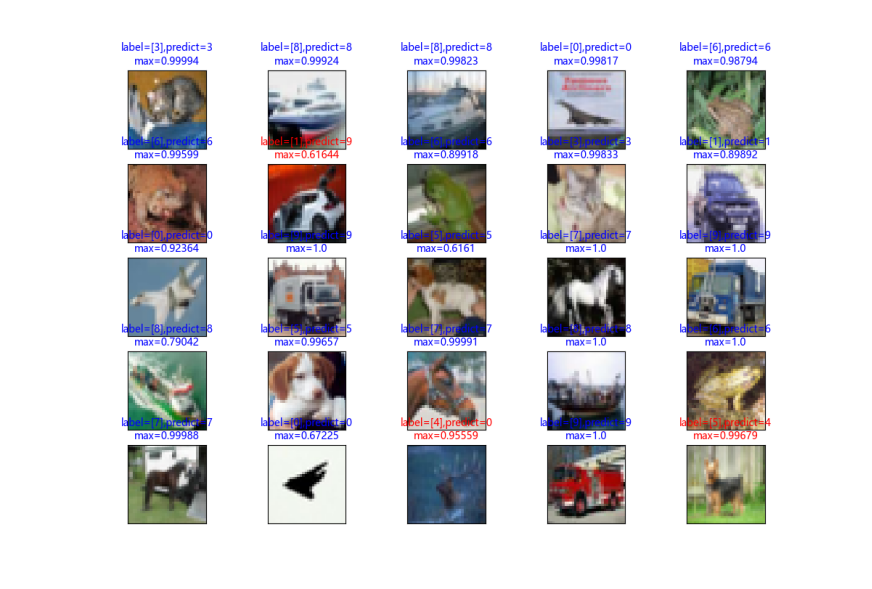
# 绘制训练历史数据图像 # show_train_history(train_history) # 模型准确率评估 scores = model.evaluate(x_img_test_normalize, y_label_test_onehot, verbose=0) #预测 predictions=model.predict(x_img_test_normalize) print('测试得分为') print(scores) # 打印准确率数据 #[0.8053444623947144, 0.725600004196167] 验证集准确率、测试集准确率 # 显示系列图片及其标签,和预测值(如有) def plot_images(images, labels, predics, idx, num=10): fig = plt.gcf() # 构造一个图表 fig.set_size_inches(12, 14) # 设置图表尺寸,英寸为单位 if num > 25: num = 25 # 最多显示25张子图 for i in range(num): ax = plt.subplot(5, 5, 1 + i) # 绘制子图,5行5列中的第i+1个 ax.imshow(images[idx], cmap='binary') # 显示图片 以二维矩阵的形式传递图片数据 binary表示灰度显示 title = f'label={labels[idx]}' # 设置子标题 color = 'blue' # 标题颜色 默认blue if predics is not None: # 如有预测信息,则一并显示 index = np.argmax(predics[idx]) # 最大值索引,即预测值 val = str(round(max(predics[idx]), 5)) # 概率 title += f',predict={index}\nmax={val}' # 标题 if labels[idx] != index: color = 'red' # 预测错误,标题红色 ax.set_title(title, color=color, fontsize=10) # 设置子标题 ax.set_xticks([]) # 设置x轴刻度为空,即不显示x轴刻度 ax.set_yticks([]) idx += 1 # 下一个 plt.show() # 显示整个图表
#预测结果可视化 # 预测数据可视化 # 下标从0开始,共显示25项数据 plot_images(x_img_test, y_label_test, predictions, idx=0, num=25)
|
池化(Pooling)是卷积神经网络中的一个重要的概念,它实际上是一种形式的降采样。有多种不同形式的非线性池化函数,而其中“最大池化(Max pooling)”是最为常见的。它是将输入的图像划分为若干个矩形区域,对每个子区域输出最大值。直觉上,这种机制能够有效的原因在于,在发现一个特征之后,它的精确位置远不及它和其他特征的相对位置的关系重要。池化层会不断地减小数据的空间大小,因此参数的数量和计算量也会下降,这在一定程度上也控制了过拟合。通常来说,CNN的卷积层之间都会周期性地插入池化层。
池化层通常会分别作用于每个输入的特征并减小其大小。目前最常用形式的池化层是每隔2个元素从图像划分出的区块,然后对每个区块中的4个数取最大值。这将会减少75%的数据量。
除了最大池化之外,池化层也可以使用其他池化函数,例如“平均池化”甚至“L2-范数池化”等。
池化操作(Pooling)是CNN中非常常见的一种操作,Pooling层是模仿人的视觉系统对数据进行降维,池化操作通常也叫做子采样(Subsampling)或降采样(Downsampling),在构建卷积神经网络时,往往会用在卷积层之后,通过池化来降低卷积层输出的特征维度,有效减少网络参数的同时还可以防止过拟合现象。
最大池化MaxPooling
平均池化AvgPooling=Average Pooling
主要功能有以下几点:
- 抑制噪声,降低信息冗余
- 提升模型的尺度不变性、旋转不变形
- 降低模型计算量
- 防止过拟合
下图为最大池化过程的示意图:
convolution英 [ˌkɒnvəˈluːʃn] 美 [ˌkɑːnvəˈluːʃn]
- [数] 卷积;回旋;盘旋;卷绕

手写数字识别项目(实战)
|
# 导入依赖包 import numpy as np import tensorflow as tf import pandas as pd from keras.utils import np_utils from keras.datasets import mnist import matplotlib.pyplot as plt from keras.layers import Dropout # 防止过拟合的层
np.random.seed(10) # 下载数据 (train_image, train_label), (test_image, test_label) = mnist.load_data() # 查看数据信息 print(type(train_image)) print(type(train_label)) # <class 'numpy.ndarray'> # <class 'numpy.ndarray'> print('train_image.shape=', train_image.shape) print('train_label.shape=', train_label.shape) print('test_image.shape=', test_image.shape) print('test_label.shape=', test_label.shape)
# train_image.shape= (60000, 28, 28) # train_label.shape= (60000,) # test_image.shape= (10000, 28, 28) # test_label.shape= (10000,)
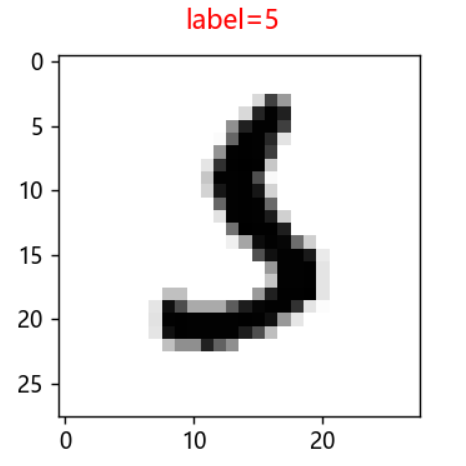
# 显示单个图片及其标签 def plot_image(image, label): fig = plt.gcf() fig.set_size_inches(3, 3) fig.suptitle(f'label={label}', color='red') plt.imshow(image, cmap='binary') plt.show()
# 显示单个图片及其标签 # print(train_image[0]) # plot_image(train_image[0],train_label[0])
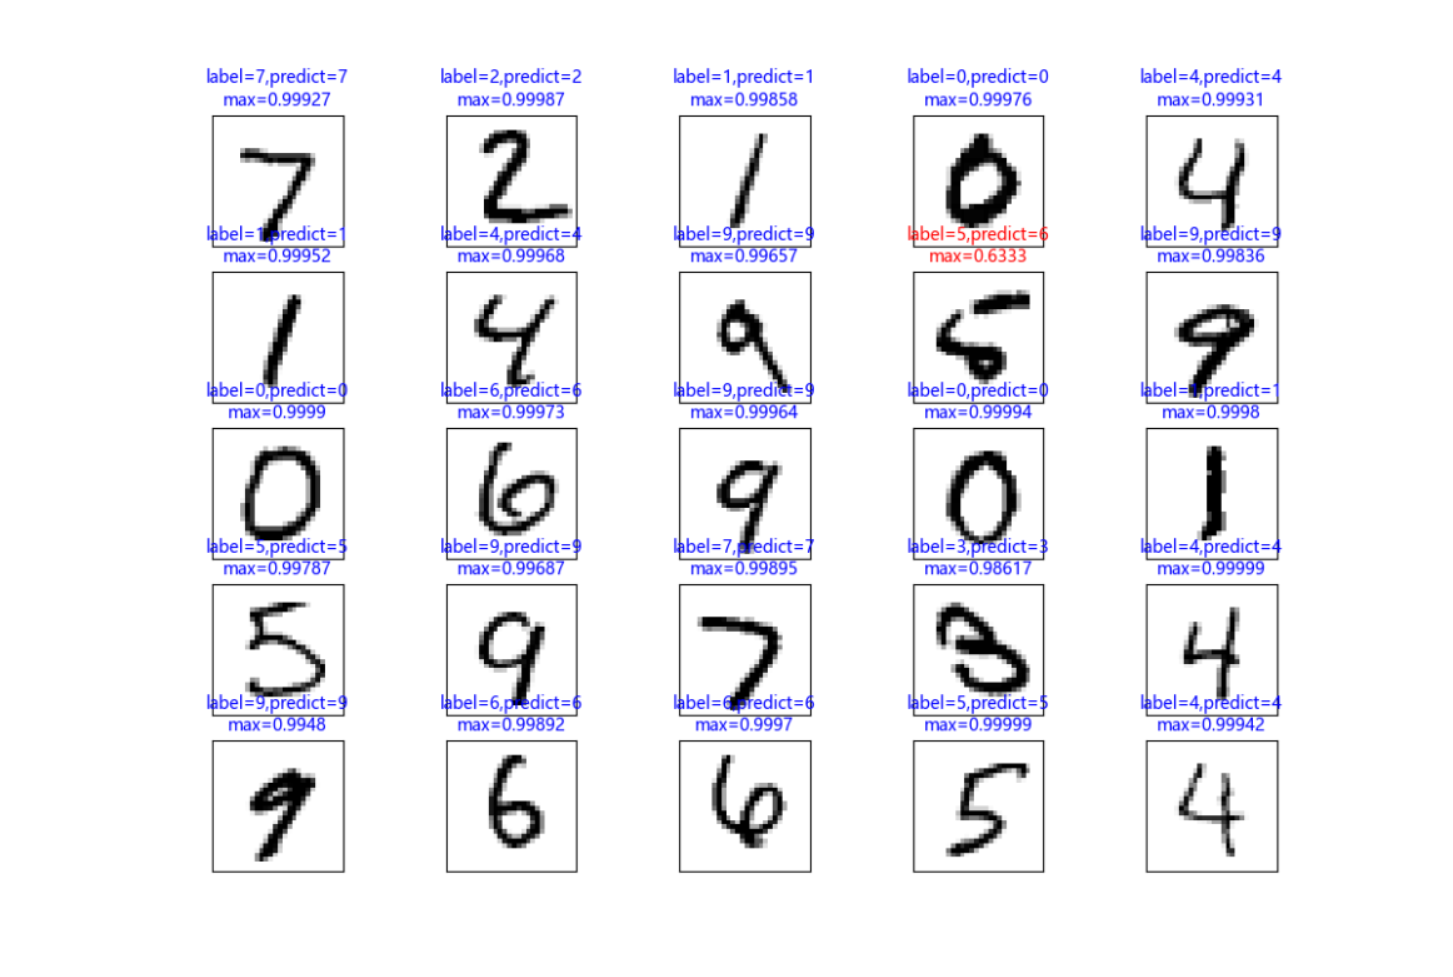
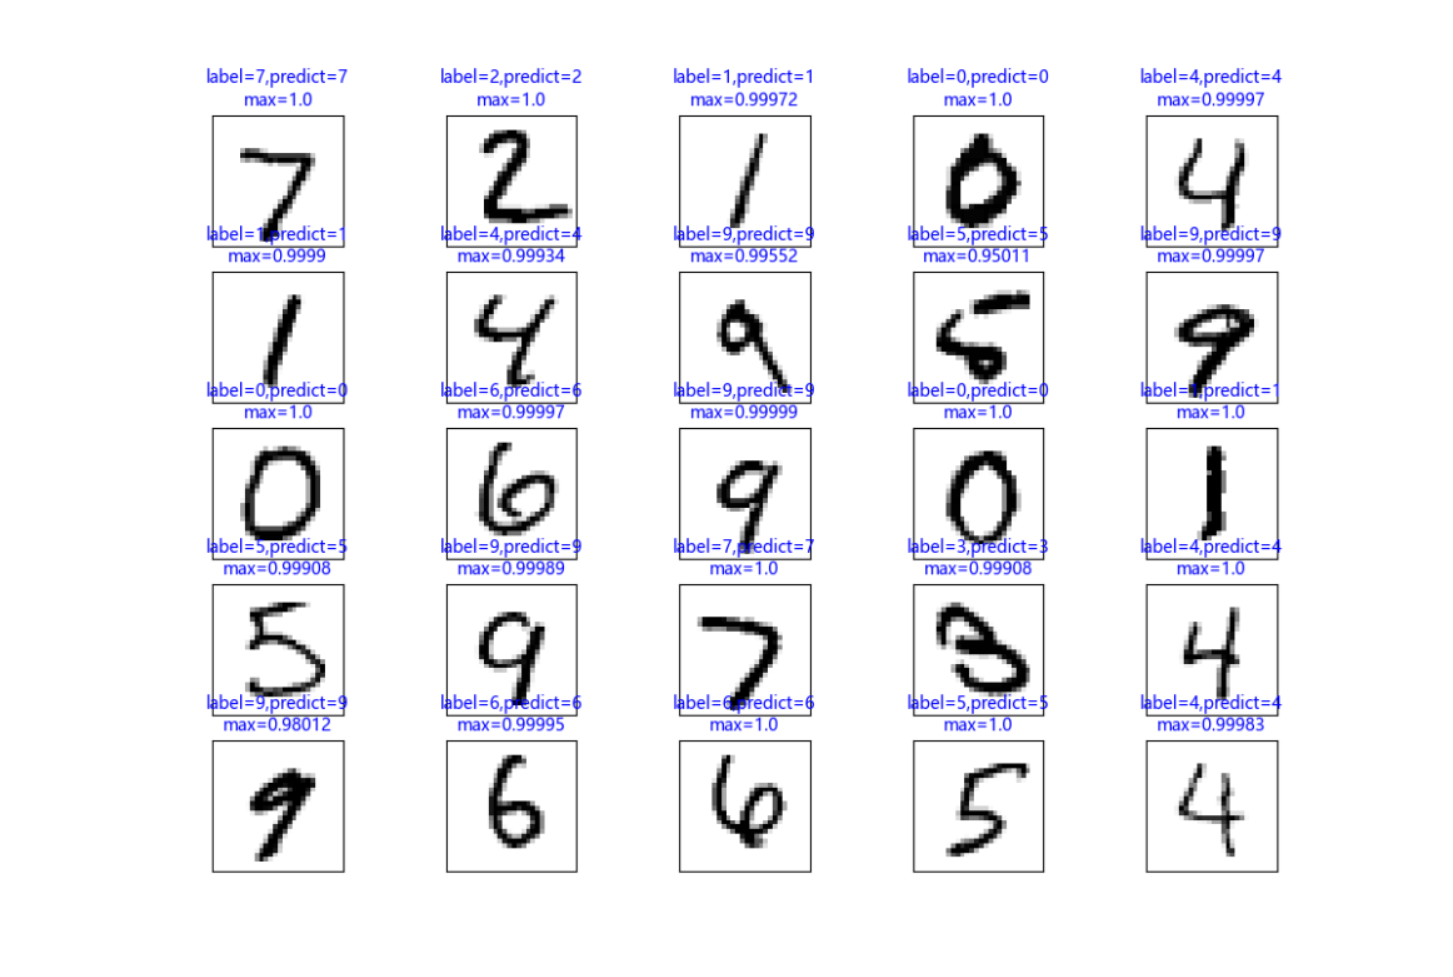
# 显示系列图片及其标签,和预测值(如有) def plot_images(images, labels, predics, idx, num=10): fig = plt.gcf() # 构造一个图表 fig.set_size_inches(12, 14) # 设置图表尺寸,英寸为单位 if num > 25: num = 25 # 最多显示25张子图 for i in range(num): ax = plt.subplot(5, 5, 1 + i) # 绘制子图,5行5列中的第i+1个 ax.imshow(images[idx], cmap='binary') # 显示图片 以二维矩阵的形式传递图片数据 binary表示灰度显示 title = f'label={labels[idx]}' # 设置子标题 color = 'blue' # 标题颜色 默认blue if predics is not None: # 如有预测信息,则一并显示 index = np.argmax(predics[idx]) # 最大值索引,即预测值 val = str(round(max(predics[idx]), 5)) # 概率 title += f',predict={index}\nmax={val}' # 标题 if labels[idx] != index: color = 'red' # 预测错误,标题红色 ax.set_title(title, color=color, fontsize=10) # 设置子标题 ax.set_xticks([]) # 设置x轴刻度为空,即不显示x轴刻度 ax.set_yticks([]) idx += 1 # 下一个 plt.show() # 显示整个图表
# 显示系列图片及其标签 # plot_images(train_image,train_label,None,100,num=25)
# 对图片数据集进行预处理 # 三维张量改成二维张量 # 第一维不变,第二维变成原第二维和第三维的乘积 # 数据类型转换为float32 print(train_image.shape) # (60000, 28, 28) x_train = train_image.reshape(train_image.shape[0], train_image.shape[1] * train_image.shape[2]).astype('float32') print(x_train.shape) # (60000, 784) print(test_image.shape) # (10000, 28, 28) x_test = test_image.reshape(test_image.shape[0], test_image.shape[1] * test_image.shape[2]).astype('float32') print(x_test.shape) # (10000, 784) print(x_train[0]) # 图像数据归一化,将数据值转换为0-1之间的小数 x_train_norm = x_train / 255 x_test_norm = x_test / 255 print(x_train_norm[0]) # 标签数据预处理,转换为独热码onehot print(train_label[:5]) # [5 0 4 1 9] y_train_onehot = np_utils.to_categorical(train_label) y_test_onehot = np_utils.to_categorical(test_label) print(y_train_onehot[:5]) # [0. 0. 0. 0. 0. 1. 0. 0. 0. 0.]=5
# ■■■建立多层感知模型■■■ # Sequential是线型堆叠容器,相当于多层蛋糕,一层叠一层 # Dense表示浓密的稠密的层,意为连接很稠密的意思,也就是全连接层 from keras.models import Sequential # 模型容器 多层蛋糕 from keras.layers import Dense # 密集层 全连接层
# 建立线型堆叠/多层蛋糕模型 model = Sequential() # 建立输入层input layer和隐藏层hidden layer # 隐藏层神经元个数256,输入层神经元个数784 # 数据初始化采用正态分布的随机数 # normal distribution正态分布随机数 # 初始化的参数包括权重参数weight和偏差参数bias # 指定激活函数为relu热卤 model.add(Dense(units=1000, input_dim=784, kernel_initializer='normal', activation='relu'))
#增加DropOut层,避免过拟合 model.add(Dropout(0.5))
#增加第二个隐藏层,同时增加DropOut层 model.add(Dense(units=1000, kernel_initializer='normal', activation='relu')) model.add(Dropout(0.5)) # 建立输出层 # 输出层神经元个数10 # 数据初始化此阿勇正态分布随机数normal # 初始化的参数包括权重参数weight和偏差参数bias # 定义激活函数为softmax model.add(Dense(units=10, kernel_initializer='normal', activation='softmax')) # 查看模型的【摘要summary】 print(model.summary())
# 模型训练,指定训练方式,也就是模型装配compile # 损失函数指定为【交叉熵】 # 优化器指定为adam,Adam=Adaptive Moment Estimation,自适应矩估计 # 使用Adam优化器可以使模型更快的收敛,并提高准确率 # metrics设置评估模型的方式是准确率accuracy model.compile(loss='categorical_crossentropy', optimizer='adam', metrics=['accuracy']) # 开始训练
# x输入数据,图像的特征值feature # y数字图像真实值label # validation_split训练数据与验证数据比例,验证数据占训练集的比例为20% # 训练集共60000项数据,将采用其中的60000*0.2=12000项作为验证数据 # epochs轮回次数/轮数,执行10个训练周期 # batch_size每一个批次训练数据个数 # verbose=2 表示显示训练过程 # verbose 0 = silent静默, 1 = progress bar进度条, 2 = one line per epoch每次轮回显示一行数据. # fit=拟合、匹配,overfitting=过拟合 underfittin=欠拟合 train_history = model.fit(x=x_train_norm, y=y_train_onehot, validation_split=0.2, epochs=10, batch_size=200, verbose=2) # train_history数据类型是keras.callbacks.History object # 包含如下字段:epoch、history、model、params、validation_data # epoch是一个训练次数列表,[0, 1, 2, 3, 4, 5, 6, 7, 8, 9] # history是一个字典,包含了训练的历史数据, # history包括4个键 accuracy,val_accuracy,loss,val_loss # 分别是训练数据准确率,验证数据准确率,训练数据损失值,验证数据损失值 # 每个键对应的值都是一个列表,列表元素个数等于输出层神经元个数10 # 'val_loss' = {list: 10} [0.22753198444843292, ...] # history = {dict: 4} {'loss': [0.43830350041389465, ...]
# model是模型数据,包括相当多的信息,例如正则化项 activity_regularizer = {NoneType} None # 参数params = {dict: 3} {'verbose': 2, 'epochs': 10, 'steps': 240} # validation_data = {NoneType} None
print('训练历史数据\n', train_history)
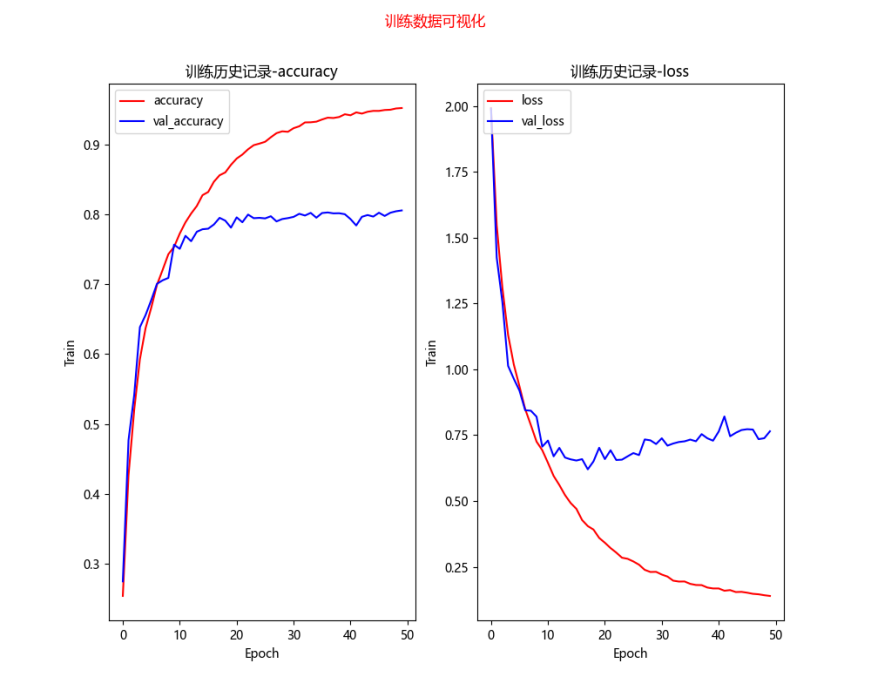
# 训练结果可视化 def show_train_history(train_history): fig = plt.gcf() # 构造一个图表 fig.set_size_inches(10, 8) # 设置图表尺寸,英寸为单位 fig.suptitle('训练数据可视化', color='red') ax1 = plt.subplot(1, 2, 1) # 1行2列的第一个子图表 # 训练数据-准确度 ax1.plot(train_history.history['accuracy'], c='red') # 验证数据-准确度 ax1.plot(train_history.history['val_accuracy'], c='blue') ax1.set_title('训练历史记录-accuracy') # 设置子图表1的标题 ax1.set_xlabel('Epoch') # x轴标签 ax1.set_ylabel('Train') # y轴标签 # 设置子图表1的图例 ax1.legend(['accuracy', 'val_accuracy'], loc='upper left') ax2 = plt.subplot(1, 2, 2) # 1行2列的第二个子图表 # 训练数据-损失值 ax2.plot(train_history.history['loss'], c='red') # 验证数据-损失值 ax2.plot(train_history.history['val_loss'], c='blue') ax2.set_title('训练历史记录-loss') # 设置子图表2的标题 ax2.set_xlabel('Epoch') # x轴标签 ax2.set_ylabel('Train') # y轴标签 # 设置子图表2的图例 ax2.legend(['loss', 'val_loss'], loc='upper left')
plt.show() # 绘制图表
# 训练数据可视化 # accuracy=train accuracy训练准确率 # val_accuracy=validation accuracy验证准确率 # loss=train loss训练损失值记录 # val_loss=validation loss验证损失值记录 show_train_history(train_history)
# 用测试数据来评估模型准确率 # x_test_norm测试数据的feature,图片特征值 # y_test_onehot测试数据的label,图片的真值标签 # 返回在测试模式下模型的损失值和度量值(本例度量值是准确度accuracy)。
scores = model.evaluate(x_test_norm, y_test_onehot) print('测试得分为') print(scores) # 打印准确率数据 # scores = {list: 2} [0.0704198107123375, 0.9787999987602234] # 256个参数 损失值为0.0704198107123375 准确率accuracy为0.9787999987602234 #隐藏层参数增加为1000个 [0.05959093198180199, 0.9830999970436096] #增加DropOut后,[0.05871669948101044, 0.9815999865531921] # 预测,要用标准化、归一化的数据进行预测,批处理32, verbose=1表示显示进度条 prediction = model.predict(x_test_norm, batch_size=32, verbose=1) # 预测数据可视化 # 下标从0开始,共显示25项数据 plot_images(test_image, test_label, prediction, idx=0, num=25)
# 混淆矩阵confusion matrix 也叫误差矩阵 # 混淆矩阵用来显示哪些数次预测比较准确,哪些数字预测容易出错 import pandas as pd
# 独热码转换为普通码 def onehot_convert(predict): res = [] for p in predict: res.append(np.argmax(p)) return res
pre = onehot_convert(prediction) crosstab = pd.crosstab(test_label, pre, rownames=['label'], colnames=['predict']) print(crosstab)
# 建立dataFrame df = pd.DataFrame({'label': test_label, 'predict': pre}) # 查看真实值为5,而预测值为3的数据 df2 = df[(df.label == 5) & (df.predict == 3)] print(df2) # label predict 340 5 3 index = 340 #可视化错误项的图片,分析原因 #plot_image(test_image[index], test_label[index])
|
数据集
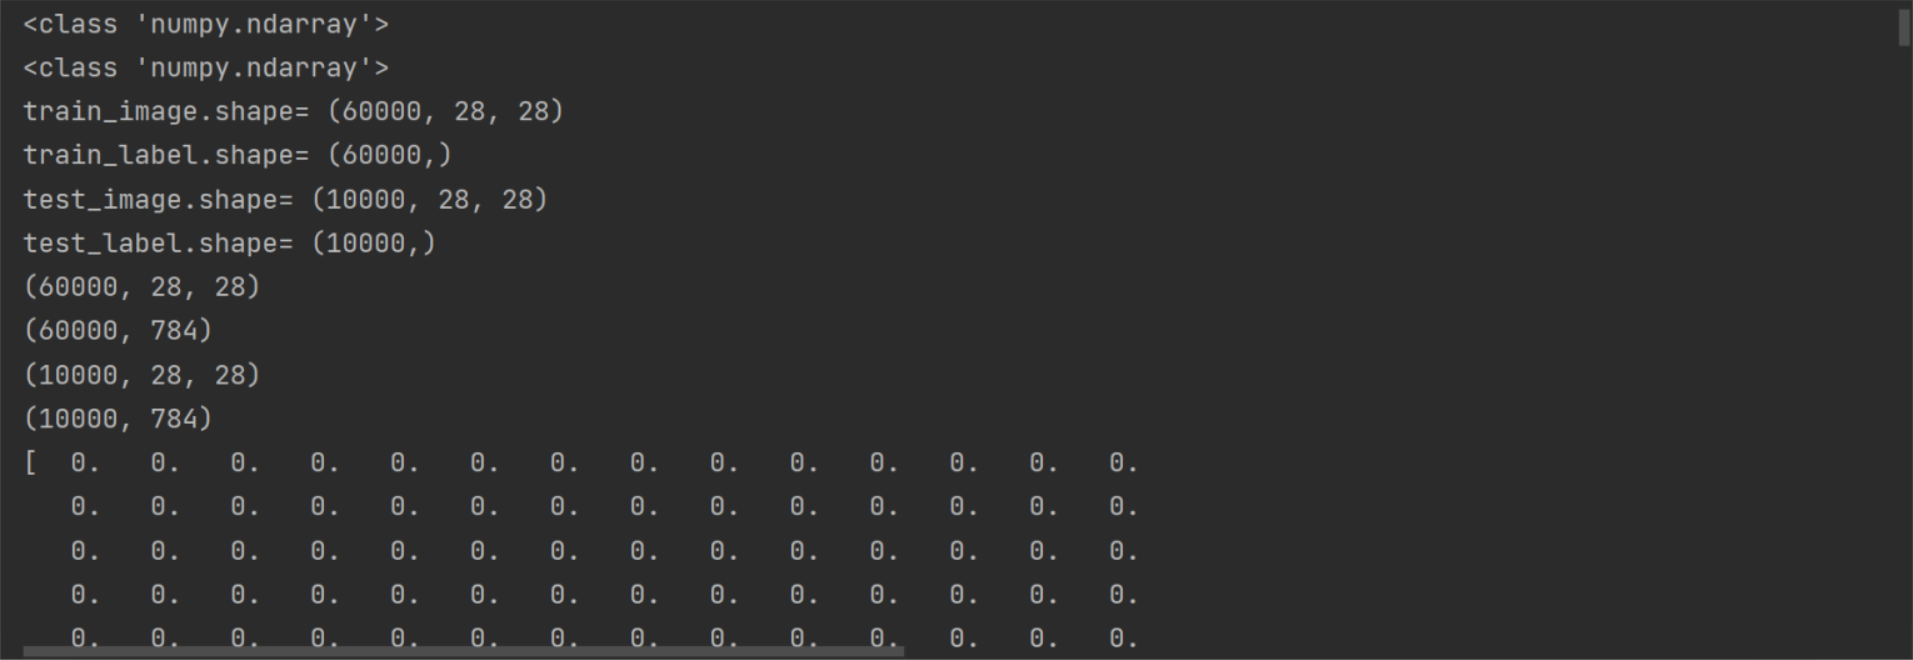
训练数据
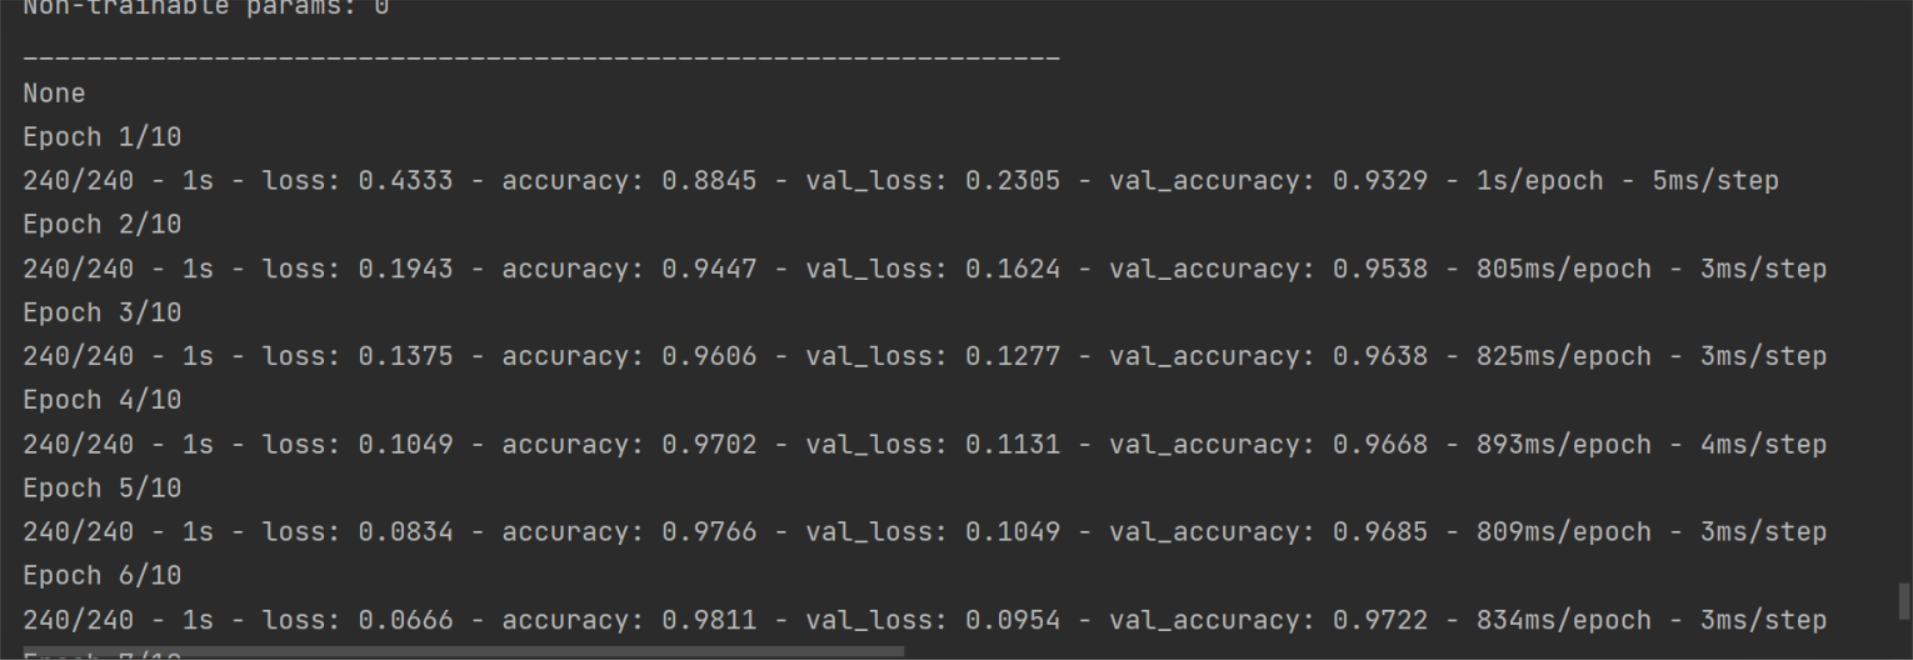
模型
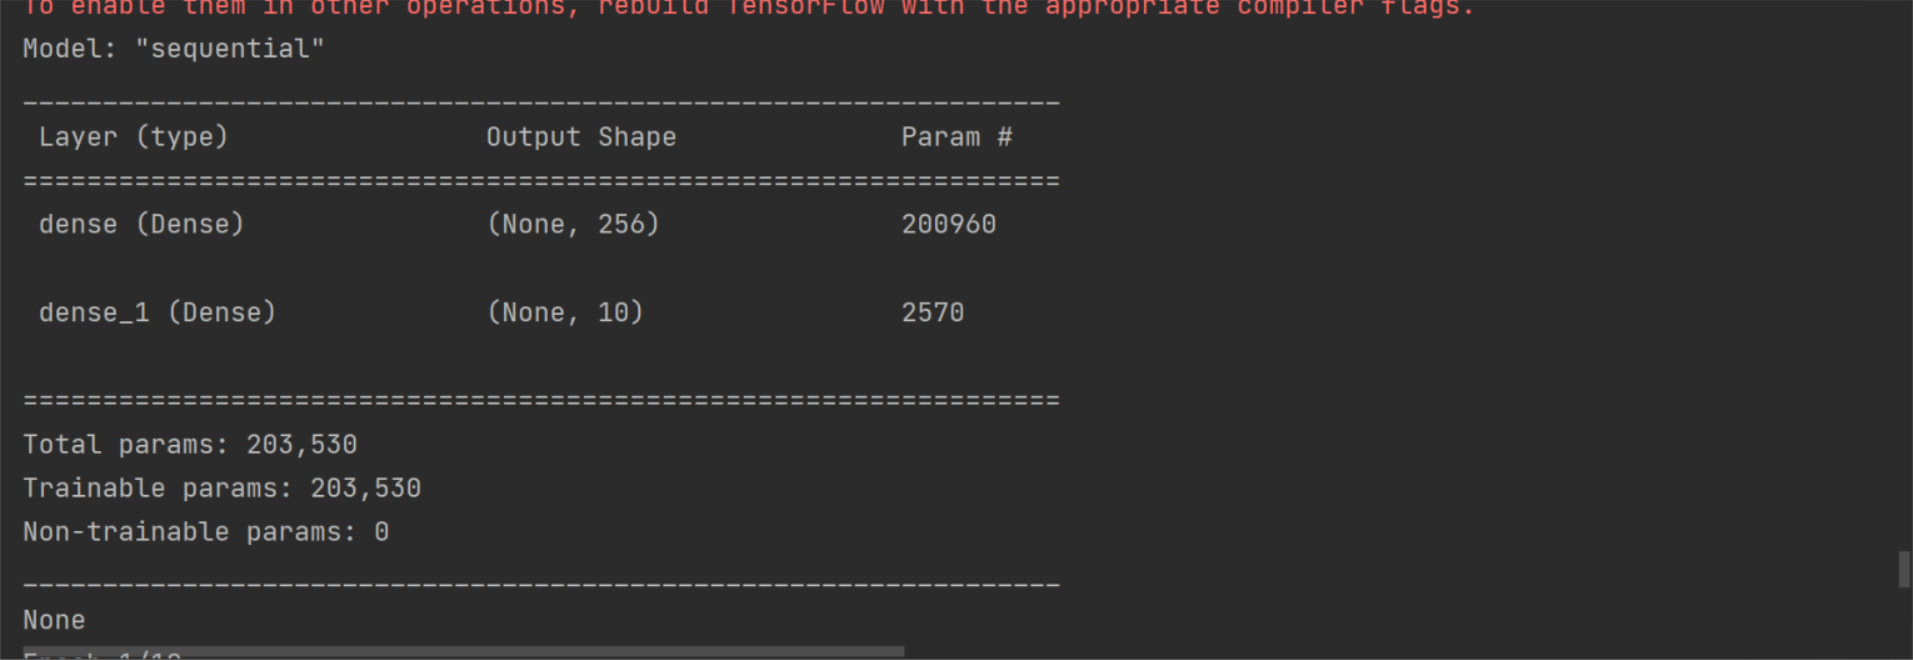
预测数据
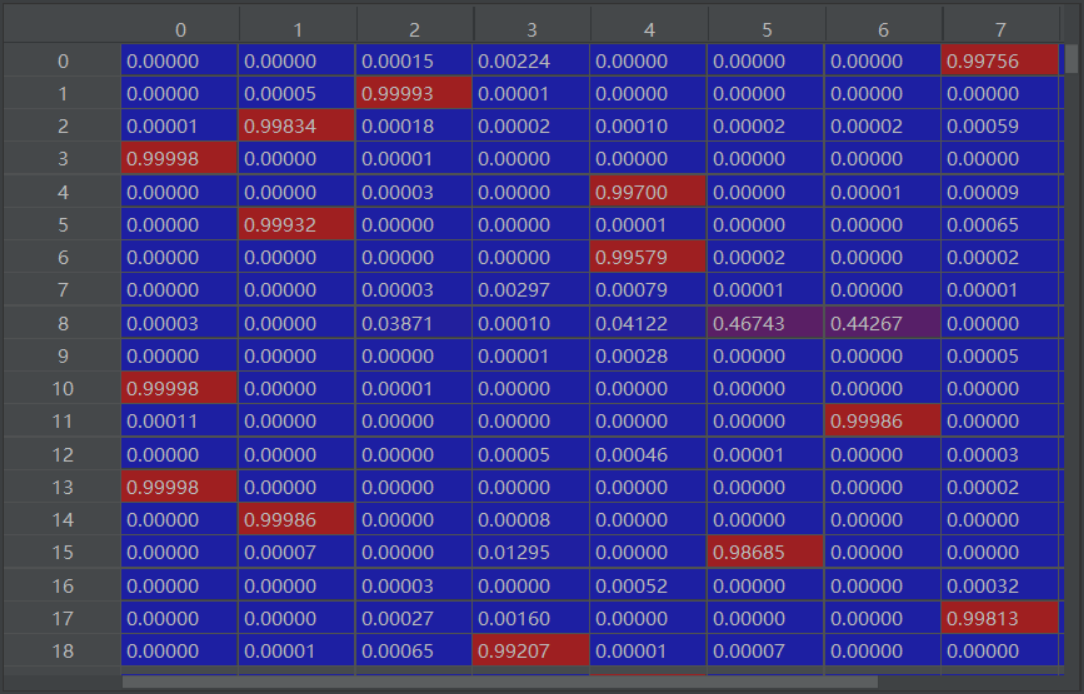
预测错误项
预测结果可视化
模型
|
添加DropOut层 避免过拟合
|
Model: "sequential" _________________________________________________________________ Layer (type) Output Shape Param # ================================================================= dense (Dense) (None, 1000) 785000
dropout (Dropout) (None, 1000) 0
dense_1 (Dense) (None, 10) 10010
================================================================= Total params: 795,010 Trainable params: 795,010 Non-trainable params: 0 _________________________________________________________________ |
|
增加隐藏层 |
Model: "sequential" _________________________________________________________________ Layer (type) Output Shape Param # ================================================================= dense (Dense) (None, 1000) 785000
dropout (Dropout) (None, 1000) 0
dense_1 (Dense) (None, 1000) 1001000
dropout_1 (Dropout) (None, 1000) 0
dense_2 (Dense) (None, 10) 10010
================================================================= Total params: 1,796,010 Trainable params: 1,796,010 Non-trainable params: 0 _________________________________________________________________ |
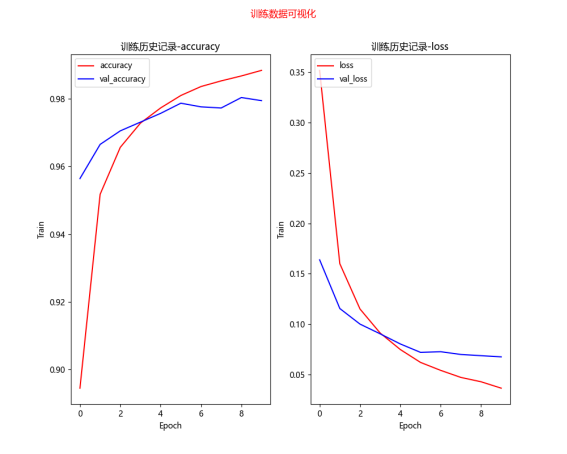
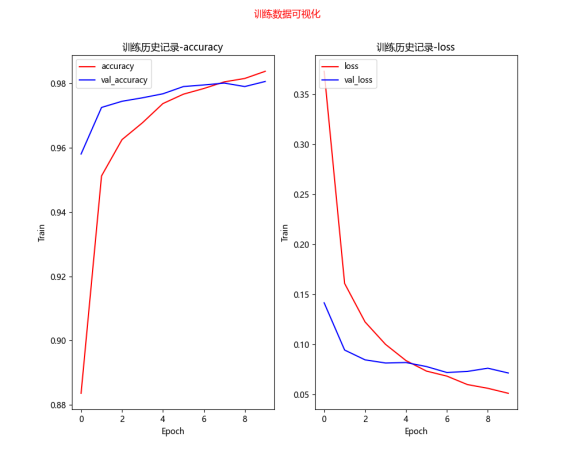
增加参数导致过拟合
|
256个参数 |
1000个参数-过拟合 |
|
|
|
|
[0.0704198107123375, 0.9787999987602234] loss value & metrics values(accuracy) 损失值&度量值(准确率) |
[0.05959093198180199, 0.9830999970436096] loss value & metrics values(accuracy) 损失值&度量值(准确率) |
优化模型的训练效果对比
|
参数 |
训练数据可视化 |
结果 |
|
256个参数 |
|
[0.0704198107123375, 0.9787999987602234] loss value & metrics values(accuracy) 损失值&度量值(准确率)
label predict 340 5 3 1003 5 3 1393 5 3 1670 5 3 2035 5 3 2810 5 3 5937 5 3 5972 5 3 8502 5 3 错误项9个
|
|
1000个参数 |
|
[0.05959093198180199, 0.9830999970436096] loss value & metrics values(accuracy) 损失值&度量值(准确率)
label predict 340 5 3 1393 5 3 2035 5 3 2597 5 3 2810 5 3 3117 5 3 3902 5 3 4360 5 3 5937 5 3 错误项9个 |
|
增加DropOut |
|
[0.05871669948101044, 0.9815999865531921]
label predict 340 5 3 1393 5 3 2035 5 3 5937 5 3 错误项4个
|
|
1000参数+2个隐藏层+DropOut |
|
[0.06338179856538773, 0.9807000160217285]
label predict 1393 5 3 2291 5 3 2597 5 3 5972 5 3 错误项4个
|
结论:使用多层感知器模型识别MNIST手写数字,尝试将模型加宽(增加神经元个数)、加深(增加隐藏层个数),以提高准确率,并加入DropOut层,以避免过度拟合,准确率接近98%。不过,多层感知器有其极限,如果还要进一步提升准确率,就必须使用卷积神经网络CNN。
油耗预测项目(实战)
|
import io import os.path import matplotlib.pyplot as plt import keras.utils import tensorflow as tf import pandas as pd #下载汽车油耗数据集--加州大学欧文分校 dataset_path = 'C:\\Users\\Administrator\\.keras\\datasets\\auto-mpg.data' if not os.path.exists(dataset_path): dataset_path = keras.utils.get_file('auto-mpg.data', 'http://archive.ics.uci.edu/ml/machine-learning-databases/auto-mpg/auto-mpg.data') # 'C:\\Users\\Administrator\\.keras\\datasets\\auto-mpg.data'
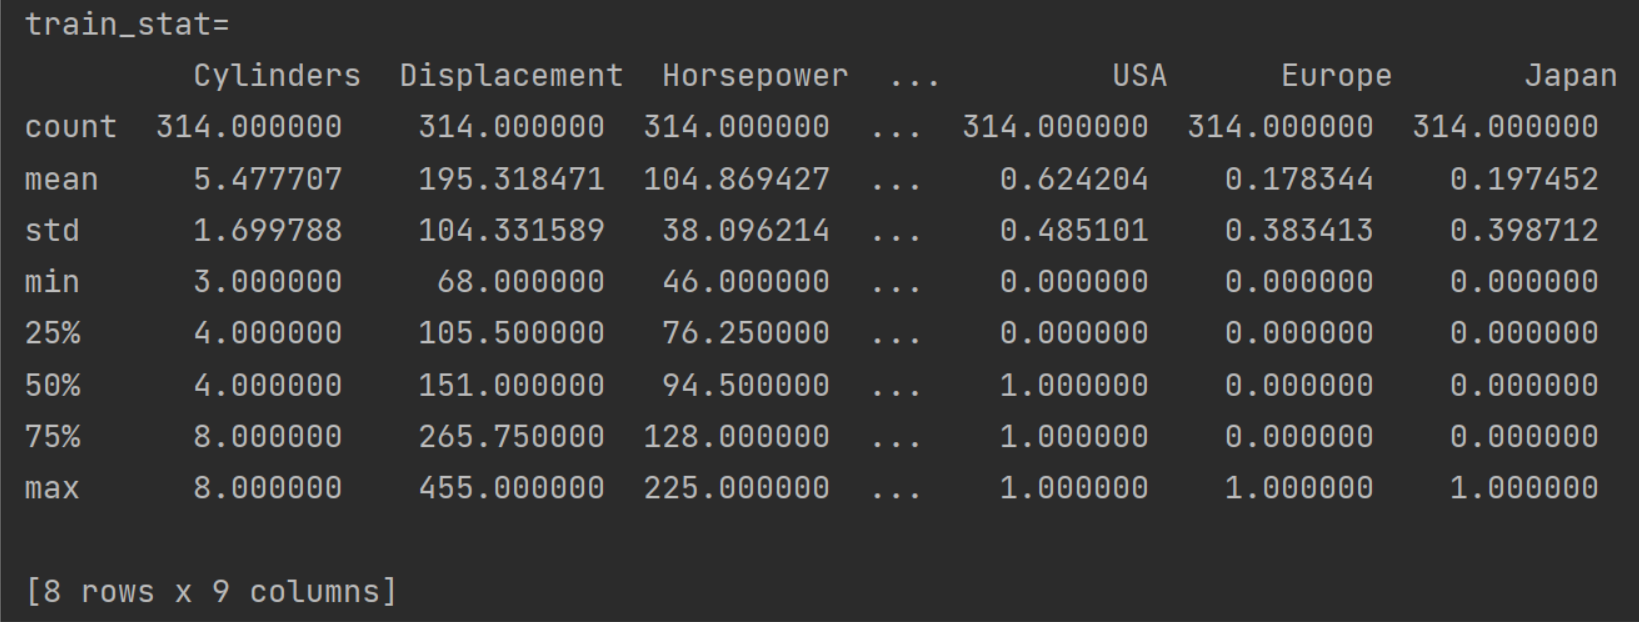
# 利用 pandas 读取数据集,字段有效能(公里数每加仑),气缸数,排量,马力,重量,加速度,型号年份,产地 column_names = ['MPG', 'Cylinders', 'Displacement', 'Horsepower', 'Weight', 'Acceleration', 'Model Year', 'Origin'] #读取数据 raw_dataset = pd.read_csv(dataset_path, names=column_names, na_values='?', comment='\t', sep=' ', skipinitialspace=True) #复制数据 dataset = raw_dataset.copy() #查看数据 print(dataset.head()) print('空白数据个数=', dataset.isna().sum()) #去除空白数据 dataset = dataset.dropna() #查看数据 print('空白数据个数=', dataset.isna().sum()) #产地数据转换为3列,相当于onehot表示形式 # 对于产地地段, 1 表示美国, 2 表示欧洲, 3 表示日本。 origin = dataset.pop('Origin') dataset['USA'] = (origin == 1) * 1.0 dataset['Europe'] = (origin == 2) * 1.0 dataset['Japan'] = (origin == 3) * 1.0 print('tail=\n', dataset.tail()) #划分数据集,其中80%用于训练 20%用于测试 train_dataset = dataset.sample(frac=0.8, random_state=0) test_dataset = dataset.drop(train_dataset.index) #弹出MPG列数据 train_label = train_dataset.pop('MPG') test_label = test_dataset.pop('MPG') #训练数据状态信息 train_stat = train_dataset.describe() # train_stat.pop('MPG') print('train_stat=\n', train_stat) #转置矩阵 train_stat = train_stat.transpose()
#定义数据标准化函数 def norm(x): return (x - train_stat['mean']) / train_stat['std']
#训练数据标准化 normed_train_data = norm(train_dataset) #测试数据标准化 normed_test_data = norm(test_dataset)
print(normed_train_data.shape, train_label.shape) print(normed_test_data.shape, test_label.shape)
train_db = tf.data.Dataset.from_tensor_slices((normed_train_data.values, train_label.values)) train_db = train_db.shuffle(100).batch(32)
import matplotlib
print(matplotlib.matplotlib_fname())
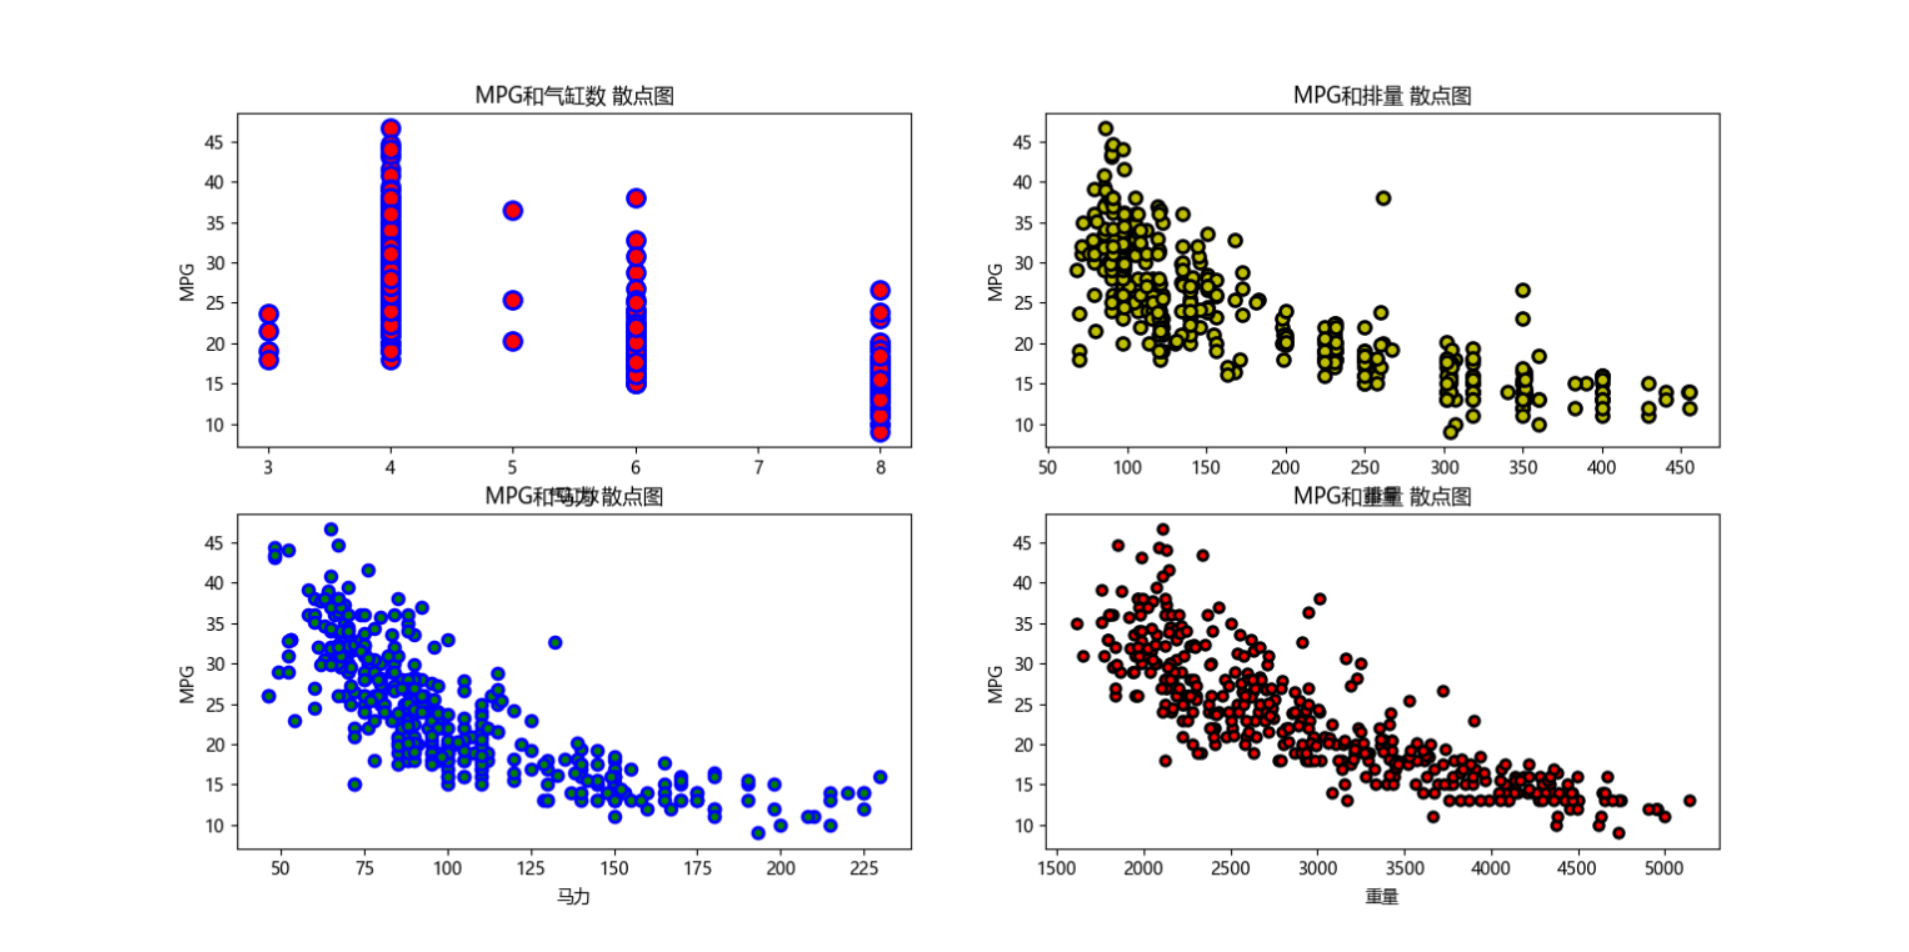
# # 解决plt中文乱码问题-方法1 # # plt.rcParams["font.sans-serif"]=["SimHei"] #设置字体 # # plt.rcParams["axes.unicode_minus"]=False #该语句解决图像中的“-”负号的乱码问题 # # # #创建一个有4个子图表的图表,2行2列 # # 接收数据格式要写成2*2的矩阵形式 # #2 2表示图表行数和列数 # #figsize表示图表尺寸 # #fig用于接收整个图表 # #ax1用于接收第1行第1列的子图表 # #ax2用于接收第1行第2列的子图表 # #ax3用于接收第2行第1列的子图表 # #ax4用于接收第2行第2列的子图表 # fig, [[ax1, ax2], [ax3, ax4]] = plt.subplots(2, 2, figsize=(8, 8)) # #设置图标的居中标题,字号fontsize为20,颜色c为红色 # fig.suptitle('油耗关系曲线',fontsize=20,c='red') # #绘制第1个子图表 # #scatter表示绘制散点图 # #X数据为dataset中的名称为Cylinders的列数据 # #Y数据为dataset中名称为MPG的列数据 # #c表示散点的颜色为red # #edgecolors表示散点的边缘颜色 # #s表示散点的大小size # #linewidth表示边缘的线宽 # ax1.scatter(dataset['Cylinders'], dataset['MPG'], c='red', edgecolors='blue', s=100, linewidth=2) # #设置子图表1的标题 # ax1.set_title('MPG和气缸数 散点图') # #设置子图表1的x轴标签/名称 # ax1.set_xlabel('气缸数') # #设置子图表1的y轴标签/名称 # ax1.set_ylabel('MPG') # #绘制第2个子图表 # ax2.scatter(dataset['Displacement'], dataset['MPG'], c='y', edgecolors='k', s=50, linewidth=2) # ax2.set_title('MPG和排量 散点图') # ax2.set_xlabel('排量') # ax2.set_ylabel('MPG') # #绘制第3个子图表 # ax3.scatter(dataset['Horsepower'], dataset['MPG'], c='g', edgecolors='b', s=40, linewidth=2) # ax3.set_title('MPG和马力 散点图') # ax3.set_xlabel('马力') # ax3.set_ylabel('MPG') # #绘制第4个子图表 # ax4.scatter(dataset['Weight'], dataset['MPG'], c='r', edgecolors='k', s=30, linewidth=2) # ax4.set_title('MPG和重量 散点图') # ax4.set_xlabel('重量') # ax4.set_ylabel('MPG') # #显示图表 # plt.show()
from keras import layers from keras import losses
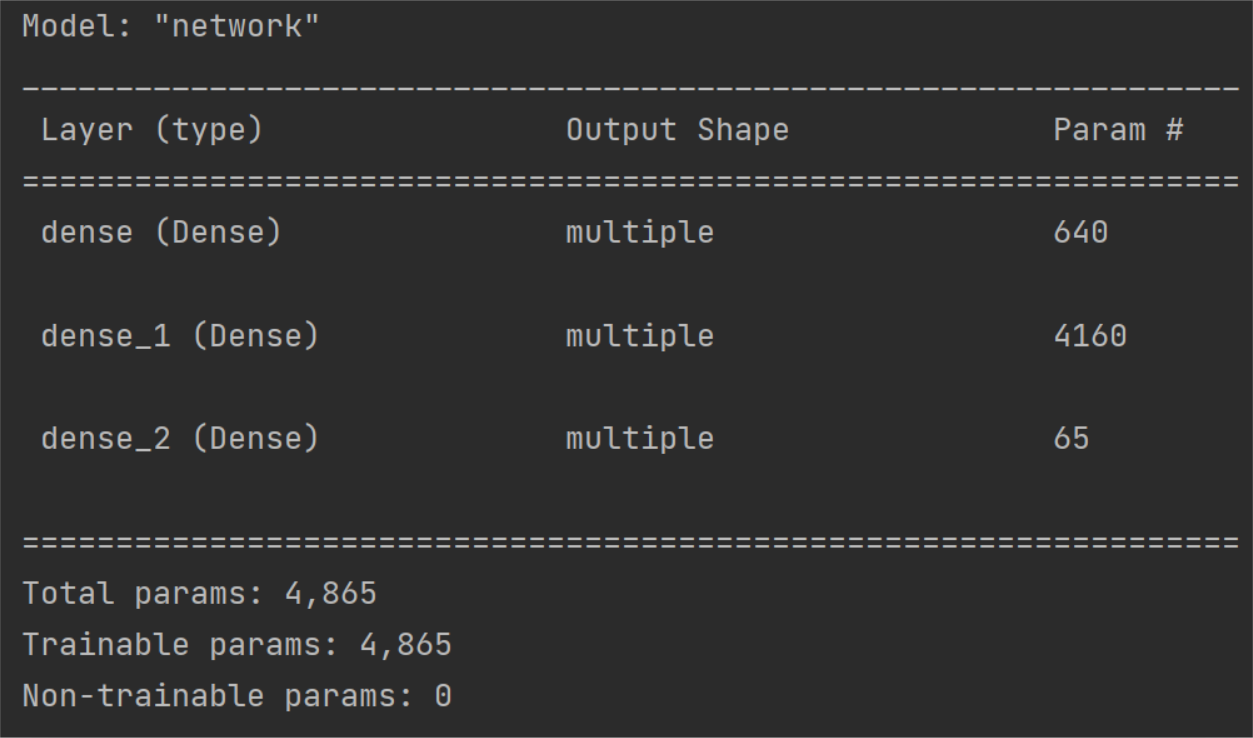
# 创建模型,3层的全连接网络 class Network(keras.Model): def __init__(self): super(Network, self).__init__() # 创建3个全连接层 self.fc1 = keras.layers.Dense(64, activation='relu') self.fc2 = keras.layers.Dense(64, activation='relu') self.fc3 = keras.layers.Dense(1) def call(self, inputs, training=None, mask=None): # 依次通过 3 个全连接层 x=self.fc1(inputs) x=self.fc2(x) x=self.fc3(x)
return x #创建网络实例 model=Network() model.build(input_shape=(4,9)) #查看网络概述信息 model.summary() #创建优化器,指定超参数 学习率learning rate=0.001 optimizer=tf.keras.optimizers.RMSprop(0.0001)
for epoch in range(2000): for step,(x,y) in enumerate(train_db): with tf.GradientTape() as tape: out=model(x)# 通过网络获得输出 #计算损失函数 loss=tf.reduce_mean(losses.MSE(y,out)) mae_loss=tf.reduce_mean(losses.MAE(y,out)) if step%10==0: print(epoch,step,loss)
# 计算梯度,并更新 grad=tape.gradient(loss,model.trainable_variables) optimizer.apply_gradients(zip(grad,model.trainable_variables))
|







【推荐】国内首个AI IDE,深度理解中文开发场景,立即下载体验Trae
【推荐】编程新体验,更懂你的AI,立即体验豆包MarsCode编程助手
【推荐】抖音旗下AI助手豆包,你的智能百科全书,全免费不限次数
【推荐】轻量又高性能的 SSH 工具 IShell:AI 加持,快人一步
· 震惊!C++程序真的从main开始吗?99%的程序员都答错了
· 【硬核科普】Trae如何「偷看」你的代码?零基础破解AI编程运行原理
· 单元测试从入门到精通
· 上周热点回顾(3.3-3.9)
· winform 绘制太阳,地球,月球 运作规律