vue3 vite 使用 echarts 之 折线图堆叠
1. npm 安装
npm install echarts --save
2. 使用
<template>
<div>
<div id="myChart123" :style="{width: '1500px', height: '550px'}"></div>
</div>
</template>
<script setup>
import * as echarts from 'echarts'
import {onMounted} from 'vue'
onMounted(() => {
echart()
})
let echart = () => {
let myChart = echarts.init(document.getElementById("myChart123"));
// 绘制图表
myChart.setOption({
title: {
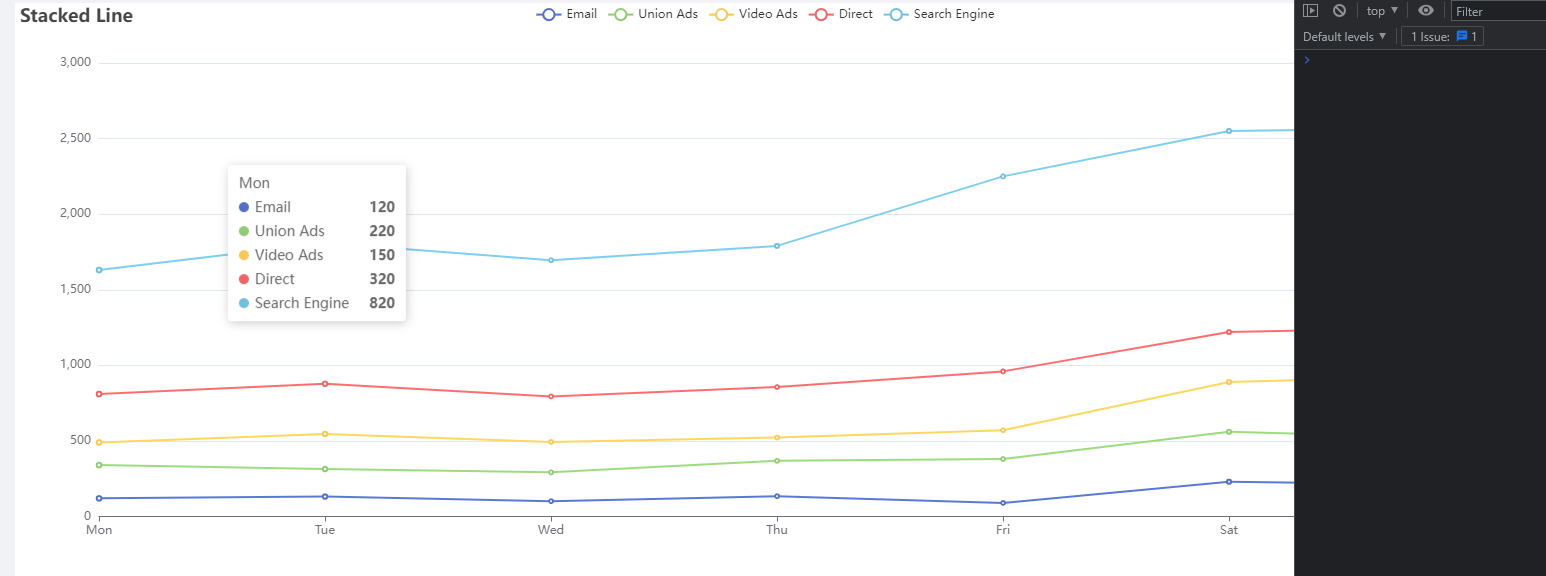
text: 'Stacked Line'
},
tooltip: {
trigger: 'axis'
},
legend: {
data: ['Email', 'Union Ads', 'Video Ads', 'Direct', 'Search Engine']
},
grid: {
left: '3%',
right: '4%',
bottom: '3%',
containLabel: true
},
toolbox: {
feature: {
saveAsImage: {}
}
},
xAxis: {
type: 'category',
boundaryGap: false,
data: ['Mon', 'Tue', 'Wed', 'Thu', 'Fri', 'Sat', 'Sun']
},
yAxis: {
type: 'value'
},
series: [
{
name: 'Email',
type: 'line',
stack: 'Total',
data: [120, 132, 101, 134, 90, 230, 210]
},
{
name: 'Union Ads',
type: 'line',
stack: 'Total',
data: [220, 182, 191, 234, 290, 330, 310]
},
{
name: 'Video Ads',
type: 'line',
stack: 'Total',
data: [150, 232, 201, 154, 190, 330, 410]
},
{
name: 'Direct',
type: 'line',
stack: 'Total',
data: [320, 332, 301, 334, 390, 330, 320]
},
{
name: 'Search Engine',
type: 'line',
stack: 'Total',
data: [820, 932, 901, 934, 1290, 1330, 1320]
}
]
});
window.onresize = function () { // 自适应大小
myChart.resize();
};
}
</script>
<style>
</style>期望结果:没有 异常