在SAS中作相关矩阵图
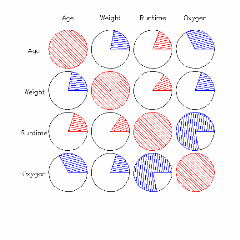
Corrgrams (Corrgrams: Exploratory displays for correlation matrices,Friendly,2002)中提供了作相关矩阵图像的方法。我的方法是先用gplot作出图中的圆心,然后利用gplot中的标注(annotate)作出圆及扇形。其中红色表示两个变量正相关,而蓝色表示负相关。最后将坐标系的颜色设为白色。
其结果如下示意。
代码如下。
%macro plotgraph(corrdata);
%let radius=8;
data corrmatrix(drop= _TYPE_ _NAME_);
set &corrdata(firstobs=4);
run;
proc sql noprint;
select count(name) into :nvars
from dictionary.columns
where libname=upcase("work") and memname=upcase("corrmatrix");
select name into :name1-:name%left(&nvars)
from dictionary.columns
where libname=upcase("work") and memname=upcase("corrmatrix");
Quit;
data corrdata(keep=corr);
set corrmatrix;
%do i=1 %to &nvars;
corr=&&name&i;
output;
%end;
run;
%annomac;
data annodata;
set corrdata;
retain xsys ysys '2' hsys '3';
center_x=mod(_N_-1,&nvars);
center_y=&nvars-ceil(_N_/&nvars);
if _N_<=&nvars then do;
function='label';
color='black';
x=center_x;y=center_y+0.8;
style='SIMPLEX';
size=3;
rotate=0;
text=symget('name'||left(_N_));
output;
function='label';
color='black';
x=-0.8;y=&nvars-_N_;
style='SIMPLEX';
size=3;
rotate=0;
text=symget('name'||left(_N_));
output;
end;
%circle(center_x,center_y,&radius,black);
if corr >0 then do;
x=center_x;
y=center_y;
angle=0;
rotate=corr*360;
size=&radius;
color='red';
style='p3n45';
line=3;
output;
end;
else do;
x=center_x;
y=center_y;
angle=0;
rotate=abs(corr)*360;
size=&radius;
color='blue';
style='p3n45';
line=3;
output;
end;
run;
/*remove duplicates*/
proc sql noprint;
create table plotdata as
select distinct center_x,center_y
from annodata;
quit;
goption reset=all;
goption device=gif hsize=400 pt vsize=400 pt;
symbol1 v=point;
AXIS1 ORDER =(-1 TO &nvars BY 1) origin=(10 pct,10 pct)
COLOR=white;/*disappear the axis*/
proc gplot data=plotdata;
plot center_y*center_x/ haxis=axis1 vaxis=axis1
nolegend
annotate=annodata;
run;
quit;
%mend;
%macro corrgraph(libname,dataset);
proc sql noprint;
select count(name) into :nvars
from dictionary.columns
where libname=upcase("&libname") and memname=upcase("&dataset");
select name into :varname separated by ' '
from dictionary.columns
where libname=upcase("&libname") and memname=upcase("&dataset");
quit;
proc corr data=&dataset pearson spearman hoeffding
outp=Pearson_data outs=Spearman_data
outh=Hoeffding_data;
var &varname;
run;
/*can add other correlation graph*/
%plotgraph(Pearson_data);
/*%plotgraph(Spearman_data);
%plotgraph(Hoeffding_data);*/
%mend;
示例如下:
data fitness;
input Age Weight Runtime Oxygen @@;
datalines;
57 73.37 12.63 39.407 54 79.38 11.17 46.080
52 76.32 9.63 45.441 50 70.87 8.92 .
51 67.25 11.08 45.118 54 91.63 12.88 39.203
51 73.71 10.47 45.790 57 59.08 9.93 50.545
49 76.32 . 48.673 48 61.24 11.5 47.920
52 82.78 10.5 47.467 44 73.03 10.13 50.541
45 87.66 14.03 37.388 45 66.45 11.12 44.754
47 79.15 10.6 47.273 54 83.12 10.33 51.855
49 81.42 8.95 40.836 51 77.91 10.00 46.672
48 91.63 10.25 46.774 49 73.37 10.08 50.388
44 89.47 11.37 44.609 40 75.07 10.07 45.313
44 85.84 8.65 54.297 42 68.15 8.17 59.571
38 89.02 9.22 49.874 47 77.45 11.63 44.811
40 75.98 11.95 45.681 43 81.19 10.85 49.091
44 81.42 13.08 39.442 38 81.87 8.63 60.055
;
run;
调用过程:
%corrgraph(work,fitness);


