

爬取爱奇艺的热播电视剧
1.主题式网络爬虫名称:爱奇艺电视剧热播数据分析
2.主题式网络爬虫爬取的内容:爱奇艺电视剧热播
3设计方案概述:
实现思路:爬取网站网页源代码,得到想要的数据位置,提取数据,之后数据可视化等操作
主题页面的结构特征分析
1 主题页面的结构与特征分析
打开网页 点击鼠标右键 点击检查 得到想要的数据位置
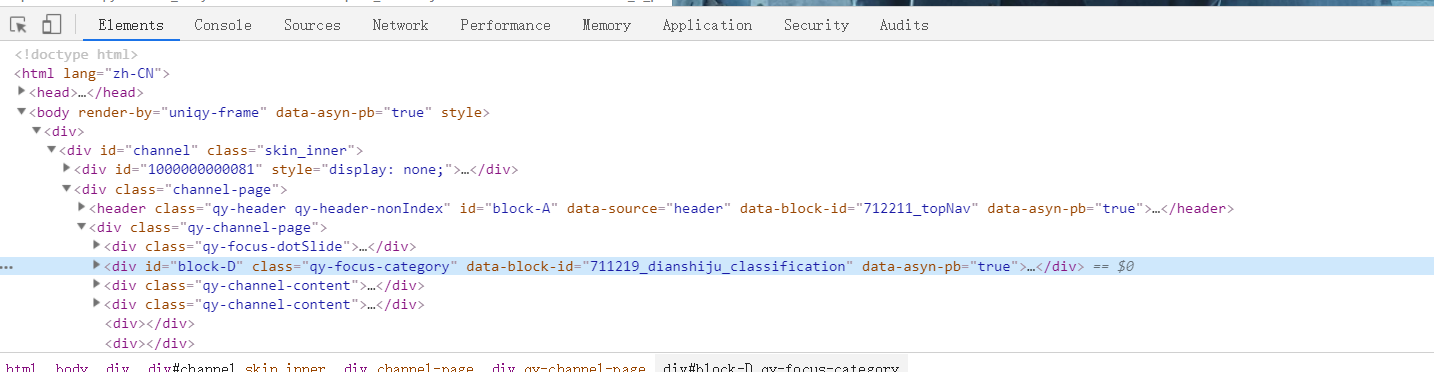
可以得到蓝框里面的就是我们所需要的数据位置
网络爬虫程序设计
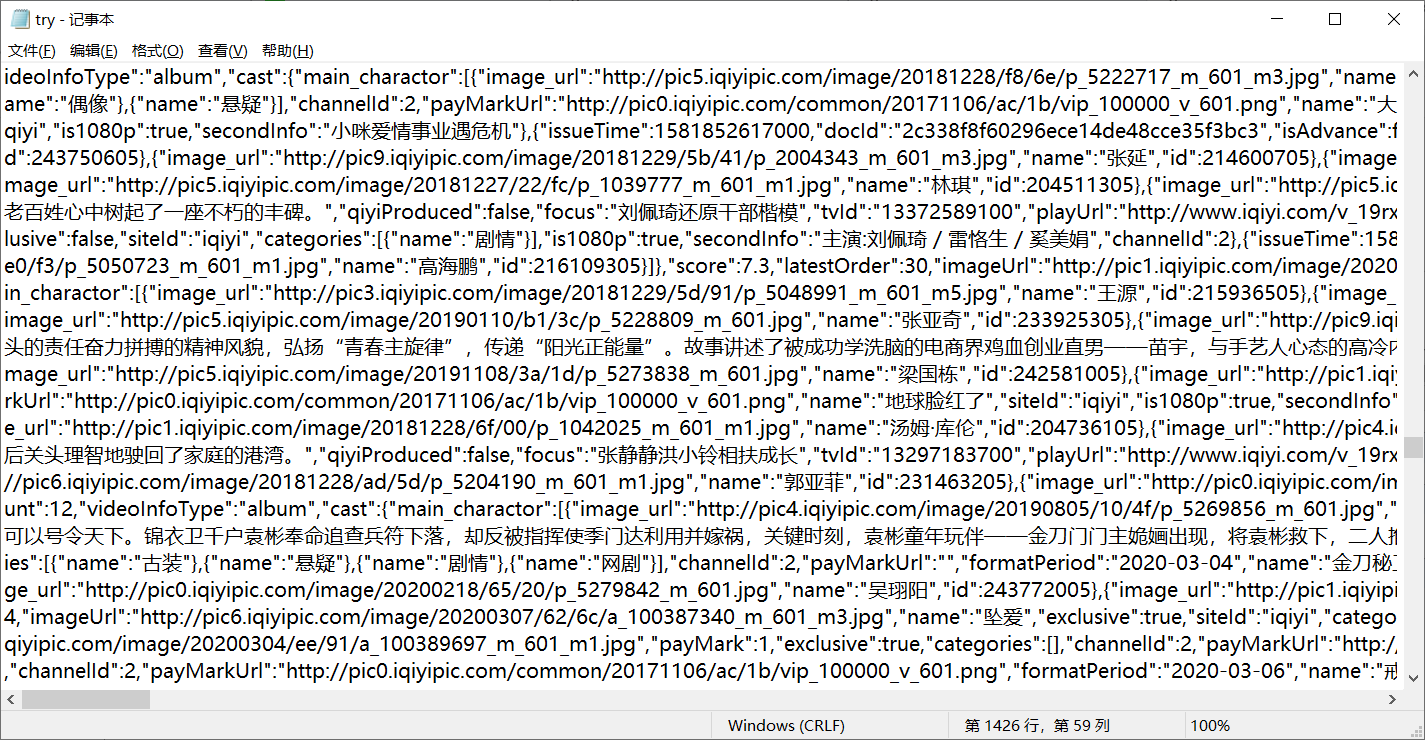
1.数据爬取与采集

import requests
def get_url(url):
headers = {'User-Agent': 'Mozilla/5.0 (Windows NT 10.0; WOW64) AppleWebKit/537.36 (KHTML, like Gecko) Chrome/75.0.3770.100 Safari/537.36'}
try:
f = requests.get(url,headers=headers)
return f.text
except:
print('产生异常')
def main():
url = 'https://www.iqiyi.com/dianshiju/index.html'
some = get_url(url)
with open('try.txt','w',encoding='utf-8') as f:
f.write(some)
main()
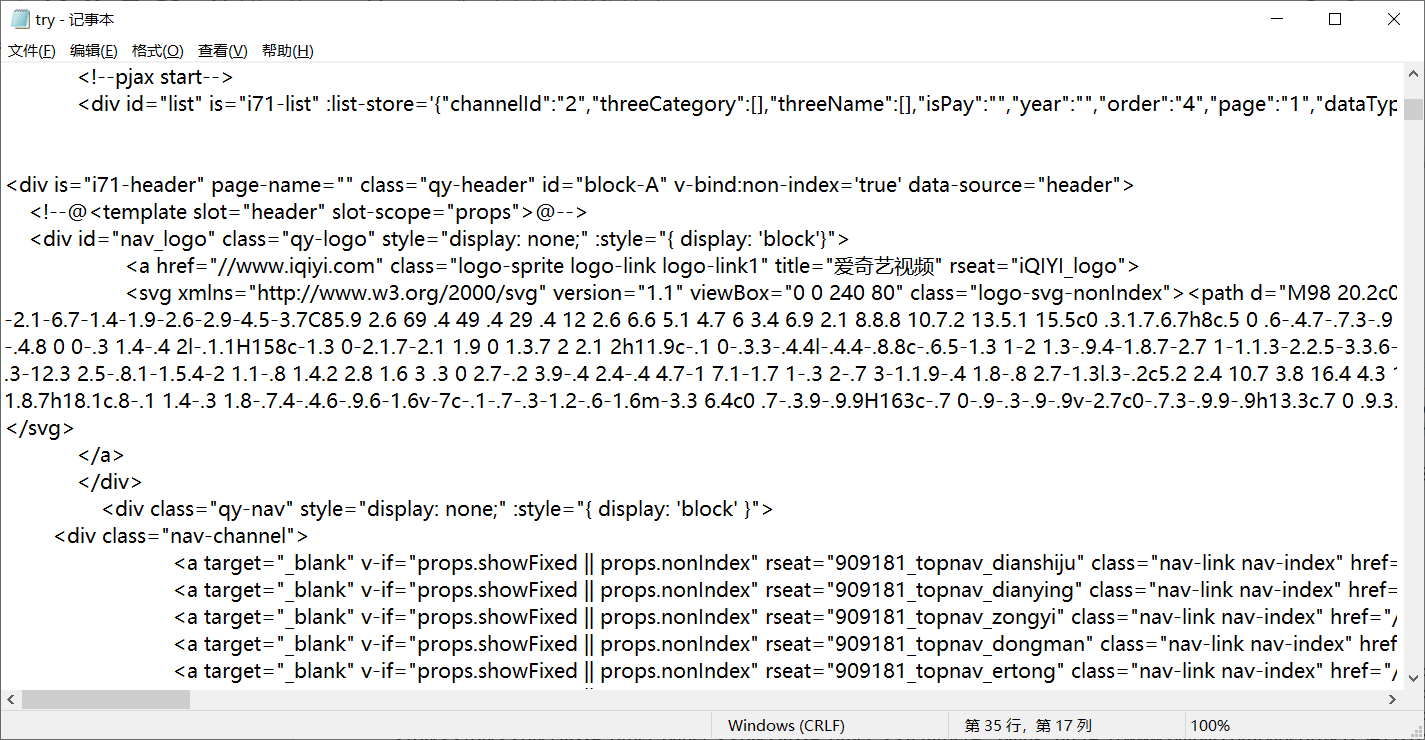
对网页进行解析:
import bs4
def bs(text):
soup = bs4.BeautifulSoup(text,'html.parser')
return soup
def main():
url='https://list.iqiyi.com/www/2/-------------4-1-1-iqiyi--.html'#电视剧热门链接
some = get_url(url)
soup = bs(some)
with open('test.txt','w',encoding='utf-8')as file:
file .write(soup.text)
main()
解析内容
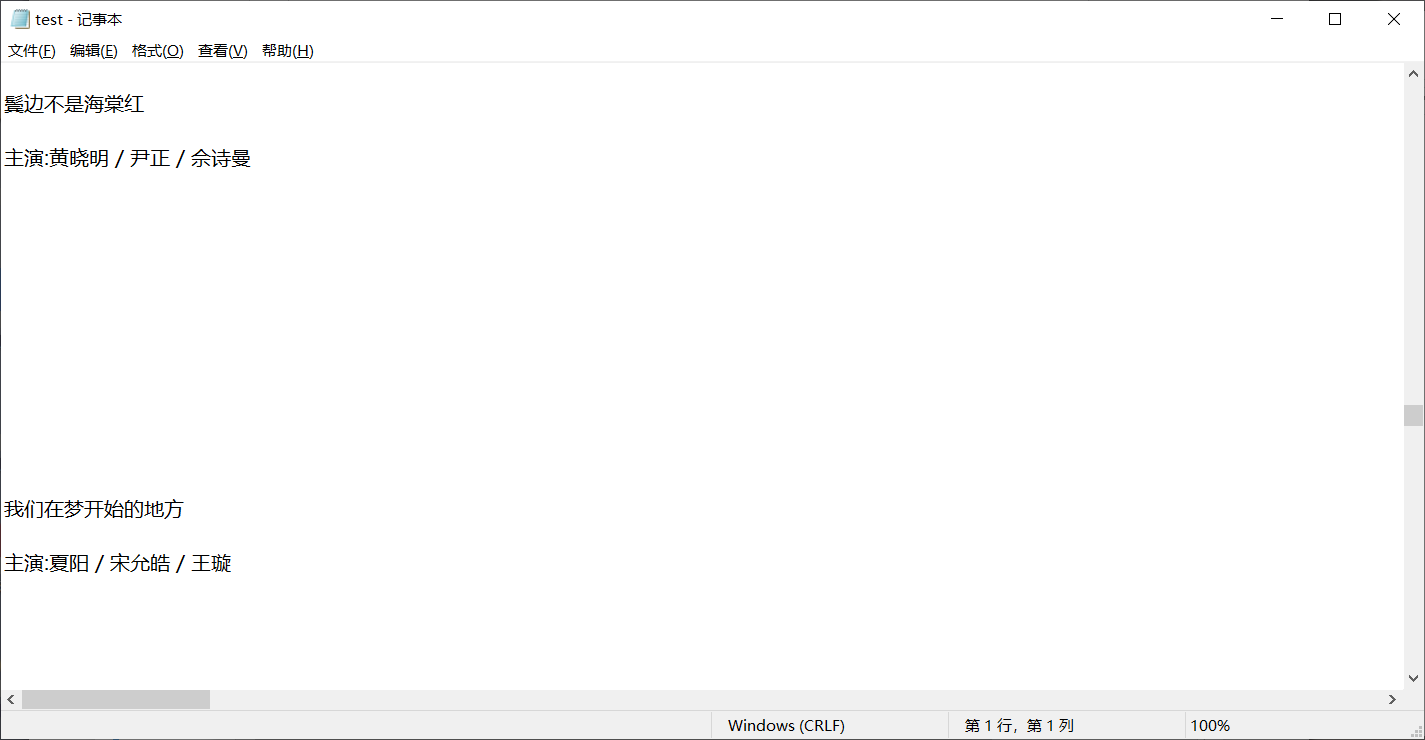
挑取几个电视剧做例子
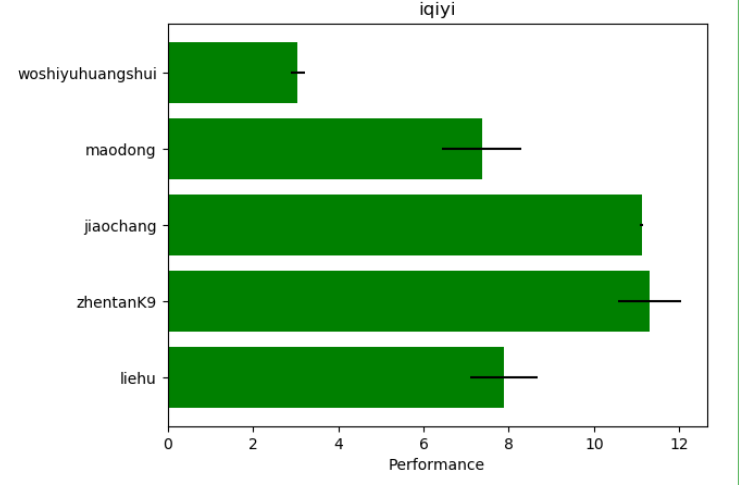
柱状图
"""
====================
Horizontal bar chart
====================

This example showcases a simple horizontal bar chart.
"""
import matplotlib.pyplot as plt
plt.rcdefaults()
import numpy as np
import matplotlib.pyplot as plt


plt.rcdefaults()
fig, ax = plt.subplots()

# Example data
#我是余欢水 猫冬 教场 侦探K9 猎狐
people = ('woshiyuhuangshui', 'maodong', 'jiaochang', 'zhentanK9', 'liehu')
y_pos = np.arange(len(people))
performance = 3 + 10 * np.random.rand(len(people))
error = np.random.rand(len(people))

ax.barh(y_pos, performance, xerr=error, align='center',
        color='green', ecolor='black')
ax.set_yticks(y_pos)
ax.set_yticklabels(people)
ax.invert_yaxis()  # labels read top-to-bottom
ax.set_xlabel('Performance')
ax.set_title('iqiyi')#爱奇艺

plt.show()
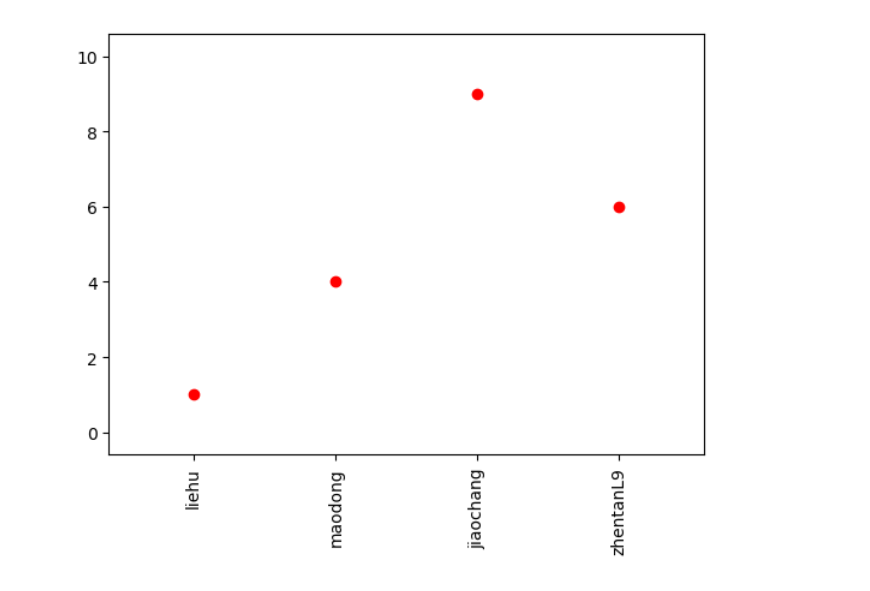
点状分布图
"""
===========================
Rotating custom tick labels
===========================

Demo of custom tick-labels with user-defined rotation.
"""
import matplotlib.pyplot as plt


x = [1, 2, 3, 4]
y = [1, 4, 9, 6]
labels = ['liehu', 'maodong', 'jiaochang', 'zhentanL9']#同上用英文代替

plt.plot(x, y, 'ro')
# You can specify a rotation for the tick labels in degrees or with keywords.
plt.xticks(x, labels, rotation='vertical')
# Pad margins so that markers don't get clipped by the axes
plt.margins(0.2)
# Tweak spacing to prevent clipping of tick-labels
plt.subplots_adjust(bottom=0.15)
plt.show()
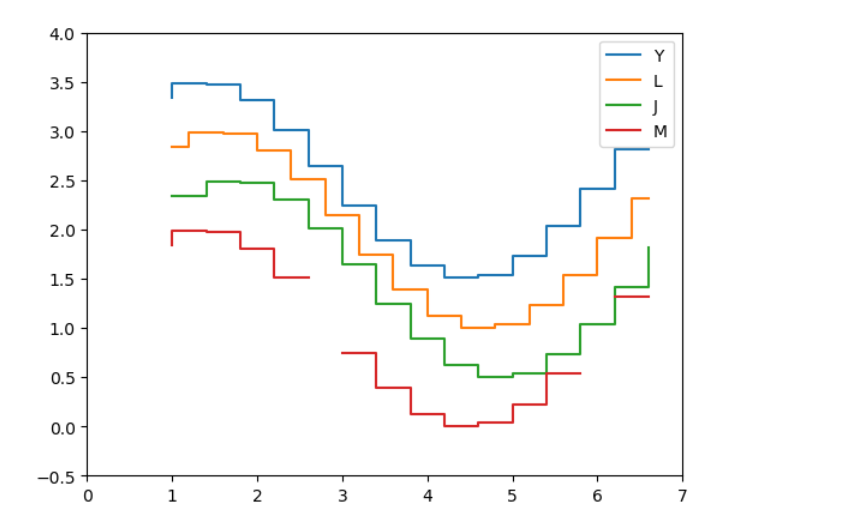
折线图
import numpy as np
from numpy import ma
import matplotlib.pyplot as plt

x = np.arange(1, 7, 0.4)
y0 = np.sin(x)
y = y0.copy() + 2.5

plt.step(x, y, label='Y')#Y=我是余欢水

y -= 0.5
plt.step(x, y, where='mid', label='L')#L=猎狐

y -= 0.5
plt.step(x, y, where='post', label='J')#J=教场

y = ma.masked_where((y0 > -0.15) & (y0 < 0.15), y - 0.5)
plt.step(x, y, label='M')#M=猫冬

plt.legend()

plt.xlim(0, 7)
plt.ylim(-0.5, 4)

plt.show()
将上述代码全部合并
import requests

def get_url(url):
    headers = {'User-Agent': 'Mozilla/5.0 (Windows NT 10.0; WOW64) AppleWebKit/537.36 (KHTML, like Gecko) Chrome/75.0.3770.100 Safari/537.36'}
    try:
        f = requests.get(url,headers=headers)
        return f.text

    except:
        print('产生异常')

def main():
    url = 'https://list.iqiyi.com/www/2/-------------4-1-1-iqiyi--.html'

    some = get_url(url)

    with open('try.txt','w',encoding='utf-8') as f:
        f.write(some)

main()


import bs4
def bs(text):
    soup = bs4.BeautifulSoup(text,'html.parser')
    return soup
def main():
    url='https://list.iqiyi.com/www/2/-------------4-1-1-iqiyi--.html'#电视剧热门链接

    some = get_url(url)

    soup = bs(some)

    with open('test.txt','w',encoding='utf-8')as file:
        file .write(soup.text)

main()

#柱状图

#随便举例几个 中文图做不出来 用英文代替

"""
====================
Horizontal bar chart
====================

This example showcases a simple horizontal bar chart.
"""
import matplotlib.pyplot as plt
plt.rcdefaults()
import numpy as np
import matplotlib.pyplot as plt


plt.rcdefaults()
fig, ax = plt.subplots()

# Example data
#我是余欢水 猫冬 教场 侦探K9 猎狐
people = ('woshiyuhuangshui', 'maodong', 'jiaochang', 'zhentanK9', 'liehu')
y_pos = np.arange(len(people))
performance = 3 + 10 * np.random.rand(len(people))
error = np.random.rand(len(people))

ax.barh(y_pos, performance, xerr=error, align='center',
        color='green', ecolor='black')
ax.set_yticks(y_pos)
ax.set_yticklabels(people)
ax.invert_yaxis()  # labels read top-to-bottom
ax.set_xlabel('Performance')
ax.set_title('iqiyi')#爱奇艺

plt.show()


"""
===========================
Rotating custom tick labels
===========================

Demo of custom tick-labels with user-defined rotation.
"""
import matplotlib.pyplot as plt


x = [1, 2, 3, 4]
y = [1, 4, 9, 6]
labels = ['liehu', 'maodong', 'jiaochang', 'zhentanL9']#同上用英文代替

plt.plot(x, y, 'ro')
# You can specify a rotation for the tick labels in degrees or with keywords.
plt.xticks(x, labels, rotation='vertical')
# Pad margins so that markers don't get clipped by the axes
plt.margins(0.2)
# Tweak spacing to prevent clipping of tick-labels
plt.subplots_adjust(bottom=0.15)
plt.show()

import numpy as np
from numpy import ma
import matplotlib.pyplot as plt

x = np.arange(1, 7, 0.4)
y0 = np.sin(x)
y = y0.copy() + 2.5

plt.step(x, y, label='Y')#Y=我是余欢水

y -= 0.5
plt.step(x, y, where='mid', label='L')#L=猎狐

y -= 0.5
plt.step(x, y, where='post', label='J')#J=教场

y = ma.masked_where((y0 > -0.15) & (y0 < 0.15), y - 0.5)
plt.step(x, y, label='M')#M=猫冬

plt.legend()

plt.xlim(0, 7)
plt.ylim(-0.5, 4)

plt.show()
结论:
数据爬取要注意细节 比如div 标签等等 编写代码时要注意大小写 是否英 注意缩进 让我对bs4库 seaborn库 和gallery库更加了解 是我对python的热爱更加深了 唯一遗憾的就是学的太慢 代码经常打错 很多地方其实不是太懂 所以需要勤加练习阿


【推荐】国内首个AI IDE,深度理解中文开发场景,立即下载体验Trae
【推荐】编程新体验,更懂你的AI,立即体验豆包MarsCode编程助手
【推荐】抖音旗下AI助手豆包,你的智能百科全书,全免费不限次数
【推荐】轻量又高性能的 SSH 工具 IShell:AI 加持,快人一步
· 开发者必知的日志记录最佳实践
· SQL Server 2025 AI相关能力初探
· Linux系列:如何用 C#调用 C方法造成内存泄露
· AI与.NET技术实操系列(二):开始使用ML.NET
· 记一次.NET内存居高不下排查解决与启示
· Manus重磅发布:全球首款通用AI代理技术深度解析与实战指南
· 被坑几百块钱后,我竟然真的恢复了删除的微信聊天记录!
· 没有Manus邀请码?试试免邀请码的MGX或者开源的OpenManus吧
· 【自荐】一款简洁、开源的在线白板工具 Drawnix
· 园子的第一款AI主题卫衣上架——"HELLO! HOW CAN I ASSIST YOU TODAY