@prometheus监控详解
文章目录
prometheus
简介
监控就是实时的帮助我们来监控或者探测我们部署的服务是否正常运行。
一、常用的监控
1、#zabbix
    特点:组件比较全,缺点:性能不高
         当zabbix监控大型集群的时候,怎么优化
         当数据库中一个表中数据超过2000w的时候,数据库的性能急剧下降
2、#阿里云云监控
3、#腾讯云蓝鲸监控
4、#普罗米修斯(prometheus)
    特点:性能比较高,底层使用(时序数据库)
          原生支持监控容器
二、普罗米修斯简述(prometheus)
#普罗米修斯监控分为两种情况:
1)携带metrics接口的服务(kubernetes、ETCD、Docker)


2)不携带metrics接口的服务(Nginx、mysql、Linux主机),针对于不携带metrics接口的服务,我们需要安装一个exporter插件,进行服务连接
三、prometheus部署
# 下载prometheus
[root@prometheus opt]# wget https://github.com/prometheus/prometheus/releases/download/v2.27.1/prometheus-2.27.1.linux-amd64.tar.gz
# 解压
[root@prometheus opt]# tar -xf prometheus-2.25.0.linux-amd64.tar.gz -C /usr/local/
[root@prometheus ~]# cd /usr/local/
# 建立超链接(简洁方便)
[root@prometheus local]# ln -s /usr/local/prometheus-2.25.0.linux-amd64 /usr/local/prometheus
[root@prometheus local]# ll
lrwxrwxrwx 1 root root 30 Jun 2 09:49 prometheus -> prometheus-2.25.0.linux-amd64/
# 创建环境变量(可有可无)
[root@prometheus local]# cat >> /etc/profile <<EOF
export PROMETHEUS_HOME=/usr/local/prometheus
PATH=$PATH:$PROMETHEUS_HOME
export PATH
EOF
[root@prometheus ~]# source /etc/profile
# 测试(检测版本信息)
[root@prometheus ~]# prometheus --version
prometheus, version 2.25.0 (branch: HEAD, revision: a6be548dbc17780d562a39c0e4bd0bd4c00ad6e2)
build user: root@615f028225c9
build date: 20210217-14:17:24
go version: go1.15.8
platform: linux/amd64
#配置文件修改(prometheus.yml)
[root@prometheus ~]# cd /usr/local/prometheus
[root@prometheus prometheus]# ll
total 167984
drwxr-xr-x 2 3434 3434 38 Feb 18 00:11 console_libraries
drwxr-xr-x 2 3434 3434 173 Feb 18 00:11 consoles
-rw-r--r-- 1 3434 3434 11357 Feb 18 00:11 LICENSE
-rw-r--r-- 1 3434 3434 3420 Feb 18 00:11 NOTICE
-rwxr-xr-x 1 3434 3434 91044140 Feb 17 22:19 prometheus
-rw-r--r-- 1 3434 3434 1170 Jun 2 18:16 prometheus.yml
-rwxr-xr-x 1 3434 3434 80948693 Feb 17 22:21 promtool
#启动prometheus
[root@prometheus ~]# prometheus --config.file=/usr/local/prometheus/prometheus.yml
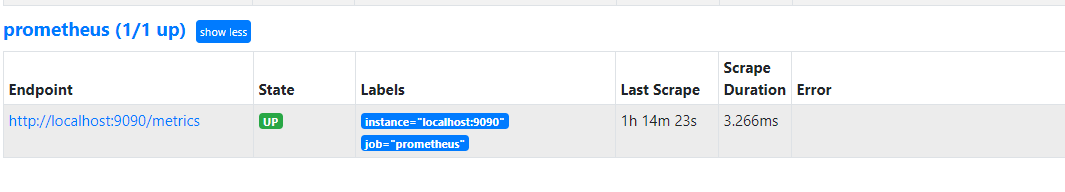
#访问查看监控
http://172.16.1.81:9090/targets #使用默认端口(9090)
#查看接口数据
http://172.16.1.81:9090/metrics #使用指定的ip进行查看监控详细信息
四、prometheus(web)
注:!!!先安装exporter插件
1、配置插件环境
# 下载exporter
[root@web01 opt]# wget https://github.com/prometheus/node_exporter/releases/download/v1.1.2/node_exporter-1.1.2.linux-amd64.tar.gz


#解压到指定的目录
[root@web01 opt]# tar -xf node_exporter-1.1.2.linux-amd64.tar.gz -C /usr/local/


#建立软连接
[root@prometheus ~]# cd /usr/local/
[root@web01 local]# ln -s /usr/local/node_exporter-1.1.2.linux-amd64/ /usr/local/node_exporter


#添加环境变量(可有可无)
[root@web01 local]# vim /etc/profile
export NODE_EXPORTER=/usr/local/node_exporter
export PATH=$PATH:$NODE_EXPORTER


#重载配置文件生效
[root@web01 ~]# source /etc/profile


#启动prometheus监控(9100端口)
[root@web01 ~]# node_exporter
level=info ts=2021-06-02T07:01:08.509Z caller=node_exporter.go:195 msg="Listening on" address=:9100


#添加系统system启动项(system启动)
[root@web01 /]# cat >> /etc/systemd/system/node_exporter <<EOF
[Unit]
Description=This is prometheus node exporter
After=node_exporter.service

[Service]
Type=simple
ExecStart=/usr/local/node_exporter/node_exporter
ExecReload=/bin/kill -HUP
KillMode=process
Restart=on-failure

[Install]
WantedBy=multi-user.target
EOF


#使用system启动node_exporter
[root@web01 /]#systemctl restart node_exporter
[root@web01 /]# systemctl status node-exporter.service
● node-exporter.service - This is prometheus node exporter
   Loaded: loaded (/etc/systemd/system/node-exporter.service; disabled; vendor preset: disabled)
   Active: active (running) since 五 2021-06-11 18:19:17 CST; 1s ago      #检查状态成功启动
 Main PID: 1606 (node_exporter)
   CGroup: /system.slice/node-exporter.service
           └─1606 /usr/local/node_exporter/node_exporter
2、prometheus配置修改(添加监控ip)
#添加web node
[root@prometheus ~]# vim /usr/local/prometheus/prometheus.yml
  - job_name: 'Linux Node'
    static_configs:
      - targets:
        - "172.16.1.7:9100"
        - "172.16.1.8:9100"
        - "172.16.1.9:9100"

 #重载prometheus
[root@prometheus ~]# prometheus --config.file=/usr/local/prometheus/prometheus.yml


#查看监控状态
http://192.168.15.7:9090/targets

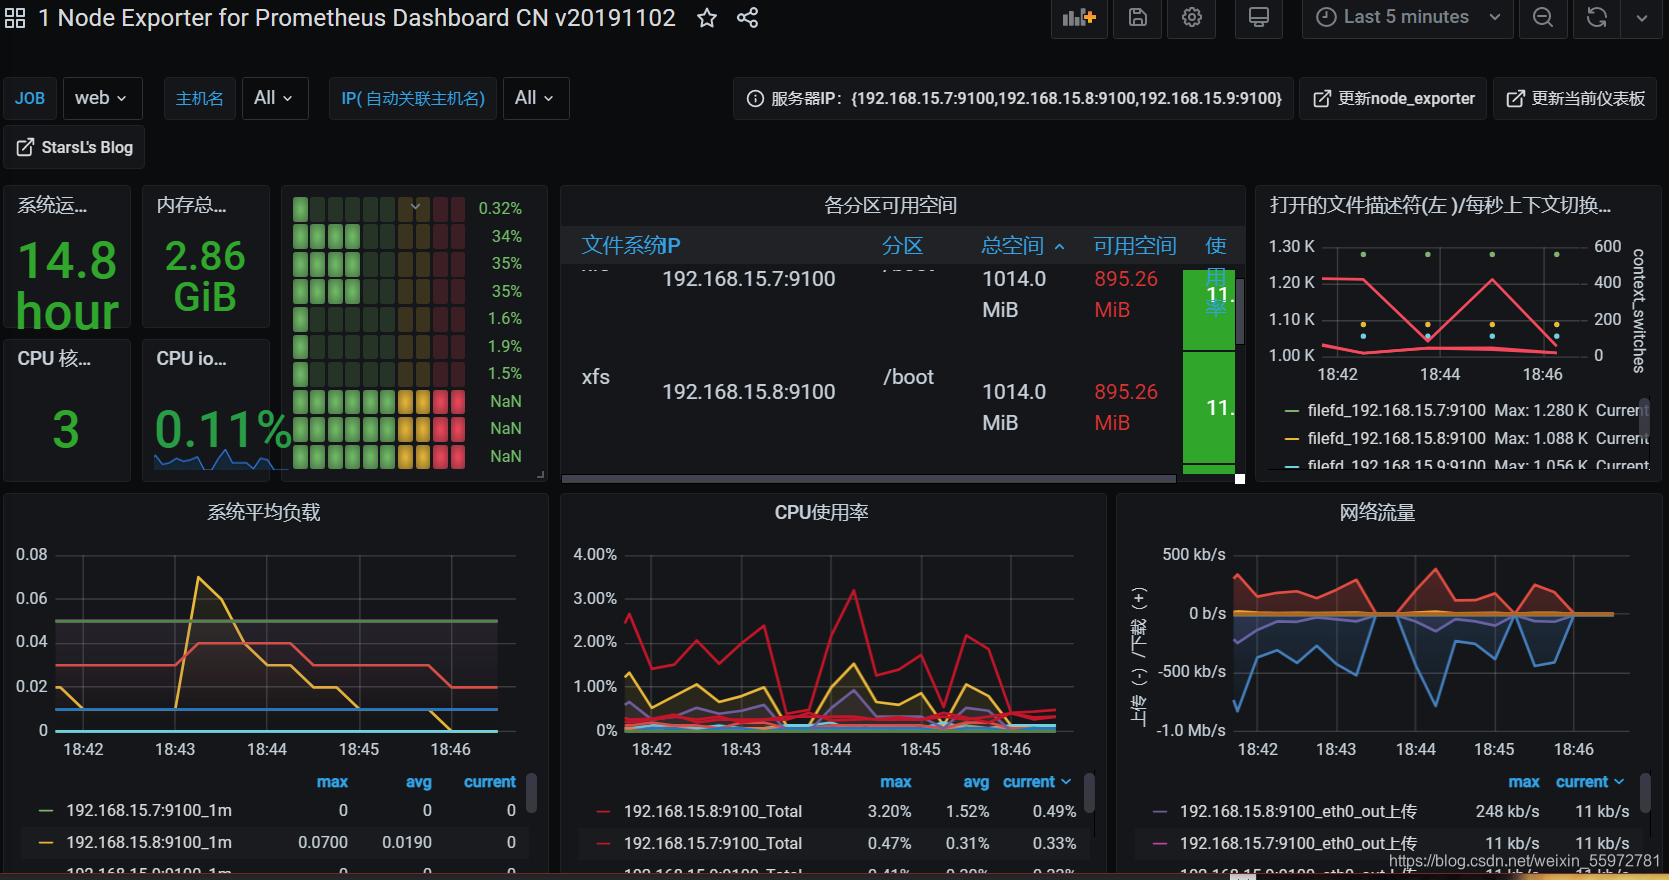
五、Garafana数据显示
Garafana是业内做数据展示挺好的一款产品
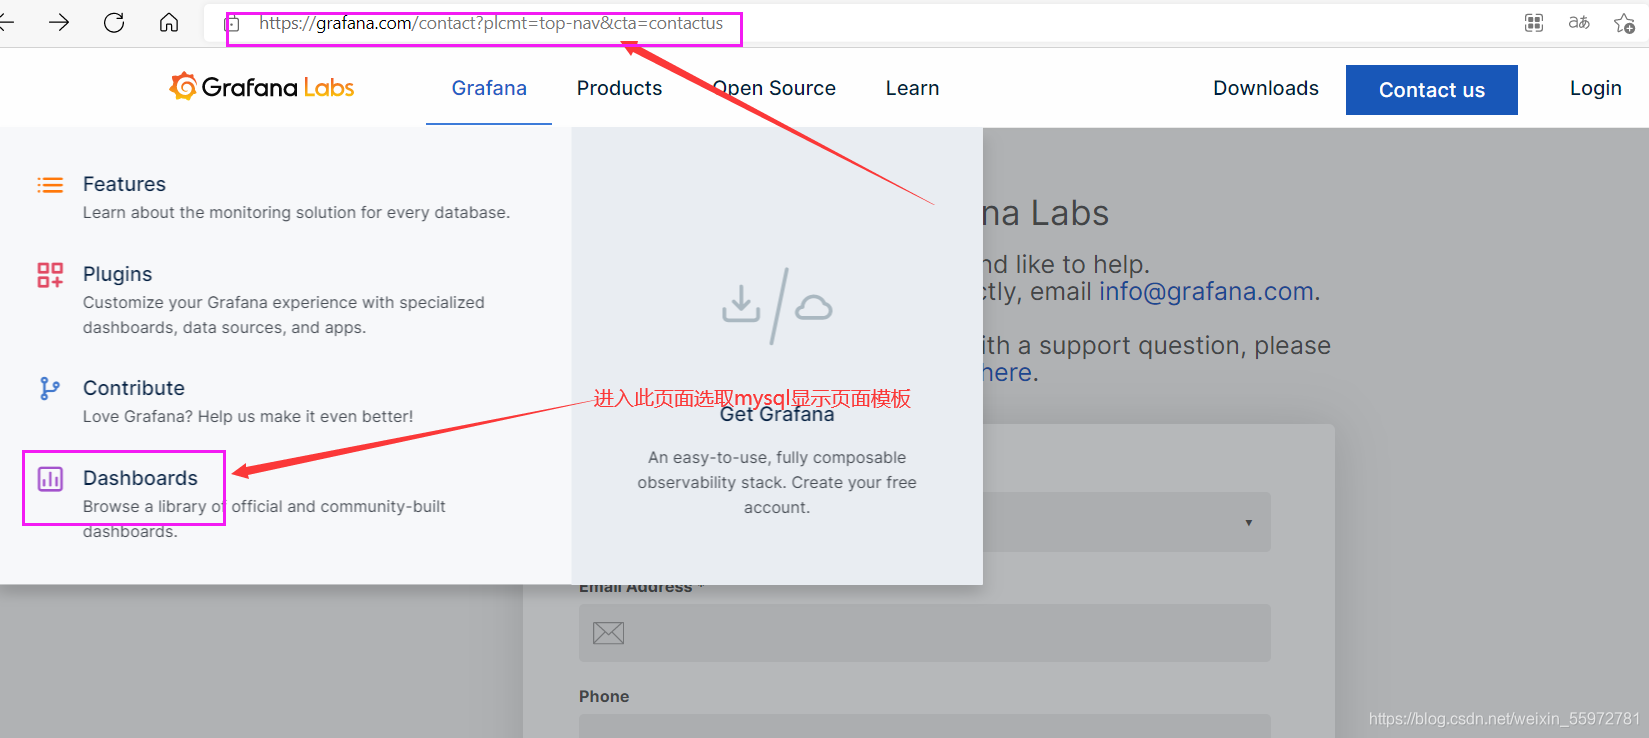
下载网站:https://grafana.com/get/?plcmt=top-nav&cta=downloads
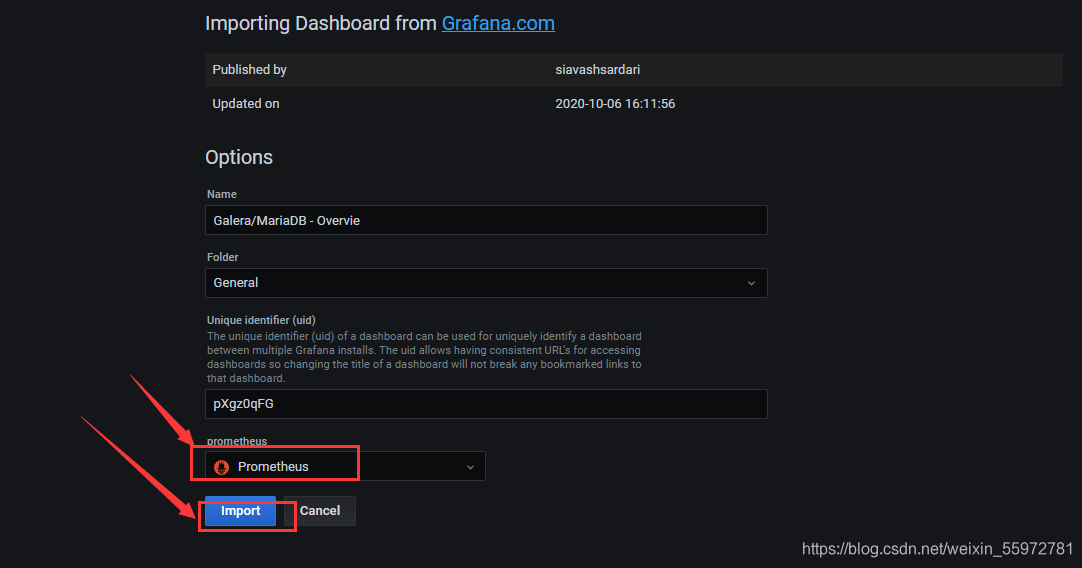
1、grafana模板链接
2、安装使用流程
#安装包上传
[root@prometheus opt]# rz -E
[root@prometheus opt]# ll
-rw-r--r-- 1 root root 53727312 Jun  2 11:21 grafana-7.3.6-1.x86_64.rpm


#本地安装grafana
[root@prometheus opt]# yum install -y grafana-7.3.6-1.x86_64.rpm
[root@prometheus opt]# systemctl start grafana-server.service


#查看端口号(是否启动)
[root@prometheus opt]# netstat -tnlp
Active Internet connections (only servers)
Proto Recv-Q Send-Q Local Address           Foreign Address         State       PID/Program name
tcp6       0      0 :::3000                 :::*                    LISTEN      10137/grafana-serve


#测试
HTTPS://172.16.1.81:3000    (默认端口号3000)
六、rometheus(数据库)
1、mysqld_exporter使用
 systemctl daemon-reload
#上传压缩包
[root@db01 opt]# rz -E
-rw-r--r-- 1 root root 7121565 Apr 22 21:33 mysqld_exporter-0.12.1.linux-amd64.tar.gz


#解压到指定的目录
[root@db01 opt]# tar -xf mysqld_exporter-0.12.1.linux-amd64.tar.gz -C /usr/local/
[root@db01 opt]# cd /usr/local/
[root@db01 local]# ll
drwxr-xr-x  2 3434 3434 58 Jul 29  2019 mysqld_exporter-0.12.1.linux-amd64


#添加软连接
[root@db01 local]# ln -s /usr/local/mysqld_exporter-0.12.1.linux-amd64/ /usr/local/mysqld_exporter
lrwxrwxrwx  1 root root 46 Jun  2 17:47 mysqld_exporter -> /usr/local/mysqld_exporter-0.12.1.linux-amd64/


#添加数据库用户登录(认证)配置文件
[root@db01 ~]#cd /usr/local/
[root@db01 mysqld_exporter]# vim .my.cnf
[client]
host=172.16.1.51
user=hzl
password=888


#数据库创建用户并授权
[root@db01 ~]# mysql -uroot -p123

MariaDB [(none)]> create user 'hzl'@'%' identified by '888';   #创建用户
Query OK, 0 rows affected (0.01 sec)

MariaDB [(none)]> grant process, replication client, select on *.* to 'hzl'@'%';                      #指定用户授权
Query OK, 0 rows affected (0.01 sec)

MariaDB [(none)]> use mysql;     #查看用户及权限
Reading table information for completion of table and column names
You can turn off this feature to get a quicker startup with -A

Database changed
MariaDB [mysql]> select host,user from user;
+------------+----------+
| host       | user     |
+------------+----------+
| %          | hzl      |
| 127.0.0.1  | root     |
| 172.16.1.% | www      |
| ::1        | root     |
| db01       |          |
| db01       | root     |
| localhost  |          |
| localhost  | root     |
+------------+----------+
8 rows in set (0.00 sec)


#启动mysqld_exporter进程(默认端口9104)
[root@db01 mysqld_exporter]# ./mysqld_exporter  --config.my-cnf="/usr/local/mysqld_exporter/.my.cnf"
................
INFO[0000] Starting mysqld_exporter (version=0.12.1, branch=HEAD, revision=48667bf7c3b438b5e93b259f3d17b70a7c9aff96)  source="mysqld_exporter.go:257"
INFO[0000] Build context (go=go1.12.7, user=root@0b3e56a7bc0a, date=20190729-12:35:58)  source="mysqld_exporter.go:258"
INFO[0000] Enabled scrapers:
INFO[0000] Listening on :9104                            source="mysqld_exporter.go:283"
............


#添加system系统启动项
[root@db01 /]# cat >> /etc/systemd/system/mysqld_exporter.service <<EOF
[Unit]
Description=Prometheus

[Service]
ExecStart=/usr/local/mysqld_exporter/mysqld_exporter --config.my-cnf=/usr/local/mysqld_exporter/.my.cnf --web.listen-address=:9104
Restart=on-failure

[Install]
WantedBy=multi-user.target
EOF


#重载加载项
[root@db01 system]#  systemctl daemon-reload


#使用system启动项
[root@db01 system]# systemctl restart mysqld_exporter.service
2、prometheus(添加监控项目ip)
[root@prometheus ~]# vim /usr/local/prometheus/prometheus.yml
  - job_name: 'Mysql server'
    static_configs:
      - targets:
        - "172.16.1.51:9104"
#重载prometheus
[root@prometheus ~]# prometheus --config.file=/usr/local/prometheus/prometheus.yml
url: https://grafana.com/contact?plcmt=top-nav&cta=contactus
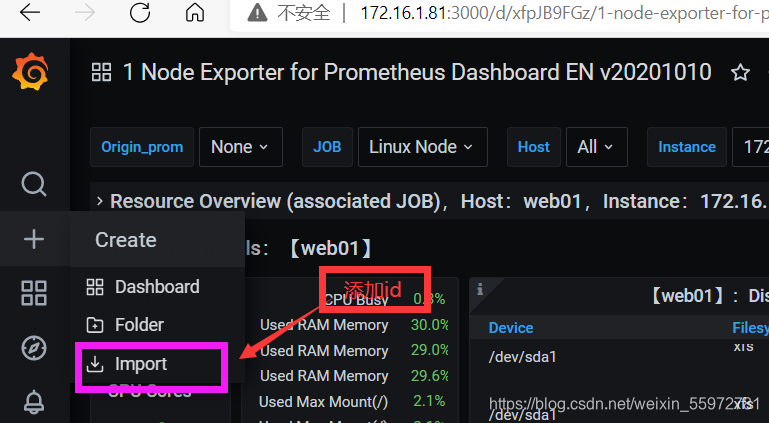
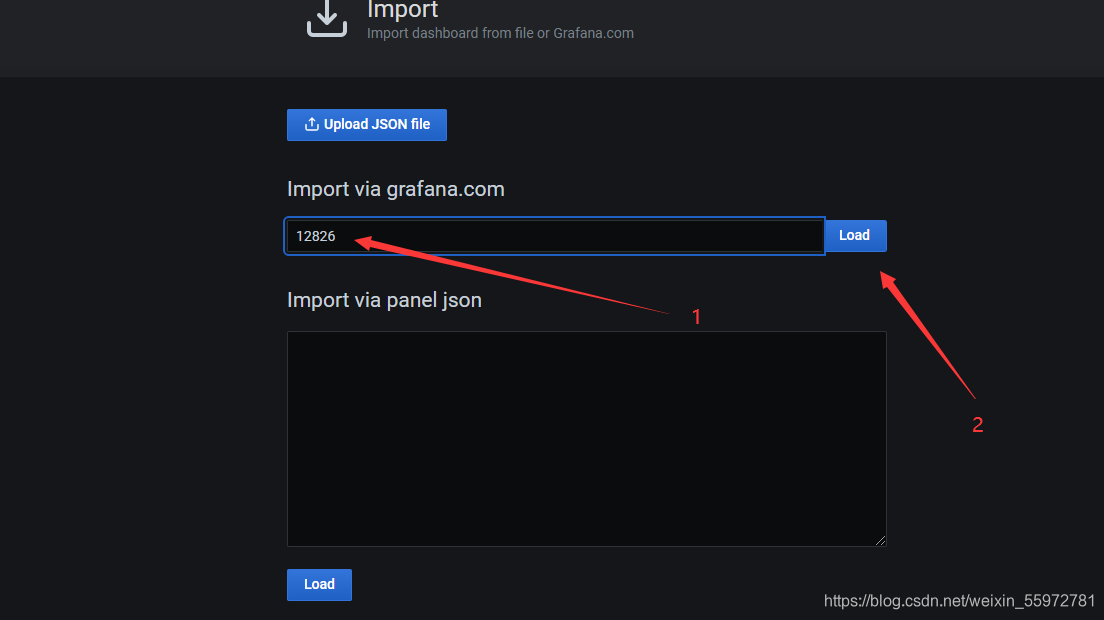
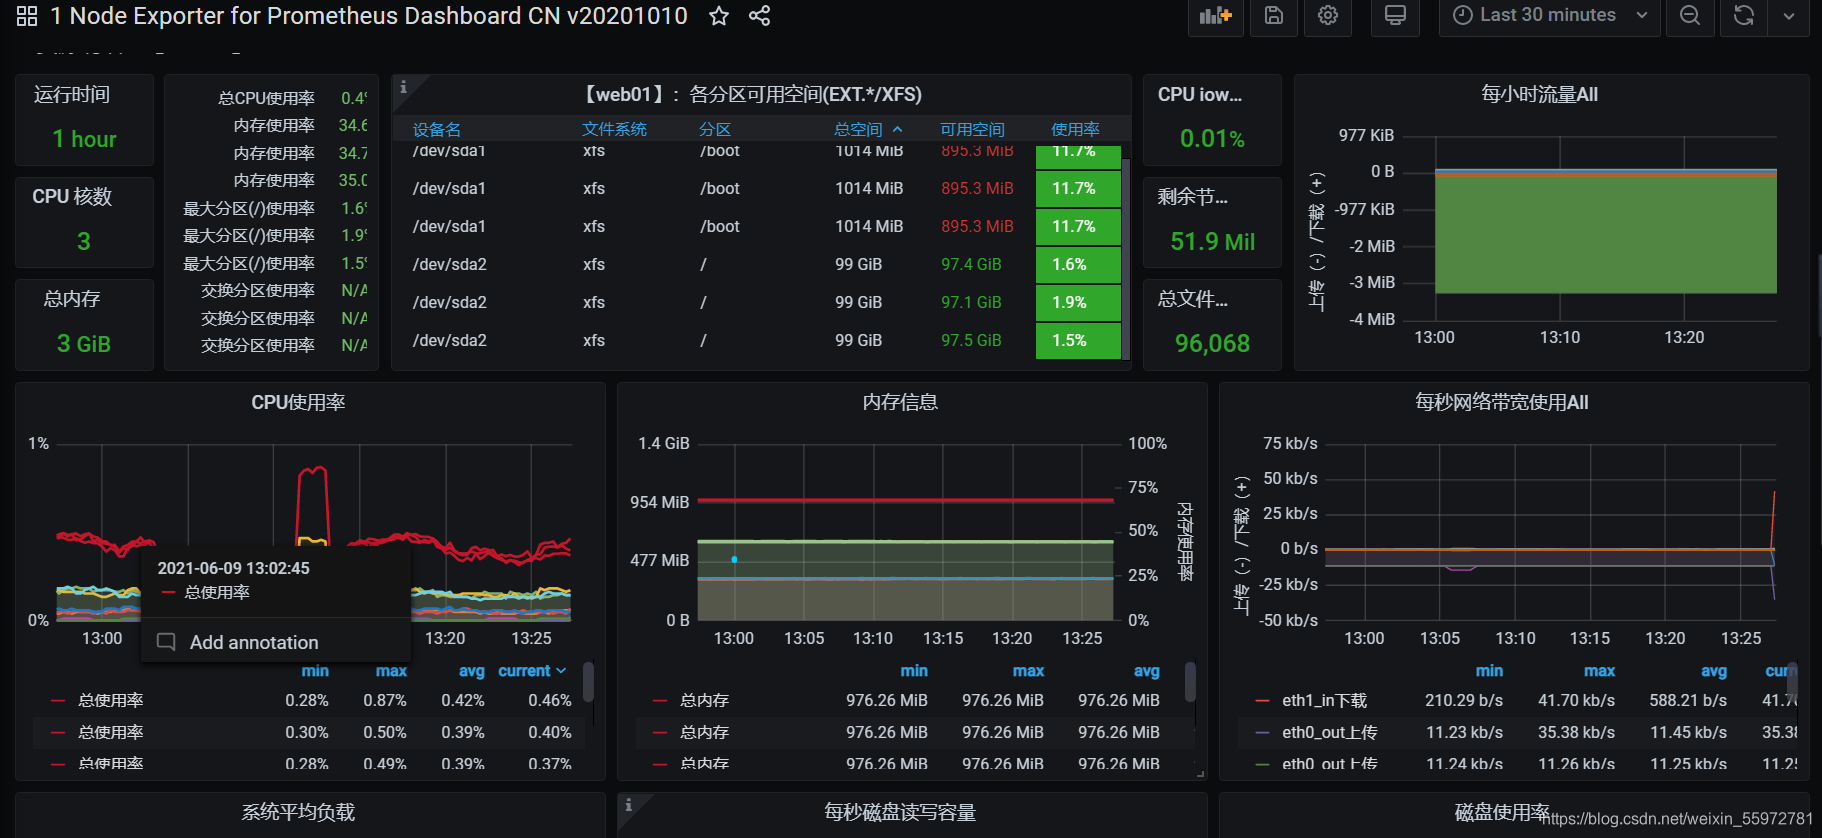
3、grafana显示数据
本文来自博客园,作者:ଲ小何才露煎煎饺,转载请注明原文链接:https://www.cnblogs.com/zeny/p/15121535.html

 浙公网安备 33010602011771号