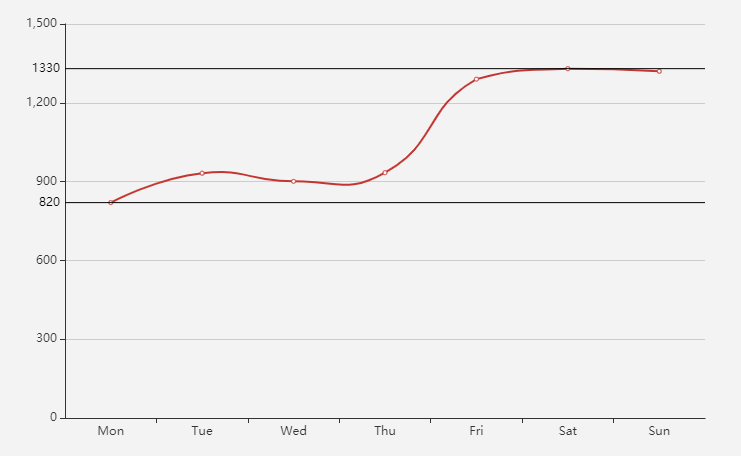
echart曲线图标识最大值、最小值、平均值

option = {
            xAxis: {
                type: 'category',
                data: ['Mon', 'Tue', 'Wed', 'Thu', 'Fri', 'Sat', 'Sun']
            },
            yAxis: {
                type: 'value'
            },
            series: [{
                data: [820, 932, 901, 934, 1290, 1330, 1320],
                type: 'line',
                smooth: true,
                markLine: {
                    symbol: 'none',
                    itemStyle: {
                        normal: {
                            lineStyle: {
                                type: 'solid',
                                color: '#000'
                            },
                            label: {
                                show: true,
                                position: 'left'
                            }

                        }
                    },
                    data: [{
                            name: '平均线',
                            // 支持 'average', 'min', 'max'
                            type: 'min'
                        },
                        {
                            name: '峰线',
                            // 支持 'average', 'min', 'max'
                            type: 'max'
                        },
                        {
                            name: '谷线',
                            // 支持 'average', 'min', 'max'
                            type: 'min'
                        }

                    ]
                }
            }]
        };


  ### 效果如下:


posted @ 2019-07-25 10:44  曾志呀  阅读(6648)  评论(0编辑  收藏  举报