
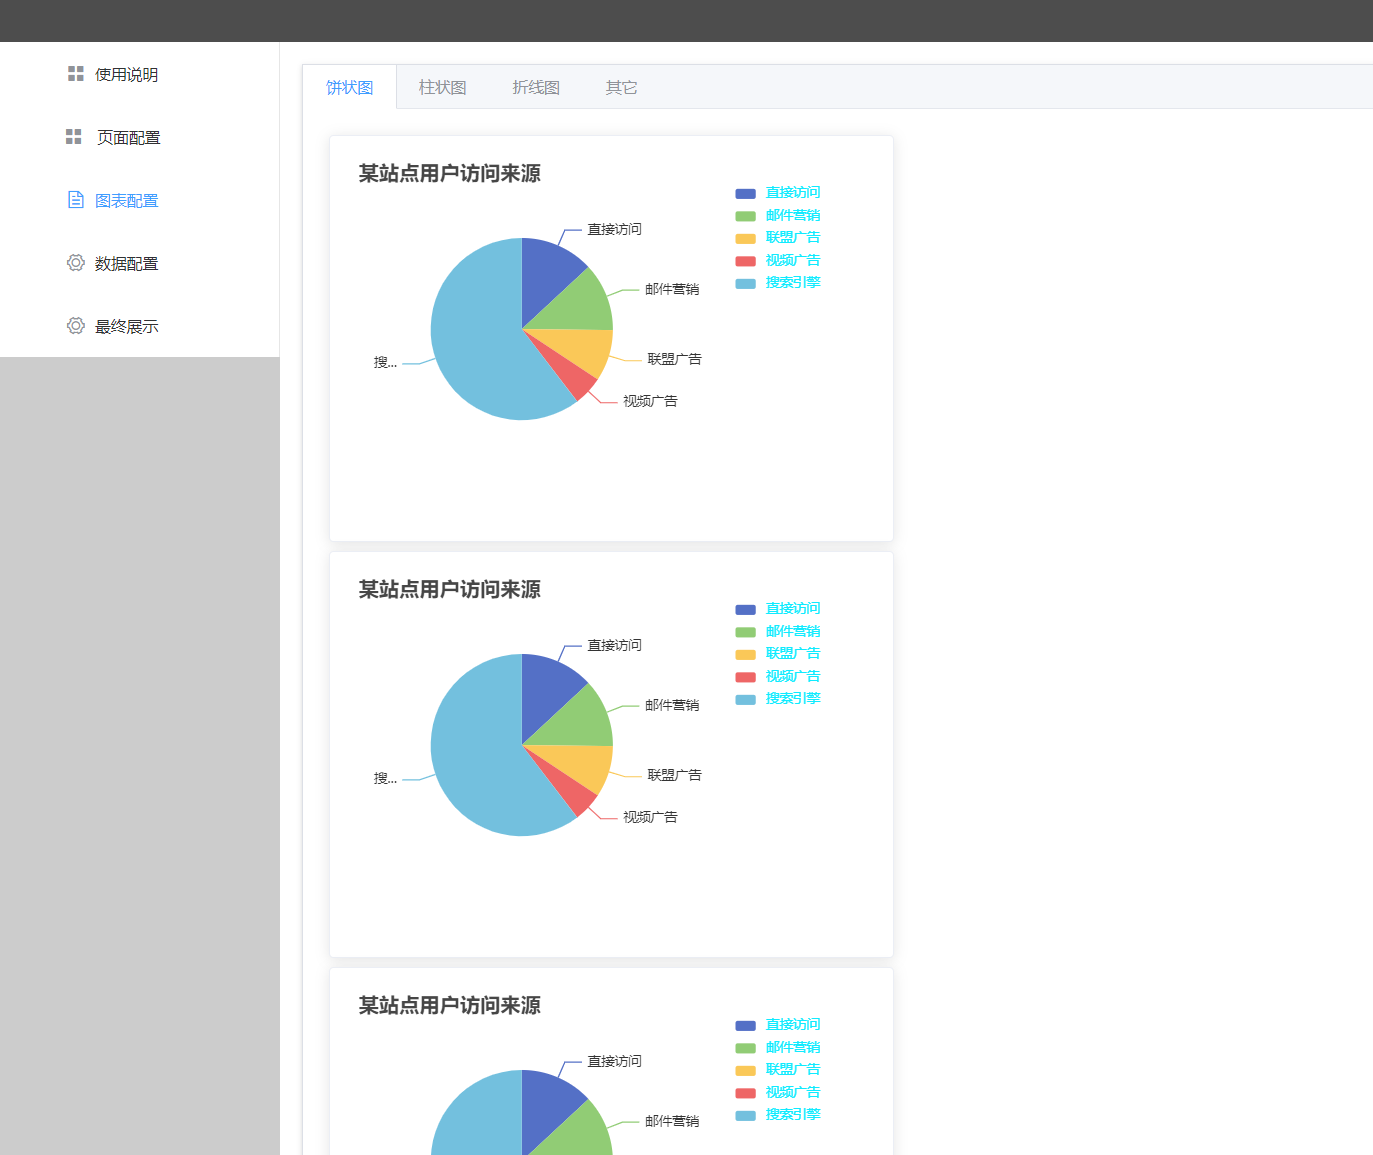
在vue中多次复用封装好的echart组件
echart图表在vue中使用时,因为id是唯一值,所以一般去封装好后在同一时间同一个页面中同时使用一个组件会出现只渲染一个组件的问题,这个原因就是因为echart读取id来进行
option初始化时候不能重复使用。
所以解决这个问题就从这里出发:
思路:在复用封装好的组件时候绑定不同的id即可。
比这里封装好一个图表组件:pie.vue
<template>
    <div class="pie">
         <div >
            <!-- 为 ECharts 准备一个具备大小(宽高)的 DOM -->
            <div :id="idPie" :style="{'width':this.width,'height':this.height}"></div>
        </div>
    </div>
</template>
<script>
import * as echarts from "echarts"
export default {
    name:"Pie",
    props:{
           width : {
            type:String,
            default:'12121'
        },
           height : {
            type:String,
            default:'12121'
        },
        idPie:{
            type:String,
            default:'12121'
        }

    },
    data(){
        return {
        }
    },
    created(){
        console.log('props---',this.idPie,this.width,this.height)
    },
    methods:{
        //初始化数据
    initData() {
      // 基于准备好的dom,初始化echarts实例
      console.log(this.idPie)
      var myChart = echarts.init(document.getElementById(this.idPie));
      // 绘制图表
      myChart.setOption({
          title : {
              text: '某站点用户访问来源',//主标题
            //   subtext: '纯属虚构',//副标题
              x:'left',//x轴方向对齐方式
          },
          tooltip : {
              trigger: 'item',
              formatter: "{a} <br/>{b} : {c} ({d}%)"
          },
          legend: {
          selectedMode: true,
          width: 100,
          itemWidth: 18,
          itemHeight: 9,
          right: 10,
          top: 20,
          itemGap: 8,
          textStyle: {
            padding: [0, 0, 0, 4],
            fontSize: 12,
            color: "#0FEBFF",
          },
        },
        //   legend: {
        //       orient: 'vertical',
        //       bottom: 'bottom',
        //       data: ['直接访问','邮件营销','联盟广告','视频广告','搜索引擎']
        //   },
          series : [
              {
                  name: '访问来源',
                  type: 'pie',
                  radius : '40%',
                  center: ['30%', '40%'],
                  data:[
                      {value:335, name:'直接访问'},
                      {value:310, name:'邮件营销'},
                      {value:234, name:'联盟广告'},
                      {value:135, name:'视频广告'},
                      {value:1548, name:'搜索引擎'}
                  ],
                  itemStyle: {
                      emphasis: {
                          shadowBlur: 10,
                          shadowOffsetX: 0,
                          shadowColor: 'rgba(0, 0, 0, 0.5)'
                      }
                  }
              }
          ]
      });
    },

    },
     mounted(){
    this.initData();
  },

}
</script>
<style scoped>

</style>
在需要复用的vue中这样使用即可:
<template>
    <div class="pieSetting">
            <el-card style="width:500px;height:360px;margin:8px;">
                <pie id-pie="idpie1" :width="width" :height="height"></pie>
            </el-card>
             <el-card style="width:500px;height:360px;margin:8px;">
                <pie id-pie="idpie2" :width="width" :height="height"></pie>
            </el-card>
            <el-card>
                2
            </el-card>
    </div>
</template>
<script>
import pie from "../charts/Pie/pie1.vue"
export default {
    name:"PieSetting",
    components:{
        pie
    },
    data(){
        return {
            width:"200px",
            height:"380px",
    }
    },
    methods:{

    }
}
</script>
<style scoped>

</style>

 浙公网安备 33010602011771号