echarts-数据组图例说明-legend
数据图例的说明一般是legend内设置:不管是柱状还是折线还是环形
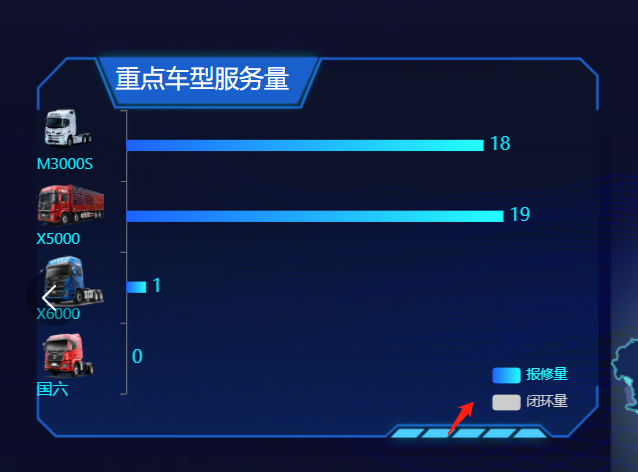
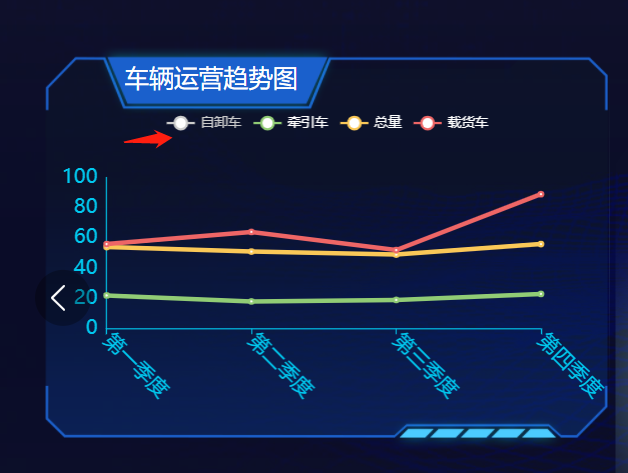
lengend同时还可以点击选择显示对应此项目图例的表项
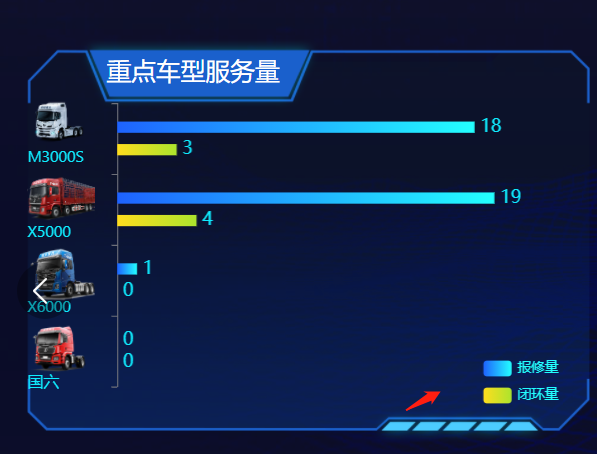
柱状图图例设置例:
option:{
         legend: {
            data: ["报修量", "闭环量"],
            textStyle: {  // 图列内容样式
                color: '#23ffff',  // 字体颜色
            },
            x: "80%",//图例位置,设置right发现图例和文字位置反了,设置一个数值就好了
            y: "80%"//延Y轴居中
        },
}

series:[
 {
            name: "报修量",
            type: "bar",
            barWidth: 10, //柱图宽度
            barGap: "100%", //多个并排柱子设置柱子之间的间距
            data: data1Arr,
            label: seriesLabel,
            itemStyle: {
              color: new echarts.graphic.LinearGradient(0, 0, 1, 0, [
                { offset: 1, color: "#23FFFF" }, //柱图渐变色
                { offset: 0, color: "#1E62FF" }, //柱图渐变色
              ]),
            },
          },
          {
            name: "闭环量",
            type: "bar",
            barWidth: 10, //柱图宽度
            // barCategoryGap:'10%',
            barGap: "100%", //多个并排柱子设置柱子之间的间距
            label: seriesLabel,//柱子上设置说明
            data: data2Arr,
            // data: [150, 105, 110,33],
            itemStyle: {
              color: new echarts.graphic.LinearGradient(0, 0, 1, 0, [
                // { offset: 1, color: "#23FFFF" }, //柱图渐变色
                // { offset: 0, color: "#1E62FF" }, //柱图渐变色
                 { offset: 1, color: "#ace42d" }, //柱图渐变色
                { offset: 0, color: "#ffdd1e" }, //柱图渐变色
              ]),
            },
          },
]


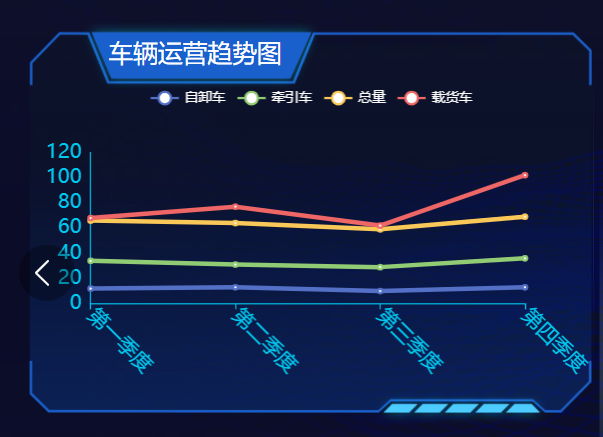
折线图lengend图例:
option:{
 legend: {
                     orient: 'horizontal',
                   data: ['自卸车', '牵引车', '总量', '载货车'],
                   textStyle:{
                       color:"#fff"
                   }
                },
     series: [
                    {
                        lineStyle:{
                            width:4
                        },
                        name: '自卸车', // 红色线条
                        type: 'line',
                        stack: '总量',
                        // data: [12, 13, 10, 13, 9, 23, 21,21,11,8,1,3]
                        data: this.caryunyingDate[0]
                    },
                    {
                         lineStyle:{
                            width:4
                        },
                        name: '牵引车', // 黄色线条
                        type: 'line',
                        stack: '总量',
                        // data: [22, 18, 19, 23, 29, 33, 31,22,11,43,12,5]
                        data: this.caryunyingDate[1]
                    },
                    {
                         lineStyle:{
                            width:4
                        },
                        name: '总量', // 蓝色线条
                        type: 'line',
                        stack: '总量',
                        data: this.caryunyingDate[2]
                        // data: [15, 23, 20, 15, 19, 33, 41,22,11,11,13,3]
                    },
                    {
                         lineStyle:{
                            width:4
                        },
                        name: '载货车', // 绿色线条
                        type: 'line',
                        stack: '总量',
                        data: this.caryunyingDate[3]
                        // data: [32, 33, 30, 33, 39, 33, 32,3,5,12,21,2]
                    }
                ]
}


需要额外注意的事项:
legend内的data是需要显示在图例上的项,需要跟series内每个对象数据的name一一对应上的,否则此项图例就不会显示出来。
图例可以具体进行字体颜色位置调整的,具体调整在legend内配置即可


【推荐】国内首个AI IDE,深度理解中文开发场景,立即下载体验Trae
【推荐】编程新体验,更懂你的AI,立即体验豆包MarsCode编程助手
【推荐】抖音旗下AI助手豆包,你的智能百科全书,全免费不限次数
【推荐】轻量又高性能的 SSH 工具 IShell:AI 加持,快人一步
· Linux系列:如何用heaptrack跟踪.NET程序的非托管内存泄露
· 开发者必知的日志记录最佳实践
· SQL Server 2025 AI相关能力初探
· Linux系列:如何用 C#调用 C方法造成内存泄露
· AI与.NET技术实操系列(二):开始使用ML.NET
· 被坑几百块钱后,我竟然真的恢复了删除的微信聊天记录!
· 没有Manus邀请码?试试免邀请码的MGX或者开源的OpenManus吧
· 【自荐】一款简洁、开源的在线白板工具 Drawnix
· 园子的第一款AI主题卫衣上架——"HELLO! HOW CAN I ASSIST YOU TODAY
· Docker 太简单,K8s 太复杂?w7panel 让容器管理更轻松!
2020-07-27 vue-cli3+搭建完脚手架后快速取消严格模式
2020-07-27 ant-vue之导航跳转(非点击导航事件)动态监听路由变化