数据分析三剑客numpy pandas Matplotlib
NumPy 简单使用
NumPy(Numerical Python) 是 Python 语言的一个扩展程序库,支持大量的维度数组与矩阵运算,此外也针对数组运算提供大量的数学函数库。
import numpy as np
np.array([1,2,3,4,5]) #一维数组
np.array([[1,2,3.2],[4,5,6]]) #二维数组的创建
注意:
numpy默认ndarray的所有元素的类型是相同的
如果传进来的列表中包含不同的类型,则统一为同一类型,优先级:str>float>int
matplotlib 绘图的
使用matplotlib.pyplot获取一个numpy数组,数据来源于一张图片
import matplotlib.pyplot as plt
%matplotlib inline

cat_img_arr = plt.imread('./cat.jpg')#外部图片装numpy中
cat_img_arr
cat_img_arr.shape#显示维度
plt.imshow(cat_img_arr)#显示3唯数组
plt.imshow(cat_img_arr+100)
索引
arr = np.random.randint(60,100,size=(7,5))创建啊一个随机的7行5列的数据
根据索引修改数据
arr[0]#取出第一行
arr[[0,1]]#取出前2行
切片
array([[75, 90, 93, 74, 91],
       [62, 62, 83, 88, 62],
       [78, 61, 92, 67, 82],
       [66, 73, 62, 61, 66],
       [93, 73, 72, 67, 93],
       [79, 71, 98, 69, 62],
       [64, 94, 98, 83, 74]])
arr[0:2]#获取二维数组前两列
array([[75, 90, 93, 74, 91],
       [62, 62, 83, 88, 62]])
arr[:,0:2]  #逗号左边表示行 右边表示列
array([[75, 90],
       [62, 62],
       [78, 61],
       [66, 73],
       [93, 73],
       [79, 71],
       [64, 94]])
arr[0:2,0:2]#获取二维数组前两行和前两列数据
array([[75, 90],
       [62, 62]])
arr[::-1]#将数组的行倒序
arr[:,::-1]#列倒序
arr[::-1,::-1] #全部倒序
plt.imshow(cat_img_arr[:,::-1,:])#小猫左右反转

arr_3 = np.concatenate((cat_img_arr,cat_img_arr,cat_img_arr),axis=1)#1是横向
arr_9 = np.concatenate((arr_3,arr_3,arr_3),axis=0)#0是纵向
plt.imshow(arr_9)
Pandas 的数据结构
from pandas import Series,DataFrame#pandas的重点
import pandas as pd
import numpy as np
Series是一种类似与一维数组的对象,由下面两个部分组成:
- values:一组数据(ndarray类型)
- index:相关的数据索引标签
#使用列表创建Series
Series(data=[1,2,3])
Series(data=[1,2,3],index=['a','b','c'])#通过index设置显示索引
由字典创建:不能在使用index.但是依然存在默认索引
注意:数据源必须为一维数据
dic = {
    '语文':99,
    '数学':100,
    '英语':88,
    '理综':120
}
s = Series(data=dic)
使用多种方法创建以下Series,命名为s1:
语文 150
数学 150
英语 150
理综 300
Series的索引和切片
import pandas as pd
import numpy as np
dic={
    '语文':99,
    '数学':100,
    '英文':88
}
s=Series(data=dic)
print(s[0])
print(s[0:2])
########
99
########
语文     99
数学    100
s['毛概'] = 111 向Series增加一行:相当于给字典增加一组键值对
可以通过shape,size,index,values等得到series的属性
s.values#打印出所有的values
array([100, 120, 88, 99, 111], dtype=int64)
可以使用s.head(),tail()分别查看前n个和后n个值
s.tail(2)
对Series元素进行去重
s1 = Series(data=[1,1,1,2,2,2,3,3,4,56,6,7,8,8,8,7])
s1.unique()
当索引没有对应的值时,可能出现缺失数据显示NaN(not a number)的情况
- 使得两个Series进行相加
s1 = Series(data=[1,2,3],index=['a','b','c'])
s2 = Series(data=[1,2,3],index=['a','b','d'])
s = s1 + s2
a    2.0
b    4.0
c    NaN
d    NaN
可以使用pd.isnull(),pd.notnull(),或s.isnull(),notnull()函数检测缺失数据
pd.isnull()#检测哪些是空
pd.notnull()#返回非空的值
DataFrame
DataFrame是一个【表格型】的数据结构。DataFrame由按一定顺序排列的多列数据组成。设计初衷是将Series的使用场景从一维拓展到多维。DataFrame既有行索引,也有列索引。
- 行索引:index
- 列索引:columns
- 值:values
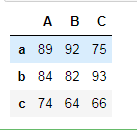
使用ndarray创建DataFrame 二维的
df = DataFrame(data=np.random.randint(60,100,size=(3,3)))
df

df = DataFrame(data=np.random.randint(60,100,size=(3,3)),index=['a','b','c'],columns=['A','B','C'])
df
DataFrame属性:values、columns、index、shape
df.values
df.index
df.shape
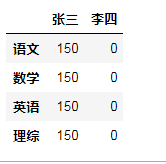
使用ndarray创建DataFrame:创建一个表格用于展示张三,李四,王五的java,python的成绩
dic = {
    '张三':[150,150,150,150],
    '李四':[0,0,0,0]
}
df = DataFrame(data=dic,index=['语文','数学','英语','理综'])
df
#修改列索引
df.columns = ['zhangsan','lisi']
df

#获取前两列
df[[0,1]]
使用.loc[]加index来进行行索引
使用.iloc[]加整数来进行行索引 隐式索引
df.iloc[[0,1]]#取0到1行
df.iloc[3,6]#取绝对3行6列
切片
#切出df中的前两行
df[0:3]
#切出df中的前两列
df.iloc[:,0:2] #必须使用loc、iloc结合着逗号进行切列操作
df[0]#取列
df.iloc[0]#行
df.iloc[1,2]#元素
df[0:2] #切行
df.iloc[:,0:2] #切列
DataFrame的运算
同Series一样:
- 在运算中自动对齐不同索引的数据
- 如果索引不对应,则补NaN
df1 = DataFrame(data=np.random.randint(0,100,size=(3,3)),index=['a','b','c'])
df2 = DataFrame(data=np.random.randint(0,100,size=(3,3)),index=['a','d','c'])
df1+df2

练习:
-
假设ddd是期中考试成绩,ddd2是期末考试成绩,请自由创建ddd2,并将其与ddd相加,求期中期末平均值。
-
假设张三期中考试数学被发现作弊,要记为0分,如何实现?
-
李四因为举报张三作弊立功,期中考试所有科目加100分,如何实现?
-
后来老师发现有一道题出错了,为了安抚学生情绪,给每位学生每个科目都加10分,如何实现?
dic = {
    '张三':[150,150,150,150],
    '李四':[0,0,0,0]
}
df = DataFrame(data=dic,index=['语文','数学','英语','理综'])
qizhong = df
qimo = df

(qizhong+qimo)/2

df.loc['数学','张三'] = 0#行是数学 列是张三
df

qizhong['李四'] += 100
qizhong

qizhong += 10
qizhong
练习
- 使用tushare包获取某股票的历史行情数据。
- 输出该股票所有收盘比开盘上涨3%以上的日期。
- 输出该股票所有开盘比前日收盘跌幅超过2%的日期。
- 假如我从2010年1月1日开始,每月第一个交易日买入1手股票,每年最后一个交易日卖出所有股票,到今天为止,我的收益如何?
df = ts.get_k_data(code='600519',start='2000-01-01')
#将请求的数据存储起来
df.to_csv('./600519.csv')

#将600519.csv文件中的数据读取到df
df = pd.read_csv('./600519.csv',index_col='date',parse_dates=['date'])#把当前时间作为行索引
df.drop(labels='Unnamed: 0',axis=1,inplace=True)#删除列中Unnamed 在当前文件中执行
df.head(5)
#输出该股票所有收盘比开盘上涨3%以上的日期。
#(收盘-开盘) /  开盘 》 0.03
(df['close'] - df['open']) / df['open'] > 0.03#逻辑运算返回true和False
df.loc[[True,False,True]]#筛选为True的
df.loc[(df['close'] - df['open']) / df['open'] > 0.03].index#取出日期
