Echarts 加载省地图json
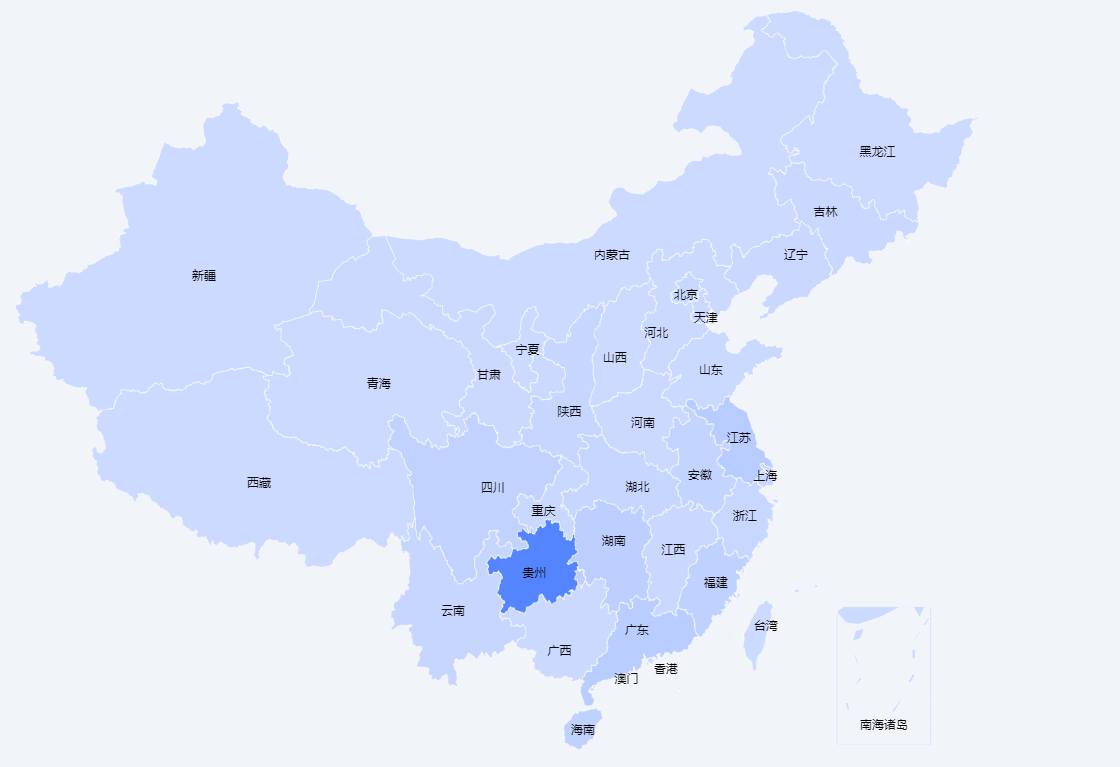
我想要的效果:
解决步骤:
1.安装引入
npm install echarts
import Echarts from 'echarts'
// 全局注册Echarts
Vue.prototype.$Echarts = Echarts
2.引入china.js(我是直接引入安装包里面的文件包,你也可以自行下载到自己的本地目录)
import './../../../node_modules/echarts/map/js/china.js'
3.使用
加载全国地图
loadMap (data, max) {
            let mychart = this.$eCharts.init(document.getElementById('stats-map'))
            mychart.setOption({
                tooltip: {
                    trigger: 'item'
                },
                visualMap: {
                    min: 0,
                    max: max,
                    range: [0, max],
                    show: false,
                    inRange: {
                        color: ['#ccdaff', '#5485FE']
                    }
                },
                series: [
                    {
                        name: '产品分布',
                        type: 'map',
                        mapType: 'china',
                        roam: true,
                        label: {
                        normal: {
                            show: true
                        },
                        emphasis: {
                            show: true
                        }
                        },
                        data: data,
                        itemStyle: {
                            normal: {
                                borderColor: '#ffffff',
                                areaColor: '#ccdaff'
                            },
                            emphasis: {
                                areaColor: '#ffffff',
                                color: '#000',
                                borderWidth: 0,
                                show: false,
                            }
                        }
                    }
                ]
            })
            mychart.on('click', (prams) => {
                // provincePy是为了获得省份的全拼(贵州=>guizhou)
                let shengpy = provincePy(prams.name)
                if (shengpy) {
                    this.loadProvinceMap(shengpy, max, data)
                    mychart.clear()
                }
            })
            setTimeout(function (){
                window.onresize = function () {
                    mychart.resize()
                }
            }, 200)
        }
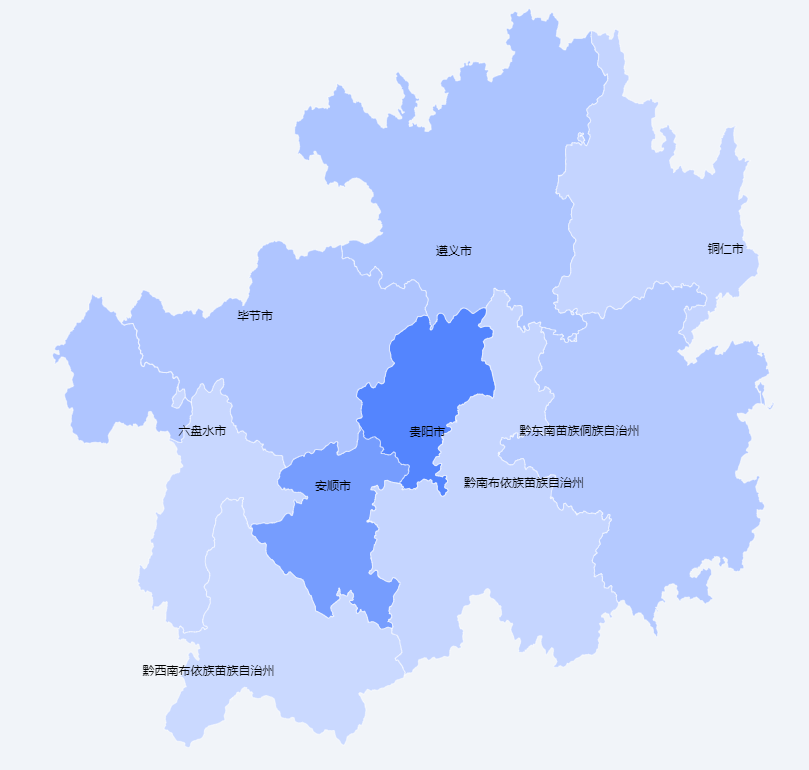
加载某一个省地图
loadProvinceMap (name, max, data) {
           // 加载我下载到本地的全国省区的json文件
           Axios.get(`/static/map/province/${name}.json`)
                .then(res => {
                    let childChart = this.$eCharts.init(document.getElementById('stats-map'));
                    this.$eCharts.registerMap(name, res.data);
                    childChart.setOption({
                        visualMap: {
                            min: 0,
                            max: max,
                            show: false,
                            realtime: false,
                            calculable: true,
                            inRange: {
                                color: ['#ccdaff', '#5485FE']
                            }
                        },
                        tooltip: {
                            formatter: function (params) {
                                const value = isNaN(params.value) ? 0 : params.value
                                return params.name + ": " + value
                            }
                        },
                        series: [{
                            type: 'map',
                            mapType: name,
                            label: {
                                normal: {
                                    show: true
                                },
                                emphasis: {
                                    show: true
                                }
                            },
                            data: data,
                            itemStyle: {
                                normal: {
                                    borderColor: '#ffffff',
                                    areaColor: '#ccdaff'
                                },
                                emphasis: {
                                    areaColor: '#ffffff',
                                    color: '#000',
                                    borderWidth: 0,
                                    show: false,
                                }
                            },
                            animation: false
                        }]
                    })
                    setTimeout(function (){
                        window.onresize = function () {
                            childChart.resize()
                        }
                    }, 200)
                })
                .catch(() => {
                    this.$message.warning('该地区地图数据不存在!')
                })
        }
希望大佬看到有不对的地方,提出博主予以改正!

 浙公网安备 33010602011771号