
使用开源的工具解析erspan流量
Decapsulation ERSPAN Traffic With Open Source Tools
Cisco Encapsulated Remote SPAN (ERSPAN) feature allows to monitor traffic on one or more ports and send the monitored traffic to one or more destination ports. Traffic is encapsulated into GRE tunnel and routed via network to ERSPAN destination. Any device that supports ERSPAN can be used as ERSPAN destination. It might be another Cisco device or Linux with installed software that can decapsulate GRE traffic.
The goal of this article is to show methods and tools for decapsulation of ERSPAN traffic. For this purpose I have built simple lab that consists of a Cisco CSR 1000v router and two Linux boxes. Core Linux represents a network host and generates network traffic (ICMP) that is going to be monitored. It is connected to the port GigabitEthernet1 of the Cisco router. The router is configured to monitor traffic on the port Gi1 and it sends traffic encapsulated in GRE tunneling protocol to IP address 10.230.10.1. It is the IP address of the ERSPAN destination configured on Linux Security Union. Security Onion is a unique Linux distro for intrusion detection, network security monitoring, and log management based on Ubuntu however any other Linux distro can be used.
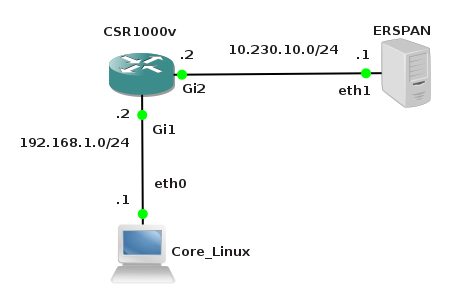
Picture 1 - ERSPAN Lab Topology
Below is an example of ERSPAN configuration on the CSR 1000v router. This is the source ERSPAN type and with configured rspan_id 1. The interface Gi1 is being monitored and the GRE traffic is sent to ERSPAN destination address IP 10.230.10.1.
CSR1000v# show running-config | b monitor
monitor session 1 type erspan-source
description ERSPAN to 10.230.10.1
source interface Gi1
destination
erspan-id 1
mtu 1464
ip address 10.230.10.1
origin ip address 10.230.10.2
You also must issue the command no shutdown after the command monitor session 1 type erspan-source in order to activate session.
1. Capturing ERSPAN Traffic with Wireshark
We are going to capture and analyze ERSPAN traffic with Wireshark packet sniffer. First configure IP address 10.230.10.1 on interface eth1 of the Linux Security Onion.
janosik@onion:~$ sudo su
root@onion# ip address add 10.230.10.1/24 dev eth1
Now use Wireshark to capture GRE traffic on Security Onion on its interface eth1 and ping the router IP address 192.168.1.2 from the Linux Core host (IP 192.168.1.1). If the source ERSPAN is properly configured on router, packets from the subnet 192.168.1.0/24 should appear in Wireshark output.
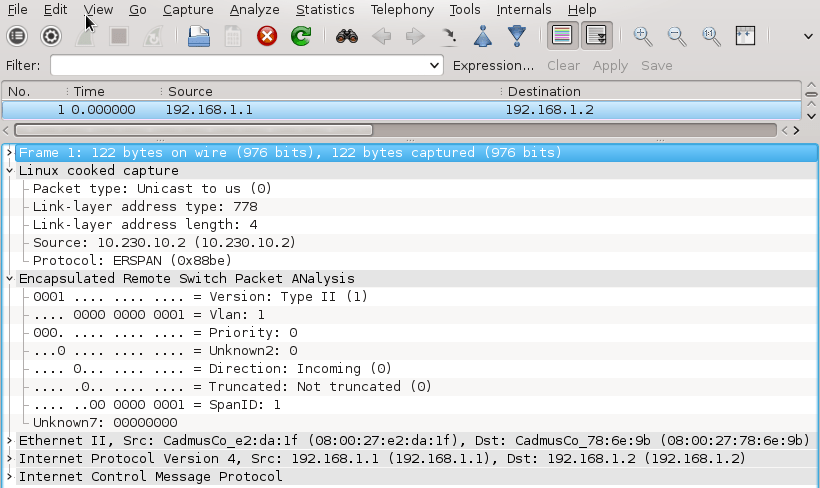
A closer look at the picture below reveals that the original packet ICMP packet (MAC header, IPv4 header and ICMP header) is now encapsulated as following.
MAC header + IPv4 header (10.230.10.2, 10.230.10.1) + GRE header (Protocol type ERSPAN) + ERPAN header + (original packet)
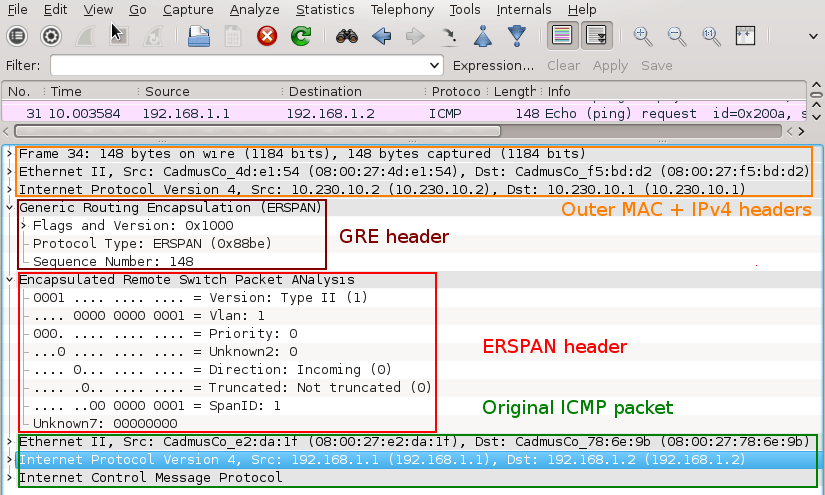
Picture 2 - Encapsulated GRE Traffic Captured on Interface Eth1
An original ICMP packet is encapsulated into GRE tunnel and the new outer MAC and IPv4 + GRE + ERSPAN headers are added to original packets. It allows encapsulated traffic to be forwarded through network to ERSPAN destination. However if we want software application such as IPS/IDS to analyze encapsulated packets, the outer L2 and L3 headers must be striped from packet. This can be done with tools such as RCDCAP which dissects packets from GRE tunnel.
2. Configuring GRE tunnel on ERSPAN Destination Device
If for some reason we do not want to install special software that dissects packets from GRE tunnel we can configure GRE tunnel on ERSPAN destination (Linux Security Onion) and let IDS to listen on a tunneled interface. Thanks to this configuration the outer MAC and IPv4 headers are stripped and do no appear in Wireshark output.
a) Load GRE module to kernel
janosik@onion:~$ sudo su
root@onion# modprobe ip_gre
You can check if GRE module is loaded into a kernel with command below.
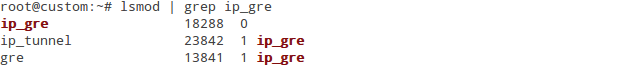
Picture 3 - GRE Module Loaded Into Kernel
b) Choose receiving interface and assign IPv4 to it
root@onion# ip addr add 10.230.10.1/24 dev eth1
Set the MTU of the network interface that receives GRE packets larger than 1500 e.g. to 1900. Otherwise we are going to miss some bytes in larger packets.
root@onion# ip link set dev eth1 mtu 1900
c) Create virtual tunnel interface and associate it with IP previously configured on eth1 interface
root@onion# ip tunnel add mon0 mode gre local 10.230.10.1 ttl 8
d) Add IP address to interface mon0 which is not used for anything
root@onion# ip addr add 1.1.1.1/30 dev mon0
e) Change the state of mon0 device to up
root@onion# ip link set mon0 up
Check status of the interface mon0 with the command below. The interface must be in UP state and the Rx counter should increase.
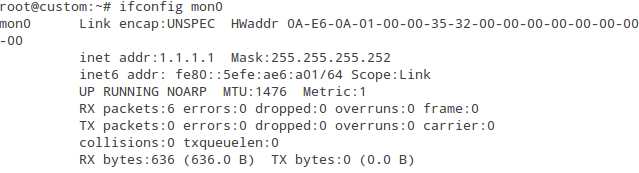
Picture 4 - Status of Interface mon0
Again, generate network traffic in the subnet 192.168.1.0/24 and configure Wireshark to listen on interface mon0. Notice that the outer MAC and Ipv4 header are now stripped from the ICMP packet.
Picture 5 - Decapsulated Traffic Captured on Interface mon0
3. Using RCDCAP for Decapsulating ERSPAN Traffic
RCDCAP is wrapper program that dissects the traffic and creates a virtual interface where the traffic is already decapsulated. The tool is great but an installation process can be somehow tricky. For this reason I have written a script install_rcdcap.sh for Ubuntu 16.04.x. The script downloads and installs RCDCap from Mercurial repository. The actual version of RCDCAP installed from repository and successfully tested in scenario is 0.8. The script cares about all dependencies so basically you should only run the script with the command:
$ bash install_rcdcap.sh.txt
Once RCDCAP is installed configure the interface eth1 for capturing.
user@onion:~$ sudo su
root@onion# ip addr add dev eth1 10.230.10.1/24
root@onion# ip link set dev eth1 mtu 1900
root@onion# ip link set dev eth1 up
Start RCDCAP with the command below and let Wireshark to listen on interface mon1.
root@onion# rcdcap -i eth1 --erspan --tap-persist --tap-device mon1 --expression "host 10.230.10.1"
We can see that RCDCAP have dissected monitored traffic from GRE and only original MAC + IPv4 + ICMP headers and pyaload are presented in Wireshark output.
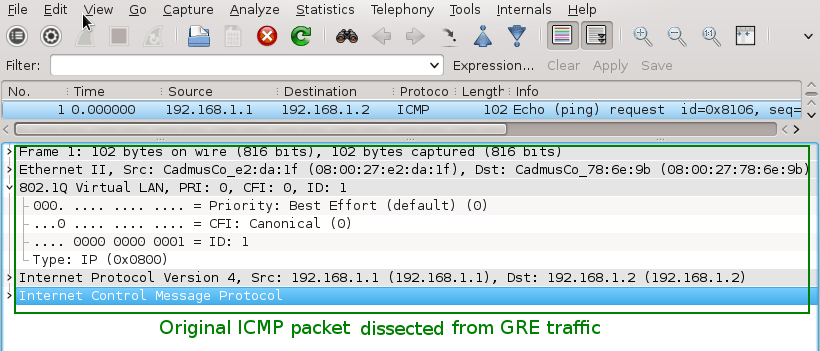
Picture 6 - Decapsulated Traffic Captured on Interface Mon1
Note: To test RCDCAP on Ubuntu Server OS (without GUI), issue the command below.
root@onion# rcdcap -i eth1 --erspan --tap-persist --tap-device mon1 --expression "host 10.230.10.1" &
Afterwards, start capturing a network traffic with tcpdump on the interface mon1 with the following command.
root@onion# tcpdump -i mon1 -v
End.
Reference:
http://packetpushers.net/erspan-new-favorite-packet-capturing-trick/
http://networkengineering.stackexchange.com/questions/3274/remote-sniffing-with-erspan-to-the-desktop

 浙公网安备 33010602011771号