

淘宝双12购物数据分析
随着社会的发展,数据化时代,线上购物比例增幅巨大,各种的线上购物节,6.18、双十一、双十二等等。因此分析双十二活动日时段各行为数量的走势和对比,以及活动前后的每日流量对比。
二、大数据分析设计方案1.pv、uv的趋势对比1212活动前后的每日流量对比流量影响因素。
2.活动前后购买率用户行为偏好(时间维度)日时段各行为数量的走势和对比。
3.活动前后用户转化率对比。
三、数据分析步骤
数据源:https://pan.baidu.com/s/10NsxiSeQekFzELgWFP7-xg?pwd=lfqm导入必要的模块
1 2 3 4 5 6 7 8 | import pandas as pdimport numpy as npimport datetimefrom pyecharts.charts import *from pyecharts.globals import ThemeTypefrom pyecharts.charts import Barfrom pyecharts.charts import Funnelfrom pyecharts import options as opts |
导入和查看数据
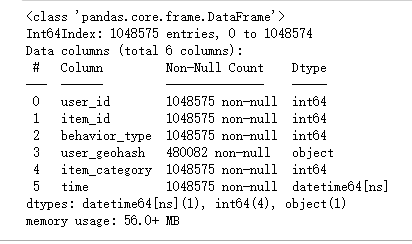
1 2 | df = pd.read_csv(r'tianchi_fresh_comp_train_user.csv')df.info() |
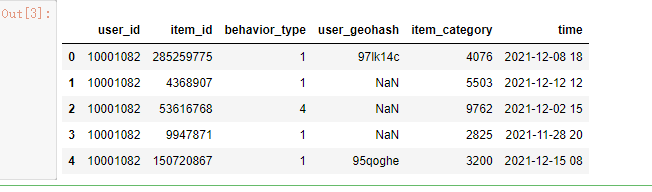
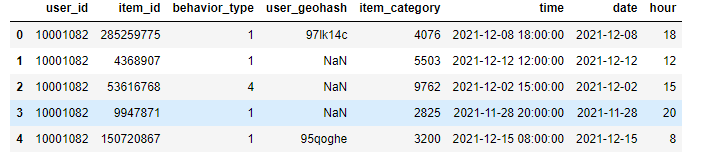
1 | df.head() |
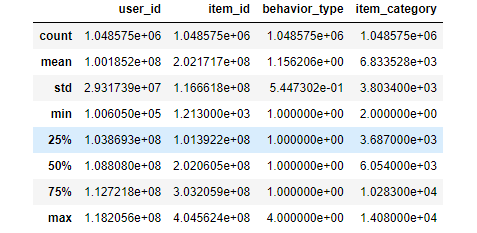
1 | df.describe() |
数据清洗
删除重复值
1 2 | df.drop_duplicates(inplace=True)df.head() |
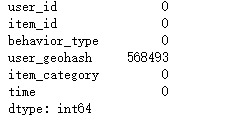
删除null值 因本项目不涉及地区方面的分析,所以可以不删user_geohash 的null值
1 | df.isnull().sum() |
将df.time转成日期格式
1 2 | df['time']=pd.to_datetime(df['time'])df.info() |
增加辅助列:日期date、时段hour (datetime模块)
1 2 3 | df['date'] = df.time.dt.datedf['hour'] = df.time.dt.hourdf.head() |
将某些字段转换成字符串格式
1 2 3 4 | df['user_id'] = df.user_id.values.astype('str')df['item_id'] = df.item_id.values.astype('str')df['behavior_type'] = df.behavior_type.values.astype('str')df.info() |
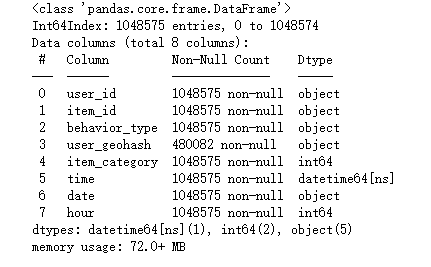
1 | df['item_category'] = df.item_category.values.astype('str') |
数据可视化
每日pv、uv
双y轴双曲线图
1 2 3 4 5 6 7 8 9 | #提取数据pv_day = df[df.behavior_type =='1'].groupby('date')['behavior_type'].count()uv_day = df[df.behavior_type =='1'].drop_duplicates(['user_id','date']).groupby('date')['user_id'].count()#转换成图表所需的格式(list)#1、日期(list.index)date = pv_day.index#2、pv、uv(list.values)pv = np.around(pv_day.values/10000,decimals=2)uv = np.around(uv_day.values/10000,decimals=2) |
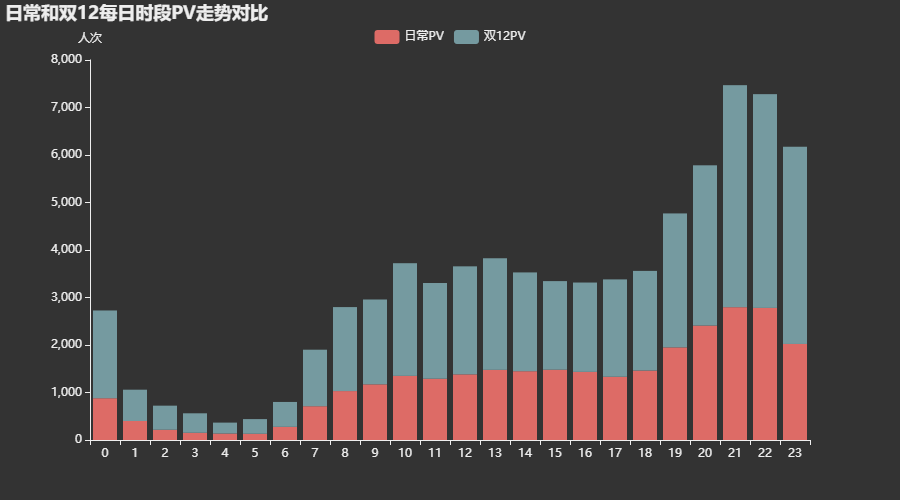
1 2 3 4 5 6 7 8 9 10 11 12 13 14 15 16 17 18 19 20 21 22 23 24 25 26 27 28 29 | #制作图表x=col_hour.index.tolist()y1=np.around(view_hour.values/29,decimals=0).tolist()y8=np.around(view_active_ahour.values/2,decimals=0).tolist()bar=( Bar(init_opts=opts.InitOpts(theme=ThemeType.DARK)) .add_xaxis(xaxis_data=x) .add_yaxis( "日常PV", y1, stack='stack1', label_opts=opts.LabelOpts(is_show=False) ) .add_yaxis( "双12PV", y8, stack='stack1', label_opts=opts.LabelOpts(is_show=False) ) .set_global_opts( title_opts=opts.TitleOpts(title="日常和双12每日时段PV走势对比"), legend_opts=opts.LegendOpts(pos_top='5%'), yaxis_opts=opts.AxisOpts(name='人次', axislabel_opts=opts.LabelOpts(formatter="{value}")) ))bar.render_notebook() |
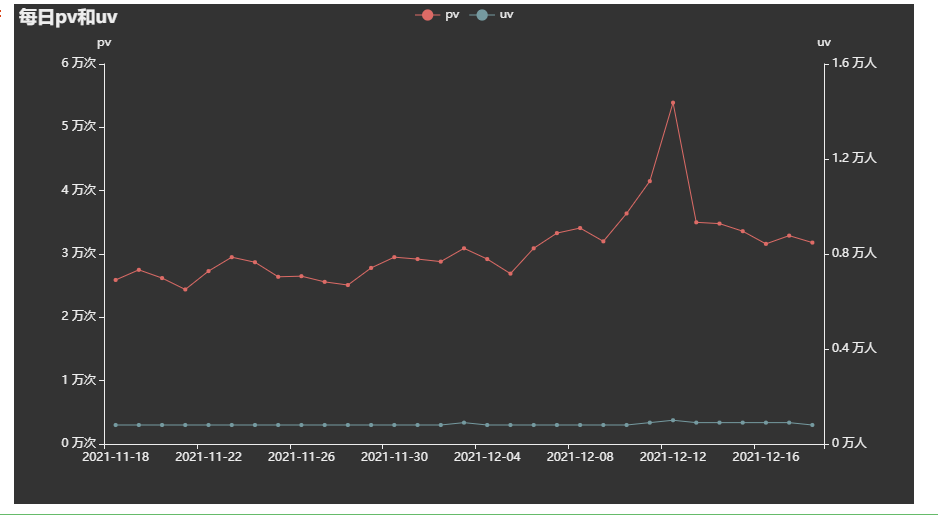
1 2 3 4 5 6 7 8 9 10 11 12 13 14 15 16 17 18 19 20 21 22 23 24 25 26 27 28 29 30 31 32 | # 制作图表x=list(date)y1=pvy2=uvpvuv_day_line = (Line(init_opts=opts.InitOpts(theme=ThemeType.DARK)) #主题设置 .add_xaxis(x) #x轴数据源 .add_yaxis('pv',#图例名字 y1, #y1轴数据源 label_opts=opts.LabelOpts(is_show=False) #不显示数据标签 ) .add_yaxis('uv',#图例名字 yaxis_index=1, #Y的双轴1号索引(区别于y1轴) y_axis=y2, #y2轴数据源 label_opts=opts.LabelOpts(is_show=False) #不显示数据标签 ) .extend_axis( #y2的轴设置 yaxis=opts.AxisOpts( name='uv',#轴名字 min_=0,#轴起点值 max_=1.6, #轴最大值 interval=0.4, #轴区间间隔 axislabel_opts=opts.LabelOpts(formatter="{value} 万人") #轴数据标签格式设置 ) ) .set_global_opts( #全局设置 tooltip_opts=opts.TooltipOpts(is_show=True,trigger="axis",axis_pointer_type='cross'), #随鼠标位置显示xy轴的数据、聚焦形式(交叉) xaxis_opts=opts.AxisOpts(type_='category',axispointer_opts=opts.AxisPointerOpts(is_show=True,type_="shadow")),#随鼠标位置凸显x轴长条、凸显形式(阴影) yaxis_opts=opts.AxisOpts(name='pv',axislabel_opts=opts.LabelOpts(formatter="{value} 万次")),#y1轴(默认轴)名字、轴数据标签格式设置 title_opts=opts.TitleOpts(title="每日pv和uv") #标题 ) )pvuv_day_line.render_notebook() #展示图表 |
分析:
1、双12活动的流量主要集中于12月11日和12日,10日之前并没有太大的上涨,特别是uv的涨幅甚小。建议优化商品预热的活动方案,提前吸引人流进店挑选商品;
2、活动期间pv比uv波动较大,活动引流效应明显;
3、13日之后pv、uv均回落至比活动前稍高的水平;
每日pv、uv增量
双y轴双曲线图
1 2 3 4 5 6 | #提取数据#联结pv、uvpv_uv= pd.merge(pv_day,uv_day,on='date',how='outer')#向下作差(后一日减前一日)new_pv_uv = pv_uv.diff() new_pv_uv.columns=['new_pv','new_uv'] |
分析:
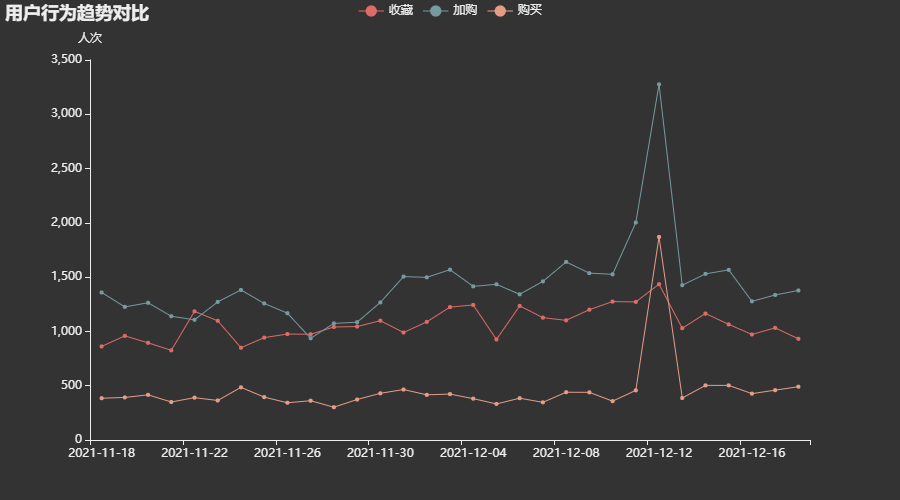
1、活动前有两波收藏、加购小高峰(11.23-25,11.30-12.3),邻近活动,加购数明显上涨,12当天购买人数超活动前的日均加购数。
曲线图
df['date'] = pd.to_datetime(df['date'])
#提取数据
#日常各时段行为总量
daily_df = df[~df['date'].isin(['2021-12-11','2021-12-12'])]
view_hour = daily_df[daily_df.behavior_type =='1'].groupby('hour')['behavior_type'].count()
col_hour = daily_df[daily_df.behavior_type =='2'].groupby('hour')['behavior_type'].count()
add_hour = daily_df[daily_df.behavior_type =='3'].groupby('hour')['behavior_type'].count()
buy_hour = daily_df[daily_df.behavior_type =='4'].groupby('hour')['behavior_type'].count()
#双12各时段行为总量 (日期说明:因双十二开启时间为12月12号零点,活动期间用户行为主要发生时间在11号到12号,因此本次活动分析时筛选的时间为这两天)
active_df = df[df['date'].isin(['2021-12-11','2021-12-12'])]
view_active_ahour = active_df[active_df.behavior_type =='1'].groupby('hour')['behavior_type'].count()
col_active_ahour = active_df[active_df.behavior_type =='2'].groupby('hour')['behavior_type'].count()
add_active_ahour = active_df[active_df.behavior_type =='3'].groupby('hour')['behavior_type'].count()
buy_active_ahour = active_df[active_df.behavior_type =='4'].groupby('hour')['behavior_type'].count()
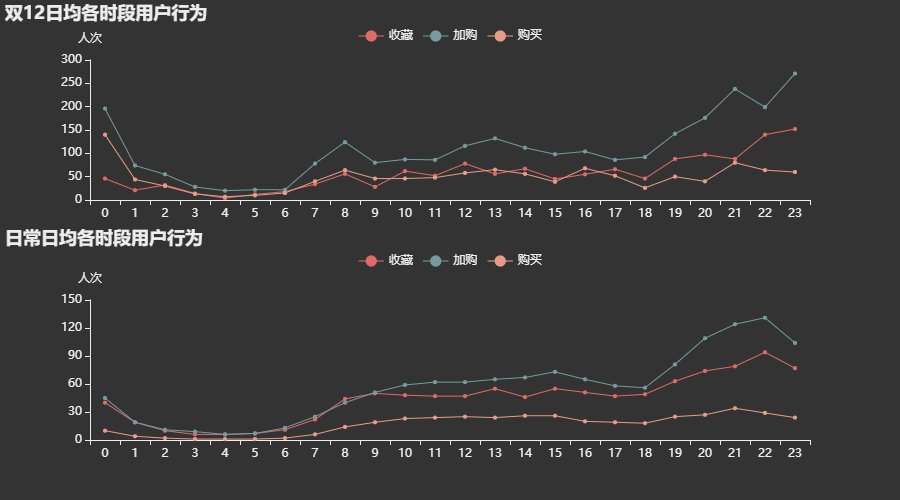
1 2 3 4 5 6 7 8 9 10 11 12 13 14 15 16 17 18 19 20 21 22 23 24 25 26 27 28 29 30 31 32 33 34 35 36 37 38 39 40 41 42 43 44 45 46 47 48 49 50 51 52 53 54 55 56 57 58 59 60 61 62 63 64 65 | # 制作图表x=col_hour.index.tolist()#日常y2=np.around(col_hour.values/29,decimals=0).tolist()y3=np.around(add_hour.values/29,decimals=0).tolist()y4=np.around(buy_hour.values/29,decimals=0).tolist()#双12y5=np.around(col_active_ahour.values/2,decimals=0).tolist()y6=np.around(add_active_ahour.values/2,decimals=0).tolist()y7=np.around(buy_active_ahour.values/2,decimals=0).tolist()daily_line = (Line() .add_xaxis(x) .add_yaxis('收藏', y_axis=y2, label_opts=opts.LabelOpts(is_show=False) ) .add_yaxis('加购', y_axis=y3, label_opts=opts.LabelOpts(is_show=False) ) .add_yaxis('购买', y_axis=y4, label_opts=opts.LabelOpts(is_show=False) ) .set_global_opts( tooltip_opts=opts.TooltipOpts(is_show=True,trigger="axis",axis_pointer_type='cross'), legend_opts=opts.LegendOpts(pos_top='50%'), xaxis_opts=opts.AxisOpts(type_='category',axispointer_opts=opts.AxisPointerOpts(is_show=True,type_="shadow")), yaxis_opts=opts.AxisOpts(name='人次', axislabel_opts=opts.LabelOpts(formatter="{value}")), title_opts=opts.TitleOpts(title="日常日均各时段用户行为",pos_top='45%') ) )active_line = (Line() .add_xaxis(x) .add_yaxis('收藏', y_axis=y5, label_opts=opts.LabelOpts(is_show=False) ) .add_yaxis('加购', y_axis=y6, label_opts=opts.LabelOpts(is_show=False) ) .add_yaxis('购买', y_axis=y7, label_opts=opts.LabelOpts(is_show=False) ) .set_global_opts( tooltip_opts=opts.TooltipOpts(is_show=True,trigger="axis",axis_pointer_type='cross'), legend_opts=opts.LegendOpts(pos_top='5%'), xaxis_opts=opts.AxisOpts(type_='category',axispointer_opts=opts.AxisPointerOpts(is_show=True,type_="shadow")), yaxis_opts=opts.AxisOpts(name='人次', axislabel_opts=opts.LabelOpts(formatter="{value}")), title_opts=opts.TitleOpts(title="双12日均各时段用户行为",pos_top='0%') ) )ggrid = ( #拼图 Grid(init_opts=opts.InitOpts(theme=ThemeType.DARK)) #统一设置主题 .add(active_line, grid_opts=opts.GridOpts(pos_bottom="60%")) #位置 .add(daily_line, grid_opts=opts.GridOpts(pos_top="60%")) #位置)ggrid.render_notebook() |
分析:
1、流量高峰主要在19点开始,23点后下降。建议尽量在19时之前更换好优化后的商品主图、详情页等页面,吸引更多的人流。
不同时段购买率
双轴折线图
1 2 3 4 5 6 7 8 9 10 11 | #准备数据#日常各时段购买率daily_df = df[~df['date'].isin(['2021-12-11','2021-12-12'])]view_user_num = daily_df[daily_df.behavior_type =='1'].drop_duplicates(['user_id','date','hour']).groupby('hour')['behavior_type'].count()buy_user_num = daily_df[daily_df.behavior_type =='4'].drop_duplicates(['user_id','date','hour']).groupby('hour')['behavior_type'].count()daily_buy_rate = buy_user_num/view_user_num#双12各时段购买率active_df = df[df['date'].isin(['2021-12-11','2021-12-12'])]view_active_user_num = active_df[active_df.behavior_type =='1'].drop_duplicates(['user_id','date','hour']).groupby('hour')['behavior_type'].count()buy_active_user_num = active_df[active_df.behavior_type =='4'].drop_duplicates(['user_id','date','hour']).groupby('hour')['behavior_type'].count()acitve_buy_rate = buy_active_user_num/view_active_user_num |
1 2 3 4 5 6 7 8 9 10 11 12 13 14 15 16 17 18 19 20 21 22 23 | x=view_hour.index.tolist() y1 = np.around(daily_buy_rate,decimals=2).tolist()y2 = np.around(acitve_buy_rate,decimals=2).tolist()buy_rate_line = (Line(init_opts=opts.InitOpts(theme=ThemeType.DARK)) .add_xaxis(x) .add_yaxis('日常购买率', y_axis=y1, label_opts=opts.LabelOpts(is_show=True) ) .add_yaxis('双12购买率', y_axis=y2, label_opts=opts.LabelOpts(is_show=True) ) .set_global_opts( tooltip_opts=opts.TooltipOpts(is_show=True,trigger="axis",axis_pointer_type='cross'), xaxis_opts=opts.AxisOpts(type_='category',axispointer_opts=opts.AxisPointerOpts(is_show=True,type_="shadow")), yaxis_opts=opts.AxisOpts(name=' ',axislabel_opts=opts.LabelOpts(formatter="{value}")), title_opts=opts.TitleOpts(title="不同时段购买率"), legend_opts=opts.LegendOpts(pos_top='5%') ) )buy_rate_line.render_notebook() |
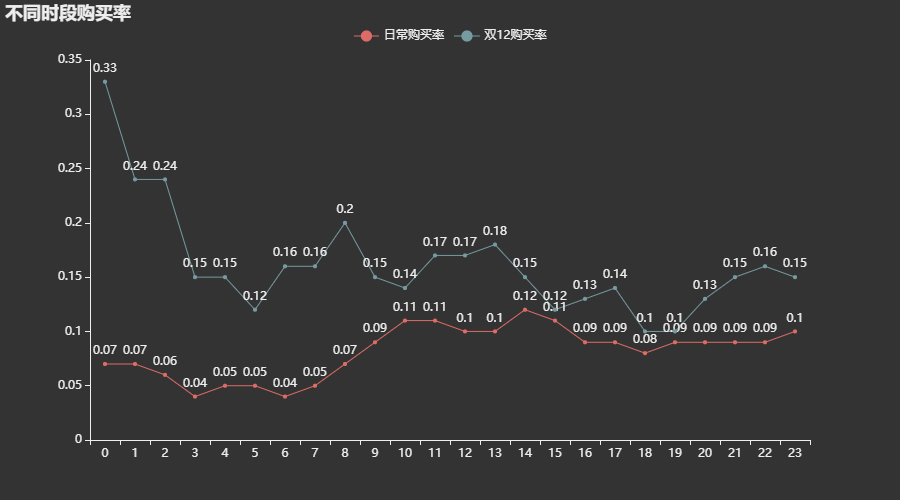
分析:
1、日常和双12活动的转化率大致相似,加购、收藏和购买转化率均很低,引流效果不佳,流失率高。建议:1.优化广告渠道,提高投放精准度,提高渠道引流来的用户质量;2.借鉴优秀同行产品,优化商品主图,提高产品视觉吸引力,增加转换率。
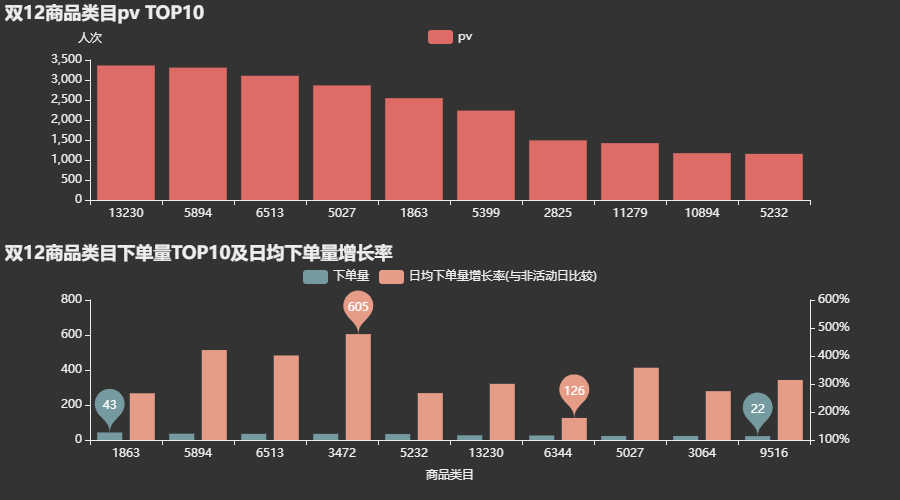
双12行业热度top10排名和分析
条形图*2
1 2 3 4 5 6 7 8 9 10 11 12 13 14 15 16 17 18 19 20 21 22 23 24 25 26 27 28 29 30 31 32 33 34 35 36 37 38 39 40 41 42 43 44 45 46 47 48 49 50 51 52 53 54 55 56 57 58 59 60 61 62 63 64 65 66 67 68 69 70 71 72 73 74 75 76 77 78 79 80 81 82 83 84 85 86 87 88 89 90 91 92 93 94 95 96 97 | #提取数据#1、流量:类目的pv top10active_df = df[df['date'].isin(['2021-12-11','2021-12-12'])]# 降序view_active_num = active_df[active_df.behavior_type =='1'].groupby('item_category')['behavior_type'].count().sort_values(ascending=False)# 取前十名x1= view_active_num.index.tolist()[0:10]y1=view_active_num.values.tolist()[0:10]#2、购买增长率:双12类目下单量top10 及其日均下单量增长率 对比# 双12购买数active_df = df[df['date'].isin(['2021-12-11','2021-12-12'])]buy_active_num =active_df[active_df.behavior_type =='4'].groupby('item_category')['behavior_type'].count().reset_index()#日常购买数daily_df = df[~df['date'].isin(['2021-12-11','2021-12-12'])]buy_num = daily_df[daily_df.behavior_type =='4'].groupby('item_category')['behavior_type'].count().reset_index()#合并view_buy_avg = buy_active_num.merge(buy_num,how='inner',left_on='item_category',right_on='item_category')view_buy_avg.columns=['item_category','buy_active_num','buy_num']#计算增长率view_buy_avg['buy_active_avg']=view_buy_avg['buy_active_num']/2view_buy_avg['buy_avg']=view_buy_avg['buy_num']/29view_buy_avg['growth_rate']=(view_buy_avg['buy_active_avg']-view_buy_avg['buy_avg'])/view_buy_avg['buy_avg']# 降序view_buy_avg.sort_values(by=['buy_active_num'],axis=0,ascending=False,inplace=True)#取前十名x2=view_buy_avg.item_category.tolist()[0:10]y2=view_buy_avg.buy_active_num.tolist()[0:10]y3=np.around(view_buy_avg.growth_rate*100,0).tolist()[0:10]#制作图表view_active_bar=( Bar(init_opts=opts.InitOpts(theme=ThemeType.DARK)) .add_xaxis(xaxis_data=x1) .add_yaxis( "pv", y1, color='rgb(300, 0, 100, 0.2)', label_opts=opts.LabelOpts(is_show=False) ) .set_global_opts( title_opts=opts.TitleOpts(title="双12商品类目pv TOP10"), legend_opts=opts.LegendOpts(pos_top='5%'), xaxis_opts=opts.AxisOpts(name=' ',name_location = "middle"), yaxis_opts=opts.AxisOpts(name='人次', axislabel_opts=opts.LabelOpts(formatter="{value}")) ))buy_active_bar=( Bar(init_opts=opts.InitOpts(theme=ThemeType.PURPLE_PASSION)) .add_xaxis(xaxis_data=x2) .add_yaxis( "下单量", y2, label_opts=opts.LabelOpts(is_show=False) ) .add_yaxis('日均下单量增长率(与非活动日比较)', yaxis_index=1, y_axis=y3, label_opts=opts.LabelOpts(is_show=False) ) .extend_axis( yaxis=opts.AxisOpts( name=' ', min_=100, max_=600, interval=100, axislabel_opts=opts.LabelOpts(formatter="{value}%") ) ) .set_global_opts( title_opts=opts.TitleOpts(title="双12商品类目下单量TOP10及日均下单量增长率",pos_top='48%'), legend_opts=opts.LegendOpts(pos_top='53%'), xaxis_opts=opts.AxisOpts(name='商品类目',name_location = "middle",name_gap=30), yaxis_opts=opts.AxisOpts(name=' ',is_show = True, min_=0, max_=800, interval=200, axislabel_opts=opts.LabelOpts(formatter="{value}")) ) .set_series_opts( markpoint_opts=opts.MarkPointOpts(data=[ #标记最值! opts.MarkPointItem(type_="min",value_index=1,name="最小值"), opts.MarkPointItem(type_="max",value_index=1,name="最大值")]) ) )ggrid = ( Grid(init_opts=opts.InitOpts(theme=ThemeType.DARK)) .add(view_active_bar, grid_opts=opts.GridOpts(pos_bottom="60%")) .add(buy_active_bar, grid_opts=opts.GridOpts(pos_top="60%")) )ggrid.render_notebook() |
分析:
1、编号为11279、2825、10894的商品类目,虽然PV排前十,但下单量并没有排在前十,说明引流效果不佳,有待优化广告营销策略。
2、编号为6344、5027、13230、9516、1838的商品类目,均,属于下单量的top10,说明该商品类目销售无需太依赖pv流量,在广告方面的支出花费可能相对较少。
3、下单量排名第5到10名的商品类目,虽然销量不是最高,但相较于第3、4名,它们的双12下单量相较于日常的增长率均较高,说明这些类目的销售增长明显、热度较高,受到消费者的近期关注;建议该类目商家抓住机会加大广告营销、商品的研发,提高商家的知名度、口碑,提高服务质量。
项目源码:
1 2 3 4 5 6 7 8 9 10 11 12 13 14 15 16 17 18 19 20 21 22 23 24 25 26 27 28 29 30 31 32 33 34 35 36 37 38 39 40 41 42 43 44 45 46 47 48 49 50 51 52 53 54 55 56 57 58 59 60 61 62 63 64 65 66 67 68 69 70 71 72 73 74 75 76 77 78 79 80 81 82 83 84 85 86 87 88 89 90 91 92 93 94 95 96 97 98 99 100 101 102 103 104 105 106 107 108 109 110 111 112 113 114 115 116 117 118 119 120 121 122 123 124 125 126 127 128 129 130 131 132 133 134 135 136 137 138 139 140 141 142 143 144 145 146 147 148 149 150 151 152 153 154 155 156 157 158 159 160 161 162 163 164 165 166 167 168 169 170 171 172 173 174 175 176 177 178 179 180 181 182 183 184 185 186 187 188 189 190 191 192 193 194 195 196 197 198 199 200 201 202 203 204 205 206 207 208 209 210 211 212 213 214 215 216 217 218 219 220 221 222 223 224 225 226 227 228 229 230 231 232 233 234 235 236 237 238 239 240 241 242 243 244 245 246 247 248 249 250 251 252 253 254 255 256 257 258 259 260 261 262 263 264 265 266 267 268 269 270 271 272 273 274 275 276 277 278 279 280 281 282 283 284 285 286 287 288 289 290 291 292 293 294 295 296 297 298 299 300 301 302 303 304 305 306 307 308 309 310 311 312 313 314 315 316 317 318 319 320 321 322 | import pandas as pdimport numpy as npimport datetimefrom pyecharts.charts import *from pyecharts.globals import ThemeTypefrom pyecharts.charts import Barfrom pyecharts.charts import Funnelfrom pyecharts import options as optsdf = pd.read_csv(r'tianchi_fresh_comp_train_user.csv')df.info()df.head()df.describe()df.drop_duplicates(inplace=True)df.head()df.isnull().sum()df['time']=pd.to_datetime(df['time'])df.info()df['date'] = df.time.dt.datedf['hour'] = df.time.dt.hourdf.head()df['user_id'] = df.user_id.values.astype('str')df['item_id'] = df.item_id.values.astype('str')df['behavior_type'] = df.behavior_type.values.astype('str')df.info()df['item_category'] = df.item_category.values.astype('str')#提取数据pv_day = df[df.behavior_type =='1'].groupby('date')['behavior_type'].count()uv_day = df[df.behavior_type =='1'].drop_duplicates(['user_id','date']).groupby('date')['user_id'].count()#转换成图表所需的格式(list)#1、日期(list.index)date = pv_day.index#2、pv、uv(list.values)pv = np.around(pv_day.values/10000,decimals=2)uv = np.around(uv_day.values/10000,decimals=2)#制作图表x=col_hour.index.tolist()y1=np.around(view_hour.values/29,decimals=0).tolist()y8=np.around(view_active_ahour.values/2,decimals=0).tolist()bar=( Bar(init_opts=opts.InitOpts(theme=ThemeType.DARK)) .add_xaxis(xaxis_data=x) .add_yaxis( "日常PV", y1, stack='stack1', label_opts=opts.LabelOpts(is_show=False) ) .add_yaxis( "双12PV", y8, stack='stack1', label_opts=opts.LabelOpts(is_show=False) ) .set_global_opts( title_opts=opts.TitleOpts(title="日常和双12每日时段PV走势对比"), legend_opts=opts.LegendOpts(pos_top='5%'), yaxis_opts=opts.AxisOpts(name='人次', axislabel_opts=opts.LabelOpts(formatter="{value}")) ))bar.render_notebook()# 制作图表x=list(date)y1=pvy2=uvpvuv_day_line = (Line(init_opts=opts.InitOpts(theme=ThemeType.DARK)) #主题设置 .add_xaxis(x) #x轴数据源 .add_yaxis('pv',#图例名字 y1, #y1轴数据源 label_opts=opts.LabelOpts(is_show=False) #不显示数据标签 ) .add_yaxis('uv',#图例名字 yaxis_index=1, #Y的双轴1号索引(区别于y1轴) y_axis=y2, #y2轴数据源 label_opts=opts.LabelOpts(is_show=False) #不显示数据标签 ) .extend_axis( #y2的轴设置 yaxis=opts.AxisOpts( name='uv',#轴名字 min_=0,#轴起点值 max_=1.6, #轴最大值 interval=0.4, #轴区间间隔 axislabel_opts=opts.LabelOpts(formatter="{value} 万人") #轴数据标签格式设置 ) ) .set_global_opts( #全局设置 tooltip_opts=opts.TooltipOpts(is_show=True,trigger="axis",axis_pointer_type='cross'), #随鼠标位置显示xy轴的数据、聚焦形式(交叉) xaxis_opts=opts.AxisOpts(type_='category',axispointer_opts=opts.AxisPointerOpts(is_show=True,type_="shadow")),#随鼠标位置凸显x轴长条、凸显形式(阴影) yaxis_opts=opts.AxisOpts(name='pv',axislabel_opts=opts.LabelOpts(formatter="{value} 万次")),#y1轴(默认轴)名字、轴数据标签格式设置 title_opts=opts.TitleOpts(title="每日pv和uv") #标题 ) )pvuv_day_line.render_notebook() #展示图表#提取数据#联结pv、uvpv_uv= pd.merge(pv_day,uv_day,on='date',how='outer')#向下作差(后一日减前一日)new_pv_uv = pv_uv.diff() new_pv_uv.columns=['new_pv','new_uv']df['date'] = pd.to_datetime(df['date'])#提取数据#日常各时段行为总量daily_df = df[~df['date'].isin(['2021-12-11','2021-12-12'])]view_hour = daily_df[daily_df.behavior_type =='1'].groupby('hour')['behavior_type'].count()col_hour = daily_df[daily_df.behavior_type =='2'].groupby('hour')['behavior_type'].count()add_hour = daily_df[daily_df.behavior_type =='3'].groupby('hour')['behavior_type'].count()buy_hour = daily_df[daily_df.behavior_type =='4'].groupby('hour')['behavior_type'].count()#双12各时段行为总量 (日期说明:因双十二开启时间为12月12号零点,活动期间用户行为主要发生时间在11号到12号,因此本次活动分析时筛选的时间为这两天)active_df = df[df['date'].isin(['2021-12-11','2021-12-12'])]view_active_ahour = active_df[active_df.behavior_type =='1'].groupby('hour')['behavior_type'].count()col_active_ahour = active_df[active_df.behavior_type =='2'].groupby('hour')['behavior_type'].count()add_active_ahour = active_df[active_df.behavior_type =='3'].groupby('hour')['behavior_type'].count()buy_active_ahour = active_df[active_df.behavior_type =='4'].groupby('hour')['behavior_type'].count()# 制作图表x=col_hour.index.tolist()#日常y2=np.around(col_hour.values/29,decimals=0).tolist()y3=np.around(add_hour.values/29,decimals=0).tolist()y4=np.around(buy_hour.values/29,decimals=0).tolist()#双12y5=np.around(col_active_ahour.values/2,decimals=0).tolist()y6=np.around(add_active_ahour.values/2,decimals=0).tolist()y7=np.around(buy_active_ahour.values/2,decimals=0).tolist()daily_line = (Line() .add_xaxis(x) .add_yaxis('收藏', y_axis=y2, label_opts=opts.LabelOpts(is_show=False) ) .add_yaxis('加购', y_axis=y3, label_opts=opts.LabelOpts(is_show=False) ) .add_yaxis('购买', y_axis=y4, label_opts=opts.LabelOpts(is_show=False) ) .set_global_opts( tooltip_opts=opts.TooltipOpts(is_show=True,trigger="axis",axis_pointer_type='cross'), legend_opts=opts.LegendOpts(pos_top='50%'), xaxis_opts=opts.AxisOpts(type_='category',axispointer_opts=opts.AxisPointerOpts(is_show=True,type_="shadow")), yaxis_opts=opts.AxisOpts(name='人次', axislabel_opts=opts.LabelOpts(formatter="{value}")), title_opts=opts.TitleOpts(title="日常日均各时段用户行为",pos_top='45%') ) )active_line = (Line() .add_xaxis(x) .add_yaxis('收藏', y_axis=y5, label_opts=opts.LabelOpts(is_show=False) ) .add_yaxis('加购', y_axis=y6, label_opts=opts.LabelOpts(is_show=False) ) .add_yaxis('购买', y_axis=y7, label_opts=opts.LabelOpts(is_show=False) ) .set_global_opts( tooltip_opts=opts.TooltipOpts(is_show=True,trigger="axis",axis_pointer_type='cross'), legend_opts=opts.LegendOpts(pos_top='5%'), xaxis_opts=opts.AxisOpts(type_='category',axispointer_opts=opts.AxisPointerOpts(is_show=True,type_="shadow")), yaxis_opts=opts.AxisOpts(name='人次', axislabel_opts=opts.LabelOpts(formatter="{value}")), title_opts=opts.TitleOpts(title="双12日均各时段用户行为",pos_top='0%') ) )ggrid = ( #拼图 Grid(init_opts=opts.InitOpts(theme=ThemeType.DARK)) #统一设置主题 .add(active_line, grid_opts=opts.GridOpts(pos_bottom="60%")) #位置 .add(daily_line, grid_opts=opts.GridOpts(pos_top="60%")) #位置)ggrid.render_notebook()#准备数据#日常各时段购买率daily_df = df[~df['date'].isin(['2021-12-11','2021-12-12'])]view_user_num = daily_df[daily_df.behavior_type =='1'].drop_duplicates(['user_id','date','hour']).groupby('hour')['behavior_type'].count()buy_user_num = daily_df[daily_df.behavior_type =='4'].drop_duplicates(['user_id','date','hour']).groupby('hour')['behavior_type'].count()daily_buy_rate = buy_user_num/view_user_num#双12各时段购买率active_df = df[df['date'].isin(['2021-12-11','2021-12-12'])]view_active_user_num = active_df[active_df.behavior_type =='1'].drop_duplicates(['user_id','date','hour']).groupby('hour')['behavior_type'].count()buy_active_user_num = active_df[active_df.behavior_type =='4'].drop_duplicates(['user_id','date','hour']).groupby('hour')['behavior_type'].count()acitve_buy_rate = buy_active_user_num/view_active_user_numx=view_hour.index.tolist() y1 = np.around(daily_buy_rate,decimals=2).tolist()y2 = np.around(acitve_buy_rate,decimals=2).tolist()buy_rate_line = (Line(init_opts=opts.InitOpts(theme=ThemeType.DARK)) .add_xaxis(x) .add_yaxis('日常购买率', y_axis=y1, label_opts=opts.LabelOpts(is_show=True) ) .add_yaxis('双12购买率', y_axis=y2, label_opts=opts.LabelOpts(is_show=True) ) .set_global_opts( tooltip_opts=opts.TooltipOpts(is_show=True,trigger="axis",axis_pointer_type='cross'), xaxis_opts=opts.AxisOpts(type_='category',axispointer_opts=opts.AxisPointerOpts(is_show=True,type_="shadow")), yaxis_opts=opts.AxisOpts(name=' ',axislabel_opts=opts.LabelOpts(formatter="{value}")), title_opts=opts.TitleOpts(title="不同时段购买率"), legend_opts=opts.LegendOpts(pos_top='5%') ) )buy_rate_line.render_notebook()#提取数据#1、流量:类目的pv top10active_df = df[df['date'].isin(['2021-12-11','2021-12-12'])]# 降序view_active_num = active_df[active_df.behavior_type =='1'].groupby('item_category')['behavior_type'].count().sort_values(ascending=False)# 取前十名x1= view_active_num.index.tolist()[0:10]y1=view_active_num.values.tolist()[0:10]#2、购买增长率:双12类目下单量top10 及其日均下单量增长率 对比# 双12购买数active_df = df[df['date'].isin(['2021-12-11','2021-12-12'])]buy_active_num =active_df[active_df.behavior_type =='4'].groupby('item_category')['behavior_type'].count().reset_index()#日常购买数daily_df = df[~df['date'].isin(['2021-12-11','2021-12-12'])]buy_num = daily_df[daily_df.behavior_type =='4'].groupby('item_category')['behavior_type'].count().reset_index()#合并view_buy_avg = buy_active_num.merge(buy_num,how='inner',left_on='item_category',right_on='item_category')view_buy_avg.columns=['item_category','buy_active_num','buy_num']#计算增长率view_buy_avg['buy_active_avg']=view_buy_avg['buy_active_num']/2view_buy_avg['buy_avg']=view_buy_avg['buy_num']/29view_buy_avg['growth_rate']=(view_buy_avg['buy_active_avg']-view_buy_avg['buy_avg'])/view_buy_avg['buy_avg']# 降序view_buy_avg.sort_values(by=['buy_active_num'],axis=0,ascending=False,inplace=True)#取前十名x2=view_buy_avg.item_category.tolist()[0:10]y2=view_buy_avg.buy_active_num.tolist()[0:10]y3=np.around(view_buy_avg.growth_rate*100,0).tolist()[0:10]#制作图表view_active_bar=( Bar(init_opts=opts.InitOpts(theme=ThemeType.DARK)) .add_xaxis(xaxis_data=x1) .add_yaxis( "pv", y1, color='rgb(300, 0, 100, 0.2)', label_opts=opts.LabelOpts(is_show=False) ) .set_global_opts( title_opts=opts.TitleOpts(title="双12商品类目pv TOP10"), legend_opts=opts.LegendOpts(pos_top='5%'), xaxis_opts=opts.AxisOpts(name=' ',name_location = "middle"), yaxis_opts=opts.AxisOpts(name='人次', axislabel_opts=opts.LabelOpts(formatter="{value}")) ))buy_active_bar=( Bar(init_opts=opts.InitOpts(theme=ThemeType.PURPLE_PASSION)) .add_xaxis(xaxis_data=x2) .add_yaxis( "下单量", y2, label_opts=opts.LabelOpts(is_show=False) ) .add_yaxis('日均下单量增长率(与非活动日比较)', yaxis_index=1, y_axis=y3, label_opts=opts.LabelOpts(is_show=False) ) .extend_axis( yaxis=opts.AxisOpts( name=' ', min_=100, max_=600, interval=100, axislabel_opts=opts.LabelOpts(formatter="{value}%") ) ) .set_global_opts( title_opts=opts.TitleOpts(title="双12商品类目下单量TOP10及日均下单量增长率",pos_top='48%'), legend_opts=opts.LegendOpts(pos_top='53%'), xaxis_opts=opts.AxisOpts(name='商品类目',name_location = "middle",name_gap=30), yaxis_opts=opts.AxisOpts(name=' ',is_show = True, min_=0, max_=800, interval=200, axislabel_opts=opts.LabelOpts(formatter="{value}")) ) .set_series_opts( markpoint_opts=opts.MarkPointOpts(data=[ #标记最值! opts.MarkPointItem(type_="min",value_index=1,name="最小值"), opts.MarkPointItem(type_="max",value_index=1,name="最大值")]) ) )ggrid = ( Grid(init_opts=opts.InitOpts(theme=ThemeType.DARK)) .add(view_active_bar, grid_opts=opts.GridOpts(pos_bottom="60%")) .add(buy_active_bar, grid_opts=opts.GridOpts(pos_top="60%")) )ggrid.render_notebook() |
四、总结


【推荐】国内首个AI IDE,深度理解中文开发场景,立即下载体验Trae
【推荐】编程新体验,更懂你的AI,立即体验豆包MarsCode编程助手
【推荐】抖音旗下AI助手豆包,你的智能百科全书,全免费不限次数
【推荐】轻量又高性能的 SSH 工具 IShell:AI 加持,快人一步
· 无需6万激活码!GitHub神秘组织3小时极速复刻Manus,手把手教你使用OpenManus搭建本
· Manus爆火,是硬核还是营销?
· 终于写完轮子一部分:tcp代理 了,记录一下
· 别再用vector<bool>了!Google高级工程师:这可能是STL最大的设计失误
· 单元测试从入门到精通