/**
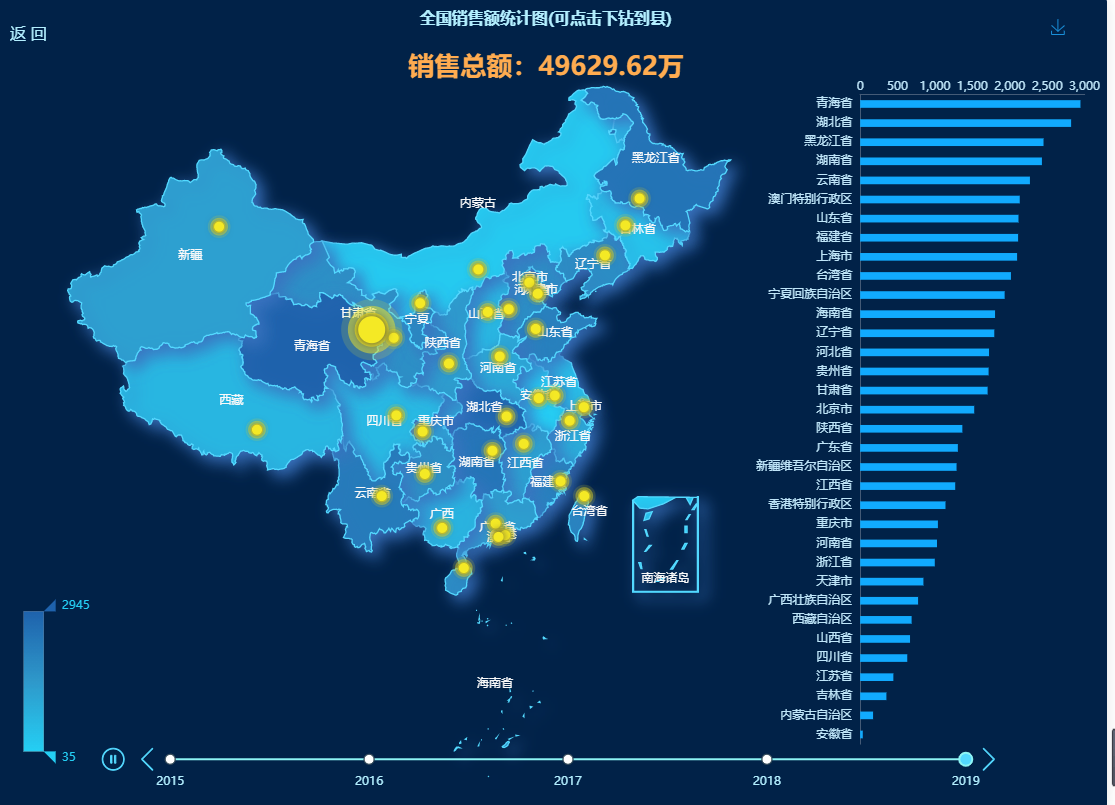
* 地图3.0版本 ,修改时间轴控件和事件,封装geoJson获取事件
* 显示南海诸岛 下钻的标题样式修改
* 设置geoIndex 和 visualMap 里面的seriesIndex 就可以让地图和点同时存在
* 这个时候地图颜色的配置就在 geo里面配置了而不是 series里面
* 借鉴了一些社区大佬的作品
*
* github上有完整的vue代码,感兴趣的可以去看看,觉得有用的可以点个star
* 地址:https://github.com/biubiubiu01/EchartsMap
*
* 预览地址:https://gist006.gitee.io/echartsmap/#/
*
* 高德点击下钻的简易版本可以去看我的另一个:
* https://gallery.echartsjs.com/editor.html?c=xz3jGj90ns
*
* vue-antd-admin后台管理系统,有兴趣可以看看:
* https://github.com/biubiubiu01/vue-antd-admin
*
* 全国所有市县Geojson下载地址:
* http://datav.aliyun.com/tools/atlas/#&lat=31.840232667909365&lng=104.2822265625&zoom=4
*
* 想显示南海诸岛的话可以将 map属性设置为'china'
*
* 欢迎大家提供改进建议和反馈bug
*
*/
$('<div class="back">返 回</div>').appendTo(
$('#chart-panel')
);
$('.back').css({
'position': 'absolute',
'left': '25px',
'top': '25px',
'color': 'rgb(179, 239, 255)',
'font-size': '16px',
cursor: 'pointer',
'z-index': '100'
})
$('.back').click(function() {
if (parentInfo.length === 1) {
return;
}
parentInfo.pop()
init(parentInfo[parentInfo.length - 1].code)
})
var geoJson = {}
var parentInfo = [{
cityName: '全国',
code: 100000
}]
var currentIndex = 0
var timeTitle = ['2015', '2016', '2017', '2018', '2019']
init(100000)
function init(adcode){
getGeoJson(adcode).then(data => {
geoJson = data
getMapData()
})
}
//这里我封装了下,直接可以拿过来用
function getGeoJson(adcode, childAdcode = '') {
return new Promise((resolve, reject) => {
function insideFun(adcode, childAdcode) {
AMapUI.loadUI(['geo/DistrictExplorer'], DistrictExplorer => {
var districtExplorer = new DistrictExplorer();
districtExplorer.loadAreaNode(adcode, function(error, areaNode) {
if (error) {
console.error(error);
reject(error);
return;
}
let Json = areaNode.getSubFeatures();
if (Json.length === 0) {
let parent = areaNode._data.geoData.parent.properties.acroutes;
insideFun(parent[parent.length - 1], adcode);
return;
}
if (childAdcode) {
Json = Json.filter(item => {
return item.properties.adcode == childAdcode;
});
}
let mapJson = {
features: Json
};
resolve(mapJson);
});
});
}
insideFun(adcode, childAdcode);
});
}
//获取数据
function getMapData() {
let mapData = [],
pointData = [],
sum = 0
geoJson.features.forEach(item => {
let value = Math.random() * 3000
mapData.push({
name: item.properties.name,
value: value,
cityCode: item.properties.adcode
})
pointData.push({
name: item.properties.name,
value: [item.properties.center[0], item.properties.center[1], value],
cityCode: item.properties.adcode
})
sum += value
})
mapData = mapData.sort(function(a, b) {
return b.value - a.value
});
initEchartMap(mapData, sum, pointData)
}
//渲染echarts
function initEchartMap(mapData, sum, pointData) {
var xData = [],
yData = []
var min = mapData[mapData.length - 1].value
var max = mapData[0].value
if (mapData.length === 1) {
min = 0
}
mapData.forEach(c => {
xData.unshift(c.name)
yData.unshift(c.value)
})
//这里做个切换,全国的时候才显示南海诸岛 只有当注册的名字为china的时候才会显示南海诸岛
echarts.registerMap(parentInfo.length === 1 ? 'china' : 'map', geoJson);
var option = {
timeline: {
data: timeTitle,
axisType: 'category',
autoPlay: true,
playInterval: 5000,
left: '10%',
right: '10%',
bottom: '2%',
width: '80%',
label: {
normal: {
textStyle: {
color: 'rgb(179, 239, 255)'
}
},
emphasis: {
textStyle: {
color: '#fff'
}
}
},
currentIndex: currentIndex,
symbolSize: 10,
lineStyle: {
color: '#8df4f4'
},
checkpointStyle: {
borderColor: '#8df4f4',
color: '#53D9FF',
borderWidth: 2,
},
controlStyle: {
showNextBtn: true,
showPrevBtn: true,
normal: {
color: '#53D9FF',
borderColor: '#53D9FF'
},
emphasis: {
color: 'rgb(58,115,192)',
borderColor: 'rgb(58,115,192)'
}
},
},
baseOption: {
backgroundColor: '#012248',
title: [{
left: 'center',
top: 10,
text: parentInfo[parentInfo.length - 1].cityName + '销售额统计图(可点击下钻到县)',
textStyle: {
color: 'rgb(179, 239, 255)',
fontSize: 16
},
},
{
text: "销售总额:" + sum.toFixed(2) + '万',
left: 'center',
top: '6.5%',
textStyle: {
color: '#FFAC50',
fontSize: 26
}
}
],
tooltip: {
trigger: 'axis',
axisPointer: {
type: 'shadow'
},
},
grid: {
right: '2%',
top: '12%',
bottom: '8%',
width: '20%'
},
toolbox: {
feature: {
restore: {
show: false
},
dataView: {
show: false
},
saveAsImage: {
name: parentInfo[parentInfo.length - 1].cityName + '销售额统计图'
},
dataZoom: {
show: false
},
magicType: {
show: false
}
},
iconStyle: {
normal: {
borderColor: '#1990DA'
}
},
top: 15,
right: 35
},
geo: {
map: parentInfo.length === 1 ? 'china' : 'map',
zoom: 1.1,
roam: true,
left:'10%',
top:'15%',
tooltip: {
trigger: 'item',
formatter: (p) => {
let val = p.value[2];
if (window.isNaN(val)) {
val = 0;
}
let txtCon =
"<div style='text-align:left'>" + p.name + ":<br />销售额:" + val.toFixed(2) + '万</div>';
return txtCon;
}
},
label: {
normal: {
show: true,
color: "rgb(249, 249, 249)", //省份标签字体颜色
formatter: p => {
switch (p.name) {
case '内蒙古自治区':
p.name = "内蒙古"
break;
case '西藏自治区':
p.name = "西藏"
break;
case '新疆维吾尔自治区':
p.name = "新疆"
break;
case '宁夏回族自治区':
p.name = "宁夏"
break;
case '广西壮族自治区':
p.name = "广西"
break;
case '香港特别行政区':
p.name = "香港"
break;
case '澳门特别行政区':
p.name = "澳门"
break;
}
return p.name;
}
},
emphasis: {
show: true,
color: '#f75a00',
}
},
itemStyle: {
normal: {
areaColor: '#24CFF4',
borderColor: '#53D9FF',
borderWidth: 1.3,
shadowBlur: 15,
shadowColor: 'rgb(58,115,192)',
shadowOffsetX: 7,
shadowOffsetY: 6,
},
emphasis: {
areaColor: '#8dd7fc',
borderWidth: 1.6,
shadowBlur: 25,
}
},
},
visualMap: {
min: min,
max: max,
left: '3%',
bottom: '5%',
calculable: true,
seriesIndex: [0],
inRange: {
color: ['#24CFF4', '#2E98CA', '#1E62AC']
},
textStyle: {
color: '#24CFF4'
}
},
xAxis: {
type: 'value',
scale: true,
position: 'top',
boundaryGap: false,
splitLine: {
show: false
},
axisLine: {
show: true,
lineStyle: {
color: '#455B77'
}
},
axisTick: {
show: false
},
axisLabel: {
margin: 2,
textStyle: {
color: '#c0e6f9'
}
},
},
yAxis: {
type: 'category',
nameGap: 16,
axisLine: {
show: true,
lineStyle: {
color: '#455B77'
}
},
axisTick: {
show: false,
},
axisLabel: {
interval: 0,
textStyle: {
color: '#c0e6f9'
}
},
data: xData
},
series: [{
name: timeTitle[currentIndex] + '年销售额度',
type: 'map',
geoIndex: 0,
map: parentInfo.length === 1 ? 'china' : 'map',
roam: true,
zoom: 1.3,
tooltip: {
trigger: "item",
formatter: p => {
let val = p.value;
if (p.name == '南海诸岛') return
if (window.isNaN(val)) {
val = 0;
}
let txtCon =
"<div style='text-align:left'>" + p.name + ":<br />销售额:" + val.toFixed(2) + '万</div>';
return txtCon;
}
},
label: {
normal: {
show: false,
},
emphasis: {
show: false,
}
},
data: mapData,
},
{
name: '散点',
type: 'effectScatter',
coordinateSystem: 'geo',
rippleEffect: {
brushType: 'fill'
},
itemStyle: {
normal: {
color: '#F4E925',
shadowBlur: 10,
shadowColor: '#333'
}
},
data: pointData,
symbolSize: function(val) {
let value = val[2]
if (value == max) {
return 27
}
return 10
},
showEffectOn: 'render', //加载完毕显示特效
},
{
type: 'bar',
barGap: '-100%',
barCategoryGap: '60%',
itemStyle: {
normal: {
color: '#11AAFE'
},
emphasis: {
show: false
}
},
data: yData
}
]
},
}
myChart.setOption(option, true)
//点击前解绑,防止点击事件触发多次
myChart.off('click');
myChart.on('click', echartsMapClick);
//监听时间切换事件
myChart.off('timelinechanged');
myChart.on('timelinechanged', params => {
currentIndex = params.currentIndex;
getMapData();
});
}
//echarts点击事件
function echartsMapClick(params) {
if (!params.data) {
return
} else {
//如果当前是最后一级,那就直接return
if (parentInfo[parentInfo.length - 1].code == params.data.cityCode) {
return
}
let data = params.data
parentInfo.push({
cityName: data.name,
code: data.cityCode
})
init(data.cityCode)
}
}