var bgPatternImg = new Image();
bgPatternImg.src = '/asset/get/s/data-1623324803979-ugSvPhTCK.png';
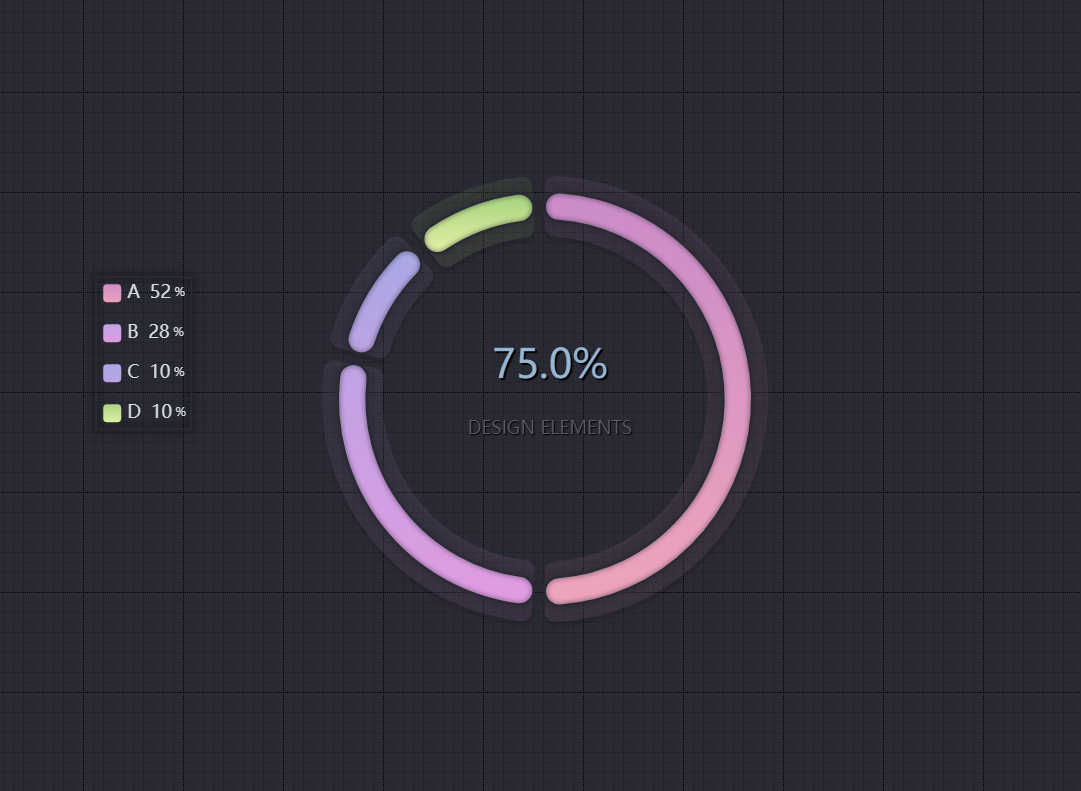
const chartData = [
{
value: 520,
name: 'A',
},
{
value: 280,
name: 'B',
},
{
value: 100,
name: 'C',
},
{
value: 100,
name: 'D',
},
];
const colorList = [
new echarts.graphic.LinearGradient(0, 0, 0, 1, [
{
offset: 0,
color: '#CA8CCA',
},
{
offset: 1,
color: '#EFA5BB',
},
]),
new echarts.graphic.LinearGradient(0, 0, 0, 1, [
{
offset: 0,
color: '#BFA4E4',
},
{
offset: 1,
color: '#E29CE2',
},
]),
new echarts.graphic.LinearGradient(0, 0, 0, 1, [
{
offset: 0,
color: '#A8AAE5',
},
{
offset: 1,
color: '#BEA3E3',
},
]),
new echarts.graphic.LinearGradient(0, 0, 0, 1, [
{
offset: 0,
color: '#A4D37D',
},
{
offset: 1,
color: '#E5F2A7',
},
]),
];
const sum = chartData.reduce((per, cur) => per + cur.value, 0);
const gap = (1 * sum) / 100;
const pieData1 = [];
const pieData2 = [];
const gapData = {
name: '',
value: gap,
itemStyle: {
color: 'transparent',
},
};
for (let i = 0; i < chartData.length; i++) {
pieData1.push({
...chartData[i],
itemStyle: {
borderRadius: 100,
shadowColor: '#2a2a34',
shadowBlur: 5,
shadowOffsetY: 0,
shadowOffsetX: 0,
borderColor: '#2a2a34',
borderWidth: 2,
},
});
pieData1.push(gapData);
pieData2.push({
...chartData[i],
itemStyle: {
borderRadius: 10,
color: colorList[i],
opacity: 0.1,
shadowColor: '#000',
shadowBlur: 1,
shadowOffsetY: 5,
shadowOffsetX: 0,
},
});
pieData2.push(gapData);
}
option = {
backgroundColor: {
image: bgPatternImg,
repeat: 'repeat',
},
title: [{
text: '75.0%',
x: '50%',
y: '43%',
textAlign: 'center',
textStyle: {
fontSize: '40',
fontWeight: '500',
color: '#98b5d2',
textAlign: 'center',
textShadowColor: '#000',
textShadowBlur: '1',
textShadowOffsetX: 2,
textShadowOffsetY: 2,
},
}, {
text: 'DESIGN ELEMENTS',
left: '50%',
top: '52%',
textAlign: 'center',
textStyle: {
fontSize: '18',
fontWeight: '400',
color: '#5c5a68',
textAlign: 'center',
textShadowColor: '#000',
textShadowBlur: '1',
textShadowOffsetX: 1,
textShadowOffsetY: 1,
},
}, ],
legend: {
left: '10%',
top: '35%',
align: 'left',
itemGap: 18,
itemWidth: 20,
itemHeight: 20,
shadowBlur: 10,
shadowOffsetY: 0,
shadowOffsetX: 0,
borderColor: '#2a2a34',
borderWidth: 2,
textStyle: {
color: '#D8DDE3',
rich: {
name: {
verticalAlign: 'right',
align: 'left',
fontSize: 18,
color: '#D8DDE3',
},
percent: {
padding: [0, 0, 0, 10],
color: '#D8DDE3',
fontSize: 18,
},
},
},
formatter: (name) => {
const item = chartData.find((i) => {
return i.name === name;
});
const p = ((item.value / sum) * 100).toFixed(0);
return '{name|' + name + '}' + '{percent|' + p + '}' + ' %';
},
},
color: colorList,
series: [
{
type: 'pie',
z: 3,
roundCap: true,
radius: ['44%', '51%'],
center: ['50%', '50%'],
label: {
show: false,
},
labelLine: {
show: false,
},
data: pieData1,
},
{
type: 'pie',
z: 2,
radius: ['40%', '55%'],
center: ['50%', '50%'],
label: {
show: false,
},
labelLine: {
show: false,
},
silent: true,
data: pieData2,
},
],
};