/**
*
* 作者: GhostCat
* 博客: https://gcat.cc
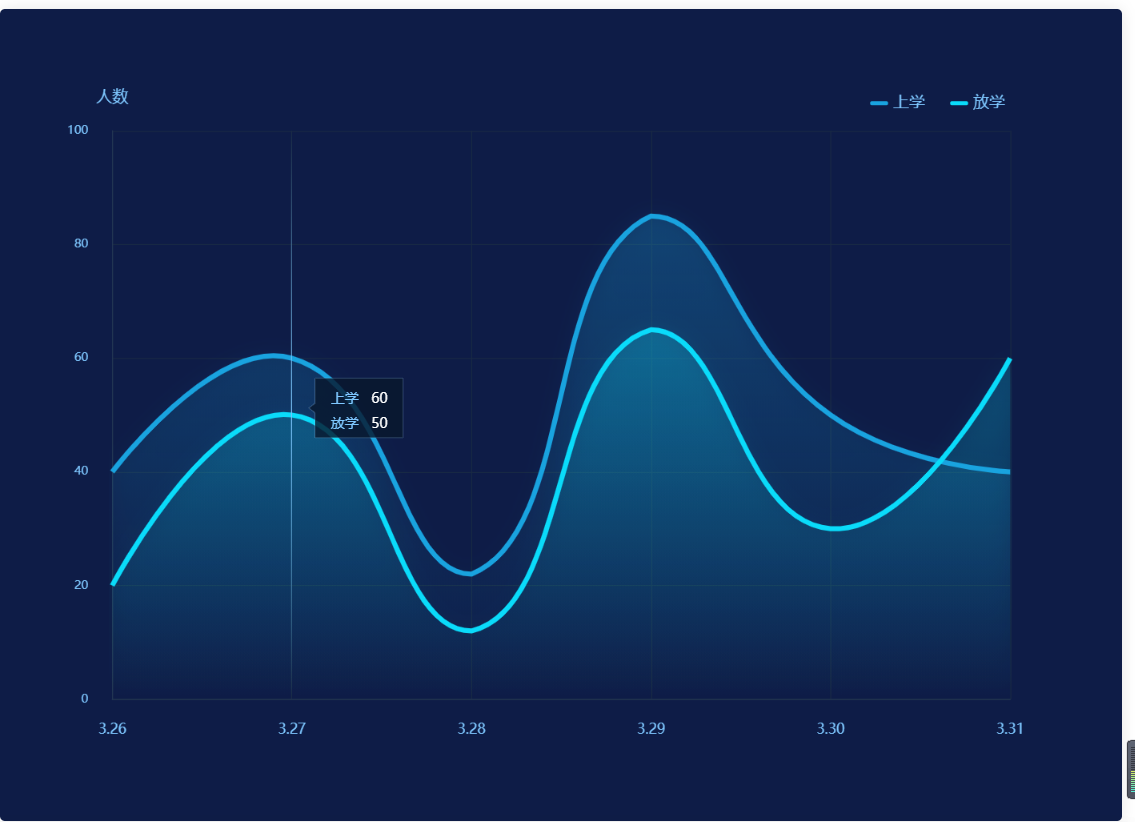
* 描述: 双折线图
*
*/
let xLabel = ['3.26', '3.27', '3.28', '3.29', '3.30', '3.31']
let goToSchool = ["40", "60", "22", "85", "50", "40"]
let goOutSchool = ["20", "50", "12", "65", "30", "60"]
option = {
backgroundColor: '#0e1c47',
tooltip: {
trigger: 'axis',
backgroundColor:'transparent',
axisPointer: {
lineStyle: {
color: {
type: 'linear',
x: 0,
y: 0,
x2: 0,
y2: 1,
colorStops: [{
offset: 0,
color: 'rgba(126,199,255,0)' // 0% 处的颜色
}, {
offset: 0.5,
color: 'rgba(126,199,255,1)' // 100% 处的颜色
}, {
offset: 1,
color: 'rgba(126,199,255,0)' // 100% 处的颜色
}],
global: false // 缺省为 false
}
},
},
formatter: (p) => {
let dom = `<div style="width: 79px;
height: 50px;;color:#fff;position: relative;">
<svg style="position: absolute;top: 50%;
left: 50%;
transform: translateX(-50%) translateY(-50%);" class="svg" xmlns="http://www.w3.org/2000/svg" width="100" height="71" viewBox="0 0 84 55">
<defs>
<style>
.cls-1 {
fill: #07172c;
fill-opacity: 0.8;
stroke: #a7d8ff;
stroke-linejoin: round;
stroke-opacity: 0.2;
stroke-width: 1px;
fill-rule: evenodd;
}
</style>
</defs>
<path id="矩形_419" data-name="矩形 419" class="cls-1" d="M266,595h74v50H266V624.046L261,620l5-3.984V595Z"
transform="translate(-258.5 -592.5)" />
</svg>
<div style="padding: 4px 8px 4px 14px;display: flex;
justify-content: center;
align-items: center;
flex-direction: column;position: relative;z-index: 1;">
<div style="margin-bottom: 4px;width:100%;display:${p[0]?'flex':'none'};justify-content:space-between;align-items:center;">
<span style="font-size:14px;color:#7ec7ff;">${p[0]?p[0].seriesName:''}</span>
<span style="font-size:14px;color:#fff;">${p[0]?p[0].data:''}</span>
</div>
<div style="width:100%;height:100%;display:${p[1]?'flex':'none'};justify-content:space-between;align-items:center;">
<span style="font-size:14px;color:#7ec7ff;">${p[1]?p[1].seriesName:''}</span>
<span style="font-size:14px;color:#fff;">${p[1]?p[1].data:''}</span>
</div>
</div>
</div>`
return dom
}
},
legend: {
align: "left",
right: '10%',
top:'10%',
type:'plain',
textStyle:{
color:'#7ec7ff',
fontSize:16
},
// icon:'rect',
itemGap:25,
itemWidth:18,
icon:'path://M0 2a2 2 0 0 1 2 -2h14a2 2 0 0 1 2 2v0a2 2 0 0 1 -2 2h-14a2 2 0 0 1 -2 -2z',
data: [
{
name: '上学'
},
{
name: '放学'
}
]
},
grid: {
top: '15%',
left: '10%',
right: '10%',
bottom: '15%',
// containLabel: true
},
xAxis: [{
type: 'category',
boundaryGap: false,
axisLine: { //坐标轴轴线相关设置。数学上的x轴
show: true,
lineStyle: {
color: '#233653'
},
},
axisLabel: { //坐标轴刻度标签的相关设置
textStyle: {
color: '#7ec7ff',
padding: 16,
fontSize: 14
},
formatter: function(data) {
return data
}
},
splitLine: {
show: true,
lineStyle: {
color: '#192a44'
},
},
axisTick: {
show: false,
},
data: xLabel
}],
yAxis: [{
name: '人数',
nameTextStyle: {
color: "#7ec7ff",
fontSize: 16,
padding: 10
},
min: 0,
splitLine: {
show: true,
lineStyle: {
color: '#192a44'
},
},
axisLine: {
show: true,
lineStyle: {
color: "#233653"
}
},
axisLabel: {
show: true,
textStyle: {
color: '#7ec7ff',
padding: 16
},
formatter: function(value) {
if (value === 0) {
return value
}
return value
}
},
axisTick: {
show: false,
},
}],
series: [{
name: '上学',
type: 'line',
symbol: 'circle', // 默认是空心圆(中间是白色的),改成实心圆
showAllSymbol: true,
symbolSize: 0,
smooth: true,
lineStyle: {
normal: {
width: 5,
color: "rgba(25,163,223,1)", // 线条颜色
},
borderColor: 'rgba(0,0,0,.4)',
},
itemStyle: {
color: "rgba(25,163,223,1)",
borderColor: "#646ace",
borderWidth: 2
},
tooltip: {
show: true
},
areaStyle: { //区域填充样式
normal: {
//线性渐变,前4个参数分别是x0,y0,x2,y2(范围0~1);相当于图形包围盒中的百分比。如果最后一个参数是‘true’,则该四个值是绝对像素位置。
color: new echarts.graphic.LinearGradient(0, 0, 0, 1, [{
offset: 0,
color: "rgba(25,163,223,.3)"
},
{
offset: 1,
color: "rgba(25,163,223, 0)"
}
], false),
shadowColor: 'rgba(25,163,223, 0.5)', //阴影颜色
shadowBlur: 20 //shadowBlur设图形阴影的模糊大小。配合shadowColor,shadowOffsetX/Y, 设置图形的阴影效果。
}
},
data: goToSchool
}, {
name: '放学',
type: 'line',
symbol: 'circle', // 默认是空心圆(中间是白色的),改成实心圆
showAllSymbol: true,
symbolSize: 0,
smooth: true,
lineStyle: {
normal: {
width: 5,
color: "rgba(10,219,250,1)", // 线条颜色
},
borderColor: 'rgba(0,0,0,.4)',
},
itemStyle: {
color: "rgba(10,219,250,1)",
borderColor: "#646ace",
borderWidth: 2
},
tooltip: {
show: true
},
areaStyle: { //区域填充样式
normal: {
//线性渐变,前4个参数分别是x0,y0,x2,y2(范围0~1);相当于图形包围盒中的百分比。如果最后一个参数是‘true’,则该四个值是绝对像素位置。
color: new echarts.graphic.LinearGradient(0, 0, 0, 1, [{
offset: 0,
color: "rgba(10,219,250,.3)"
},
{
offset: 1,
color: "rgba(10,219,250, 0)"
}
], false),
shadowColor: 'rgba(10,219,250, 0.5)', //阴影颜色
shadowBlur: 20 //shadowBlur设图形阴影的模糊大小。配合shadowColor,shadowOffsetX/Y, 设置图形的阴影效果。
}
},
data: goOutSchool
}]
};
let len = 0
setInterval(()=>{
if(len === xLabel.length){
len = 0
}
myChart.dispatchAction({
type: 'showTip',
seriesIndex: 0,
dataIndex: len,
})
len ++
}, 1000)