实时跟进用Vue3整合开发百度地图 和 echarts
https://yzjstudy.xyz
1.Vue3百度地图中文文档地址
https://map.heifahaizei.com/doc/begin/install.html
npm安装 由于百度地图与vue2兼容,要用 vue-baidu-map-3x
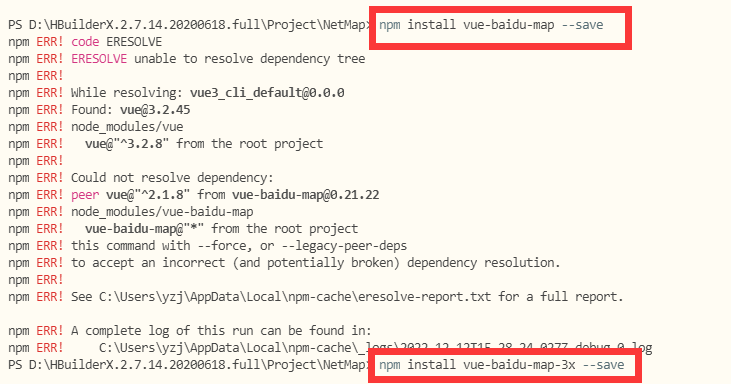
嘎嘎嘎然而这个根本没用到(bushi)
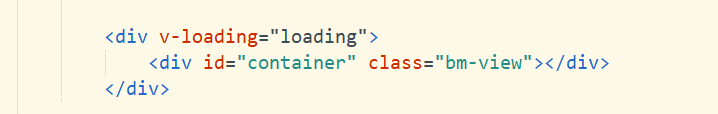
2.地图组件,用一个div包裹就行
简单的布局/切换功能
<div class="role">
        <div class="roleList">
            <el-breadcrumb separator-class="el-icon-arrow-right" class="breadcrumb">
                <el-breadcrumb-item :to="{ path: '/x' }">首页</el-breadcrumb-item>
                <!-- <el-breadcrumb-item>区域疫情防控</el-breadcrumb-item> -->
                <el-breadcrumb-item>区域核酸检测</el-breadcrumb-item>
                <!-- <el-breadcrumb-item>确诊地点&小区查询</el-breadcrumb-item> -->
                <el-breadcrumb-item>核酸监测机构&地点</el-breadcrumb-item>
            </el-breadcrumb>

            <div class="formContent">
                <el-form :inline="true" class="demo-form-inline">
                    <el-form-item label="地点">
                        <el-cascader size="large" :options="options" :props="defaultParams" collapse-tags
                            v-model="selectedOptions" placeholder="请选择要查询的区域" @change="handleChange">
                        </el-cascader>
                    </el-form-item>

                    <el-form-item>
                        <el-switch v-model="isShow"
                            style="margin-right: 20px;--el-switch-on-color: #13ce66; --el-switch-off-color: #5468ff"
                            inline-prompt active-text="普通地图" inactive-text="实景图" @change="changeMapType">
                        </el-switch>
                        <el-switch v-model="isLabel" inline-prompt active-text="显示标注" inactive-text="隐藏标注"
                            @change="changeLabel" style="margin-right: 20px;"></el-switch>
                        <el-switch v-model="isMarker" inline-prompt active-text="显示Marker" inactive-text="隐藏Marker"
                            @change="changeMarker"></el-switch>
                    </el-form-item>

                </el-form>
            </div>

            <div v-loading="loading">
                <div id="container" class="bm-view"></div>
            </div>


        </div>
    </div>
布局样式
.bm-view {
        margin-top: 0px;
        width: 100%;
        height: 550px;
        overflow: hidden;
    }


    .role {
        width: 100%;
        height: 100%;
        overflow: scroll;
    }

    .seek {
        width: 98%;
        height: auto;
        margin: 10px auto;
        border: 1px solid #e6e6e6;
        background-color: #fff;
    }

    .roleList {
        width: 98%;
        height: auto;
        border: 1px solid #e6e6e6;
        margin: 10px auto;
        background-color: #fff;
    }

    .formContent {
        width: 70%;
        height: 100%;
        margin: 0 auto;
        margin-top: 10px;
    }
效果如下
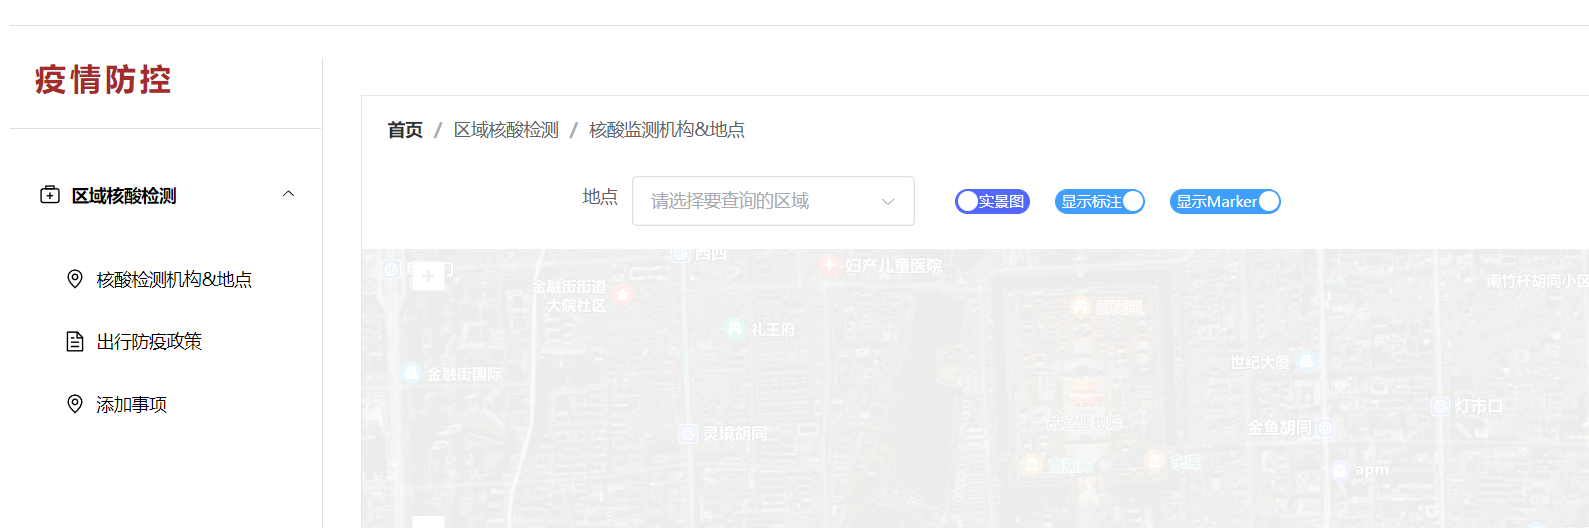
地图主要实现 el-cascader 选择省市数据,对省市数据进行解析,映射得到城市id,用于访问数据接口,(由于数据的特殊性,这种方法不太可取)
聚合数据接口,为数不多还能查疫情数据的接口,但是有两个也停止维护了,只能查核酸检测机构,查一次城市列表,把json复制下来,对着省市名称改json(过程枯燥,当时没有更好的办法)
注意 前端直接访问api会产生跨域问题,普通解决方式是在vite.config.js文件中设置跨域
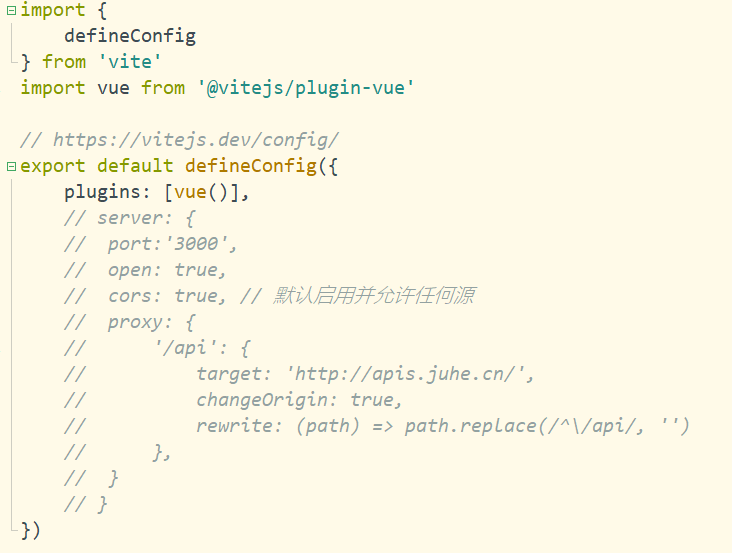
但是我的问题在于这个接口一直跨域不成功,后来改变思路可以通过项目的java,c#后台去访问接口,在把数据返回前端进行页面渲染

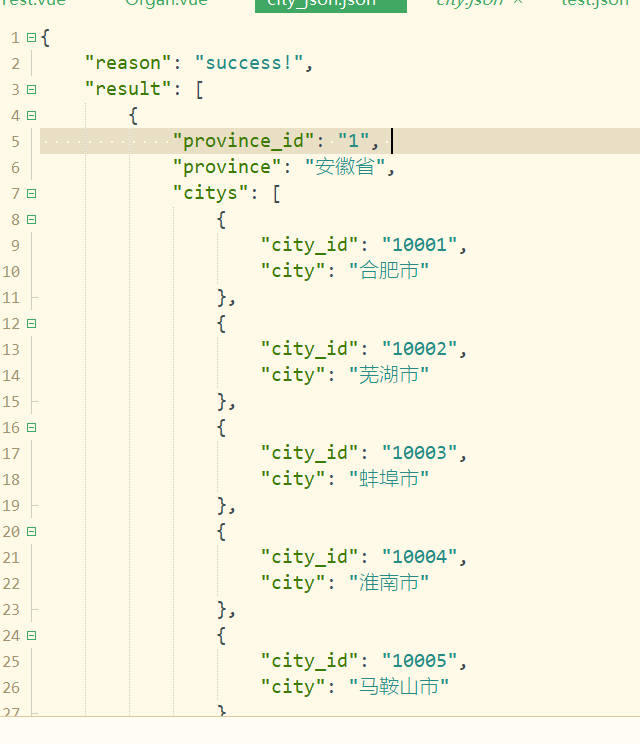
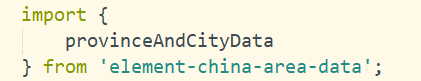
把json文件放到public目录/静态文件目录,一个坑,由于在vue封装过axios请求,这里用axios访问不到静态资源
axios.defaults.baseURL = "http://localhost:3000";     //把前面封装的与服务器配对的地址改过来,访问本地静态文件,下面做处理
                axios("/city.json", {}).then(res => {
                    for (var i = 0; i < res.data.result.length; i++) {
                        var x = res.data.result[i].citys
                        var list = {}
                        for (var j = 0; j < x.length; j++) {
                            var y = x[j].city;
                            list[y] = x[j].city_id;
                            var obj = {
                                labelList: [],
                                markerList: []
                            }
                            this.poMap[x[j].city_id] = obj      //把json数据解析出来存到 {} 里面,方便后面查省市的时候映射出id
                        }
                        this.cityMap[res.data.result[i].province] = list;

                    }
                    // console.log(this.cityMap)
                    // console.log(this.poMap)

                }).catch(error => {
                    console.log(error)
                })
initMap初始化地图
initMap() {
                var that = this;
                this.loading = true;
          //绑定div对象新建百度地图
                this.map = new BMapGL.Map('container');
                var point = new BMapGL.Point(116.404, 39.915);
                this.map.centerAndZoom(point, 15);
                this.map.addControl(new BMapGL.NavigationControl());
                this.map.enableScrollWheelZoom(true)
          //设置为实景图
                this.map.setMapType(BMAP_EARTH_MAP)
                //定位,问题在于用浏览器定位到百度地图上不准,坐标转换了半天也不准,暂时没啥好办法
                var geolocation = new BMapGL.Geolocation();
                // geolocation.enableSDKLocation();
                geolocation.getCurrentPosition(function(r) {
                    if (this.getStatus() == BMAP_STATUS_SUCCESS) {
                        var npoint = new BMapGL.Point(r.point.lng - 0.064255, r.point.lat + 0.000484);
                        that.myPoint = npoint;
                        // var mk = new BMapGL.Marker(r.point);
                        var mk = new BMapGL.Marker(npoint);
                        that.map.addOverlay(mk);
                        that.map.panTo(npoint);
                        // that.map.panTo(r.point);
                        that.map.centerAndZoom(npoint, 15);
                        // that.map.centerAndZoom(r.point, 18);

                        var myGeo = new BMapGL.Geocoder();
                        // 根据坐标得到地址描述
                        myGeo.getLocation(that.myPoint, function(result) {
                            if (result){
                                that.myAddress = result.address;
                                var label = new BMapGL.Label("您的位置:" + that.myAddress, { // 创建文本标注
                                    position: npoint,
                                    offset: new BMapGL.Size(5, 5)
                                });
                                that.map.addOverlay(label); // 将标注添加到地图中
                                label.setStyle({ // 设置label的样式
                                    color: '#000',
                                    fontSize: '13px',
                                    padding: '10px',
                                    border: '1px solid #1E90FF'
                                })
                            }

                            that.loading = false;
                        });

                    } else {
                        alert('failed' + this.getStatus());
                    }
                });
监听el-ca...的change事件handlechange
handleChange(value) {
                this.labelList = []
                this.markerList = []
                if (value.length === 0) {
                    this.map.clearOverlays();
                    return;
                }
                this.loading = true;
                var that = this;
                console.log(value)
                for (var i = 0; i < value.length; i++) {
                    var x = value[i];
                    // console.log(x)
                    //x[0]是省份
                    if (x[0] === undefined) {
                        alert("该省份无数据")
                    } else {
                        //x[1]是市
                        if (x[1] !== undefined) {
                            //得到某个省份的市区map
                            var y = that.cityMap[x[0]]
                            //反射这个市的id
                            var id = y[x[1]];
                            //判断重复绘制
                            if (that.poMap[id].markerList.length === 0 && that.poMap[id].labelList.length === 0) {
                                axios.defaults.baseURL = "https://localhost:5001";
                                getData("/Cors/GetOrgan", {
                                    "id": id
                                }).then(res => {
                                    if (res.status === 200) {
                                        var list = res.data.result.data
                                        var points = []
                                        for (var j = 0; j < list.length; j++) {
                                            var myGeo = new BMapGL.Geocoder();

                                            // 将地址解析结果显示在地图上,并调整地图视野,(地名转点)
                                            myGeo.getPoint(list[j].address, function(point) {
                                                points.push(point);
                                            }, list[j].city)
                                        }

                                        var labels = []
                                        var markers = []
                        //等待解析结果,不设延时获取不到值
                                        setTimeout(function() {
                                            console.log("赋值")
                                            for (var k = 0; k < points.length; k++) {
                                                that.map.centerAndZoom(points[k], 12);
                                                var marker = new BMapGL.Marker(points[k], {
                                                    title: list[k].name
                                                });
                              //给每个marker增加监听事件,点击marker绘制与自身定位的路线
                                                marker.addEventListener('click', e => {
                                                    var end = new BMapGL.Point(e.target
                                                        .getPosition().lng, e.target
                                                        .getPosition().lat);
                                                    that.searchRoute(that.myPoint, end);
                                                });
                                                // that.map.addOverlay(marker);
                                                markers.push(marker)
                                                that.markerList.push(marker)

                                                var label = new BMapGL.Label(list[k].name, { // 创建文本标注
                                                    position: points[k],
                                                    offset: new BMapGL.Size(10, 10)
                                                });
                                                that.labelList.push(label);
                                                labels.push(label)
                                                // that.map.addOverlay(label); // 将标注添加到地图中
                                                label.setStyle({ // 设置label的样式
                                                    color: '#000',
                                                    fontSize: '13px',
                                                    border: '1px solid #1E90FF'
                                                })

                                            }
                                            var obj = {
                                                labelList: [],
                                                markerList: []
                                            }
                                            obj.labelList = labels
                                            obj.markerList = markers
                                            that.poMap[id] = obj;
                                        }, 2500)
                                    } else {
                                        that.loading = false;
                                    }
                                })
                            } else {
                                for (var t = 0; t < that.poMap[id].labelList.length; t++) {
                                    that.labelList.push(that.poMap[id].labelList[t])
                                }
                                for (var t = 0; t < that.poMap[id].markerList.length; t++) {
                                    that.markerList.push(that.poMap[id].markerList[t])
                                }
                            }
                        }

                    }

                }
                that.isLabel = true;
                that.isMarker = true;
                setTimeout(function() {
                    console.log("输出")
                    that.changeLabel();
                    that.changeMarker();
                    that.loading = false;
                }, 5000)
            },
路线绘制
searchRoute(start, end) {
                var midLng = (start.lng + end.lng) / 2;
                var midLat = (start.lat + end.lat) / 2;
                this.map.centerAndZoom(new BMapGL.Point(midLng, midLat), 6);
                var endAddress = "";
                var myGeo = new BMapGL.Geocoder();
                myGeo.getLocation(end, function(result) {
                    if (result)
                        endAddress = result.address;
                });


                var output = "从" + this.myAddress + "到" + endAddress + "驾车需要";
                var searchComplete = function(results) {
                    if (transit.getStatus() != BMAP_STATUS_SUCCESS) {
                        return;
                    }
                    var plan = results.getPlan(0);
                    output += plan.getDuration(true) + "\n"; //获取时间
                    output += "总路程为:";
                    output += plan.getDistance(true) + "\n"; //获取距离
                }
                var transit = new BMapGL.DrivingRoute(this.map, {
                    renderOptions: {
                        map: this.map
                    },
                    onSearchComplete: searchComplete,
                    onPolylinesSet: function() {
                        setTimeout(function() {
                            ElMessage({
                                type:'success',
                                duration:3000,
                                message:output
                            })
                        }, "1000");
                    }
                });
                transit.search(start, end);
            },
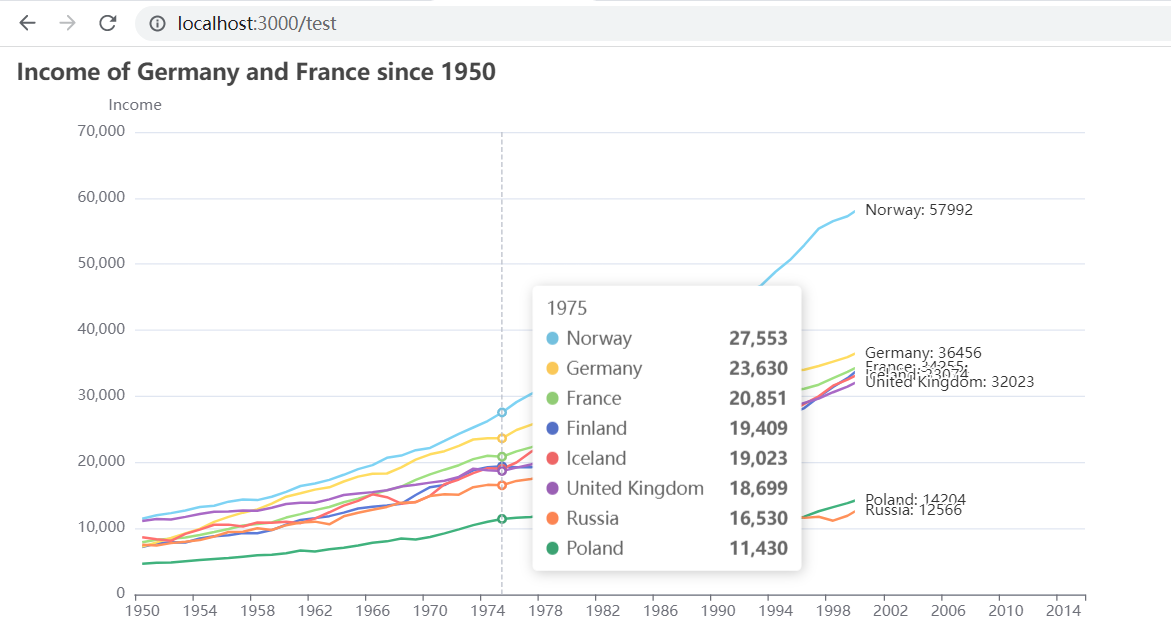
echarts,拿官网上的样例做测试,结合到vue2/vue3项目中时,要注意
 var chartDom = document.getElementById("mainX");
 var myChart = echarts.init(chartDom);
设置普通变量,不要用ref或是data() return ,不然会导致图表中的tooltip无法显示,因为数据未匹配成功
![]()

参考:http://www.hgnet.tech/view/162.html
import * as echarts from "echarts";
    import axios from "axios";
    import {
        getData
    } from '../api/index.js';
    export default {
        data() {
            return {
                // chartDom: "",
                // myChart: "",
                option: "",
                countries: [
                    'Finland',
                    'France',
                    'Germany',
                    'Iceland',
                    'Norway',
                    'Poland',
                    'Russia',
                    'United Kingdom'
                ],
                datasetWithFilters: [],
                seriesList: [],
            }
        },
        mounted() {
            this.$nextTick(() => {

                this.initChart();
            });
        },
        methods: {
            initChart() {
                // getData('/Cors/Work',{

                // }).then(res=>{
                //     console.log(res);
                // })

                // axios.defaults.baseURL = "http://localhost:3000";
                // axios("/test.json", {}).then(res => {

                // })
                // this.ROOT_PATH + '/data/asset/data/life-expectancy-table.json'
                var chartDom = document.getElementById("mainX");
                var myChart = echarts.init(chartDom);

                var that = this

                $.get('/test.json',
                    function(_rawData) {
                        that.run(_rawData);
                        myChart.setOption(that.option);
                    }
                );


            },
            run(_rawData) {
                var that = this;
                echarts.util.each(this.countries, function(country) {
                    var datasetId = 'dataset_' + country;
                    console.log(country)
                    that.datasetWithFilters.push({
                        id: datasetId,
                        fromDatasetId: 'dataset_raw',
                        transform: {
                            type: 'filter',
                            config: {
                                and: [{
                                        dimension: 'Year',
                                        gte: 1950
                                    },
                                    {
                                        dimension: 'Country',
                                        '=': country
                                    }
                                ]
                            }
                        }
                    });
                    that.seriesList.push({
                        type: 'line',
                        datasetId: datasetId,
                        showSymbol: false,
                        name: country,
                        endLabel: {
                            show: true,
                            formatter: function(params) {
                                return params.value[3] + ': ' + params.value[0];
                            }
                        },
                        labelLayout: {
                            moveOverlap: 'shiftY'
                        },
                        emphasis: {
                            focus: 'series'
                        },
                        encode: {
                            x: 'Year',
                            y: 'Income',
                            label: ['Country', 'Income'],
                            itemName: 'Year',
                            tooltip: ['Income']
                        }
                    });
                });
                this.option = {
                    animationDuration: 10000,
                    dataset: [{
                            id: 'dataset_raw',
                            source: _rawData
                        },
                        ...that.datasetWithFilters
                    ],
                    title: {
                        text: 'Income of Germany and France since 1950'
                    },

            //这个坑
                    tooltip: {
                        order: 'valueDesc',
                        trigger: 'axis', //触发类型,'item'数据项图形触发,主要在散点图,饼图等无类目轴的图表中使用。 'axis'坐标轴触发,主要在柱状图,折线图等会使用类目轴的图表中使用。
                    },

                    xAxis: {
                        type: 'category',
                        nameLocation: 'middle'
                    },
                    yAxis: {
                        name: 'Income'
                    },
                    grid: {
                        right: 140
                    },
                    series: that.seriesList
                };

            }
        }
    }
效果,观察实例json文件的数据结果,将其更改成活数据就能实现自己想要的表格了

 浙公网安备 33010602011771号