python 16 用Python玩转数据练习笔记
eval() 函数,用来执行一个字符串表达式,并返回表达式的值。
score = eval(input("enter the score: "))
第三章 数据获取
抓取: requests库、第三方API抓取解析
解析: BeautifulSoup 库、re模块
BeautifulSoup 是一个可以从html或XML文件中提取数据的Python库。
re正则表达式模块进行各类正则表达式的处理。
抽取豆瓣图书某一页的短评文字输出并计算评分。
import requests
from bs4 import BeautifulSoup
import re

s=0
i=0
r = requests.get('http://book.douban.com/subject/10758624/comments')
soup = BeautifulSoup(r.text,'lxml')
pattern=soup.find_all('span','short')
for item in pattern:
    print(item.string)
pattern_s=re.compile('<span class="user-stars allstar(.*?) rating"')
p=re.findall(pattern_s,r.text)
for star in p:
    s+=int(star)
    i+=1
print(s/i)
缺失值处理--DataFrame
判断缺失值 df.isnull()
删除缺失行 df.dropna()
填充缺失行 df.fillna()
例:使用均值填充
data.fillna(method='ffill',inplace =True)
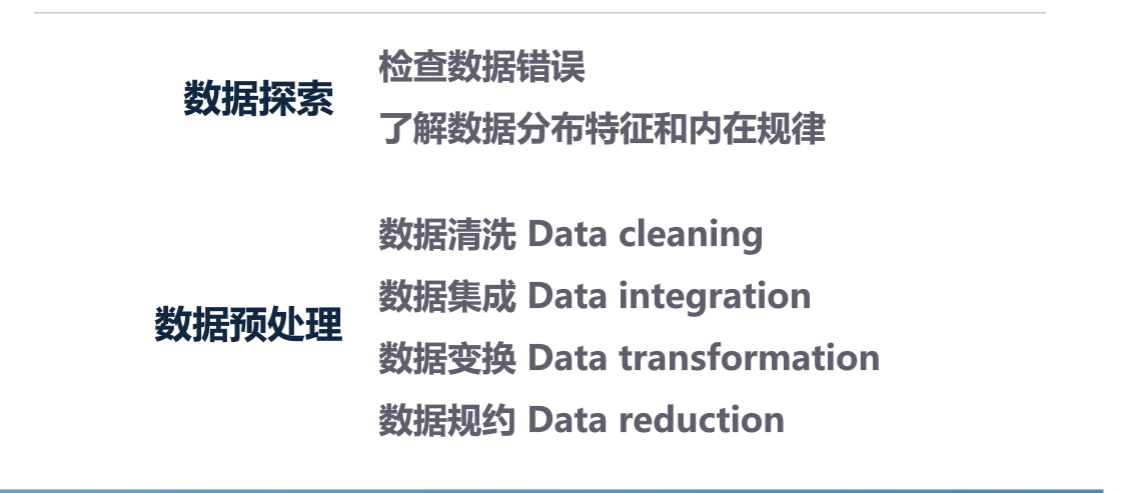
数据变化常见方法:规范化、连续属性离散化,特征二值化
规范化常用方法:最小-最大规范化: from sklearn import preprocessing
min_max_scaler =preprocessing.minmax_scale(df)
z-score规范化
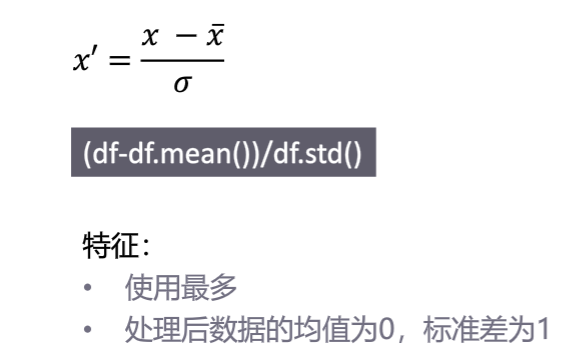
scaler = preprocessing.scale(df)
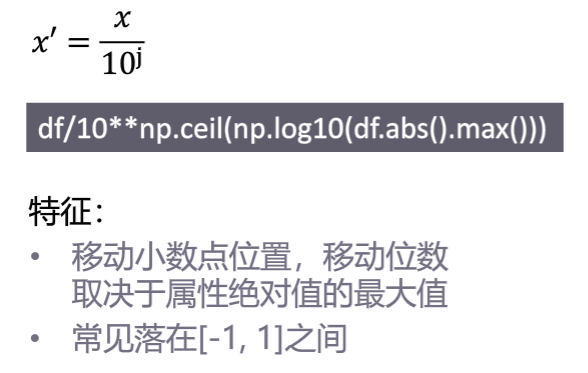
小数定标规范化
连续属性离散化
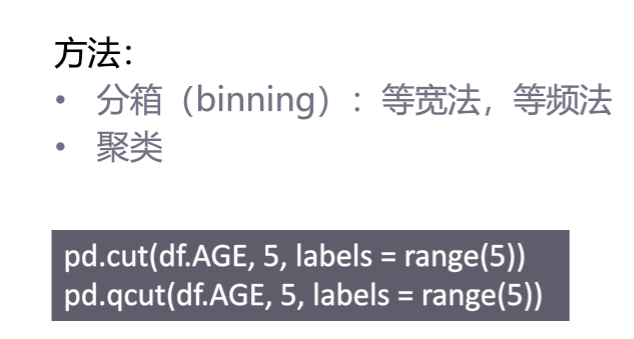
特征二值化 binarization
from sklearn.preprocessing import Binarizer
X=boston.target.reshape(-1,1)
Binarizer(threshold =20.0).fit_transform(X)
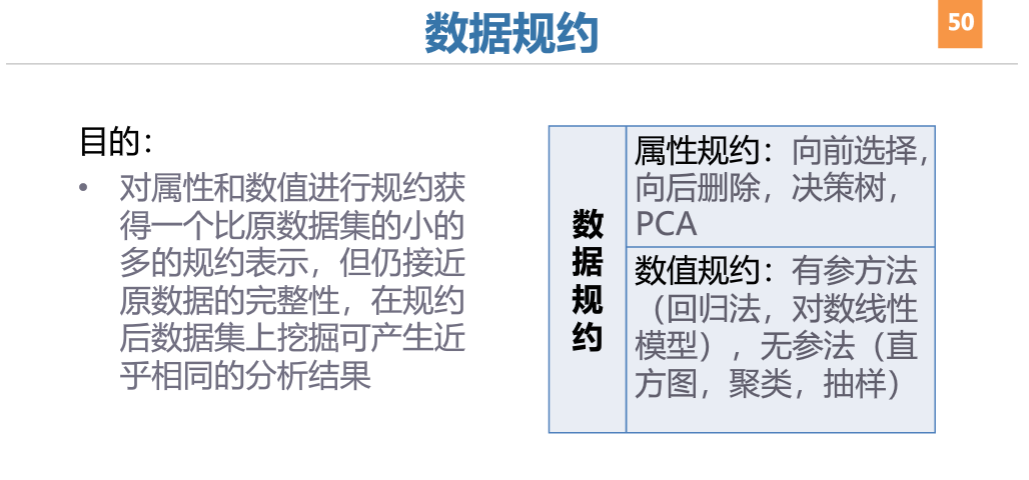
直方图
抽样
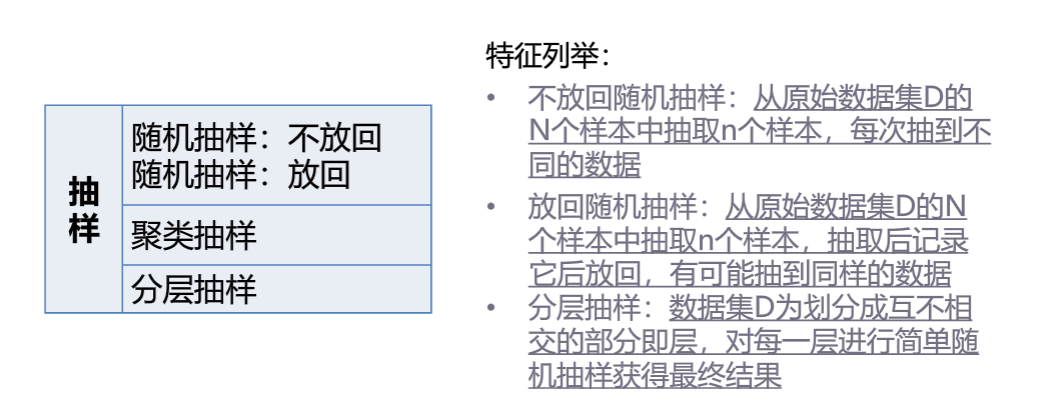
iris_df.sample(n-10,replace = True) #有放回抽样
分层抽样: iris_df[iris_df.target ==0].sample(frac=0.3)
基本数据特征分析方法
分布分析: 定量数据分析:直方图:plt.hist(iris_df.iloc[:,0],5,color='c')
正态分布检验:scipy.stats.normaltest(iris_df.iloc[:,0])
定性数据分析:iris_df.target.value_counts()
iris_df.target.value_counts().plot(kind='pie') #饼状图
统计量分析describe():集中趋势分析 mean()均值,median()中位数
离中趋势分析 std()标准差,quantile()四分位距
相关分析: 单个图
图矩阵
相关系数:person相关系数:约束条件:两个变量之间有线性关系
均是连续变量
变量均符合正态分布且二元分布也符合正态分布
两个变量独立
r>0正相关 r=0不相关 |r|=1完全线性相关


