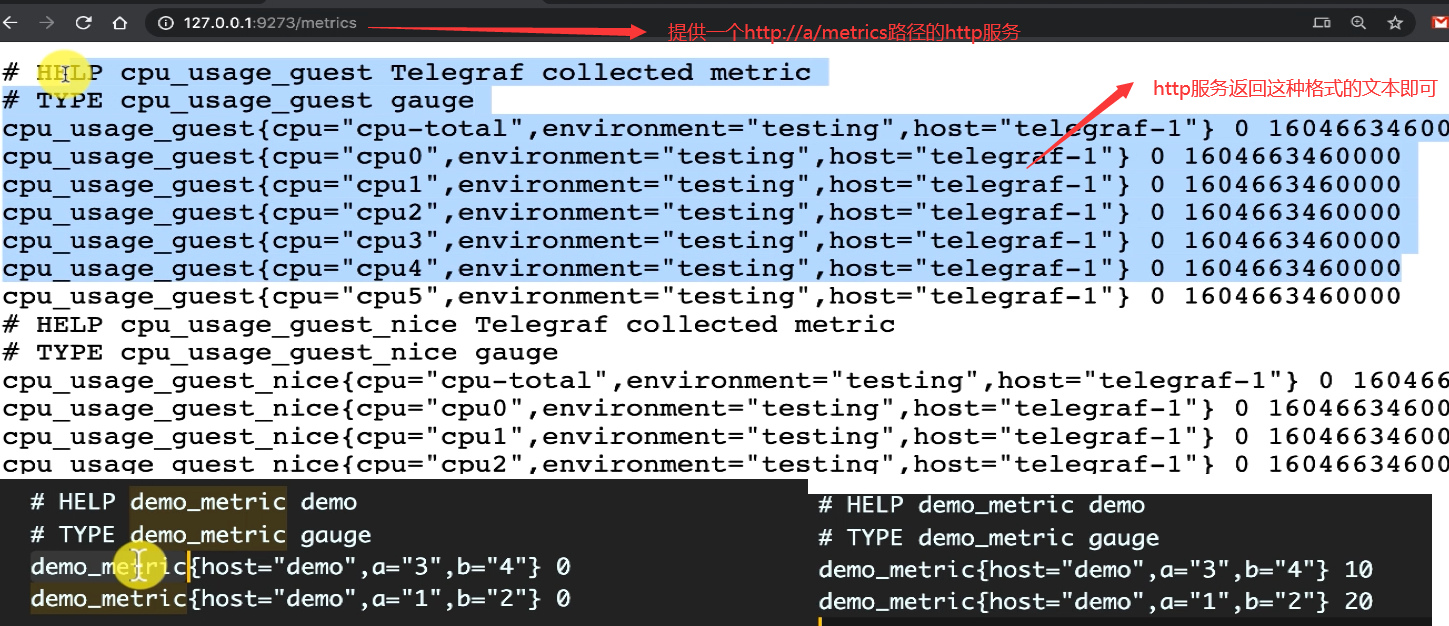
prometheus自建exporter
项目架构分析
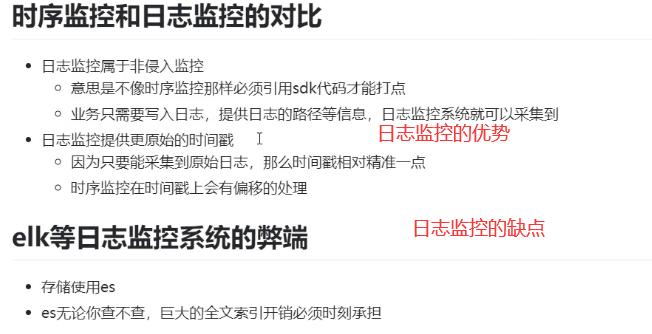
prometheus默认是时序监控系统
还有一种监控是日志监控系统,可以把日志监控系统的数据导入到prometheus中进行监控
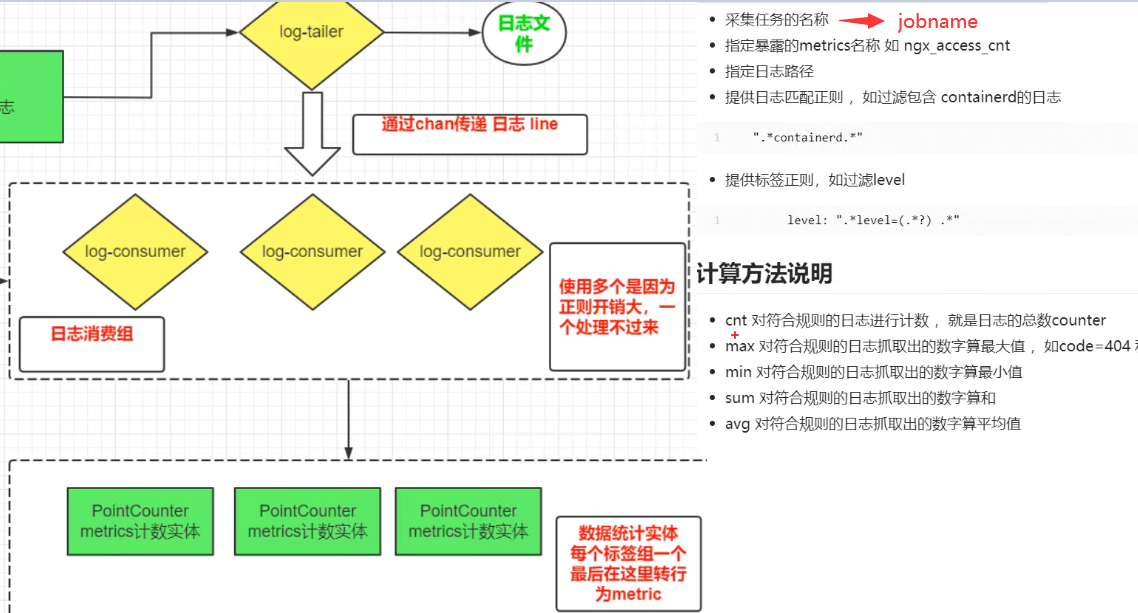
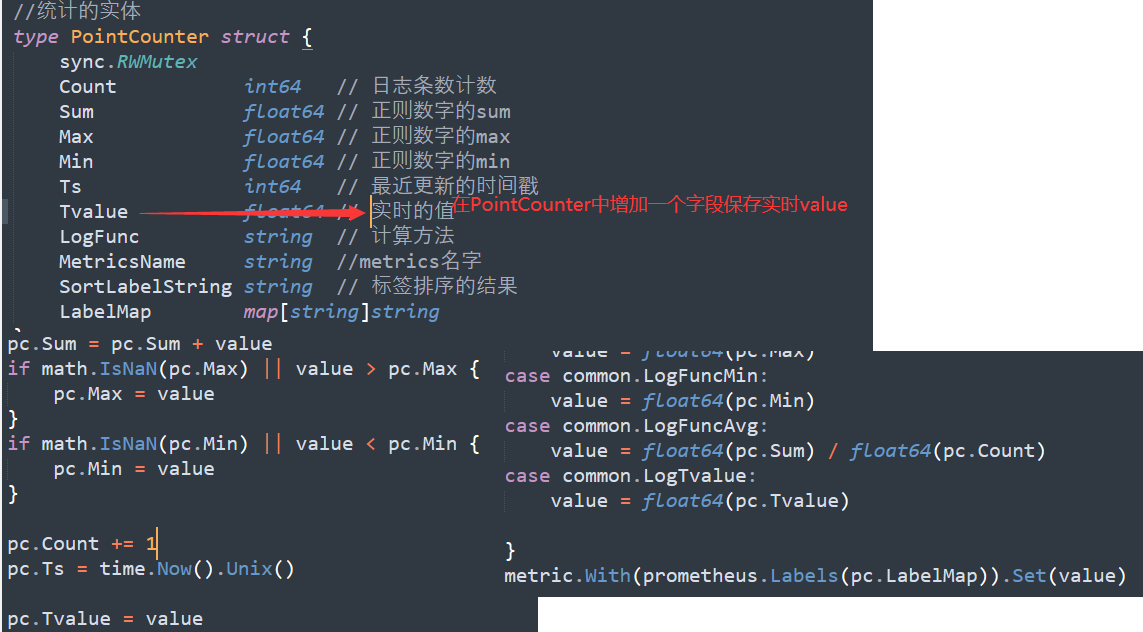
log2metrics
把日志里面的关键数据打成时序系统的一个metrics,然后把metrics推送给时序监控系统
项目搭建
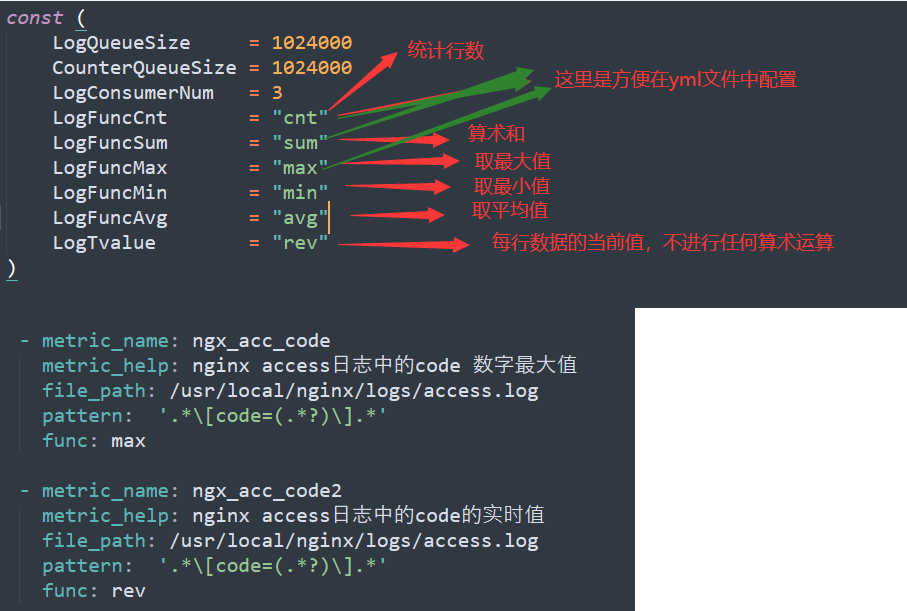
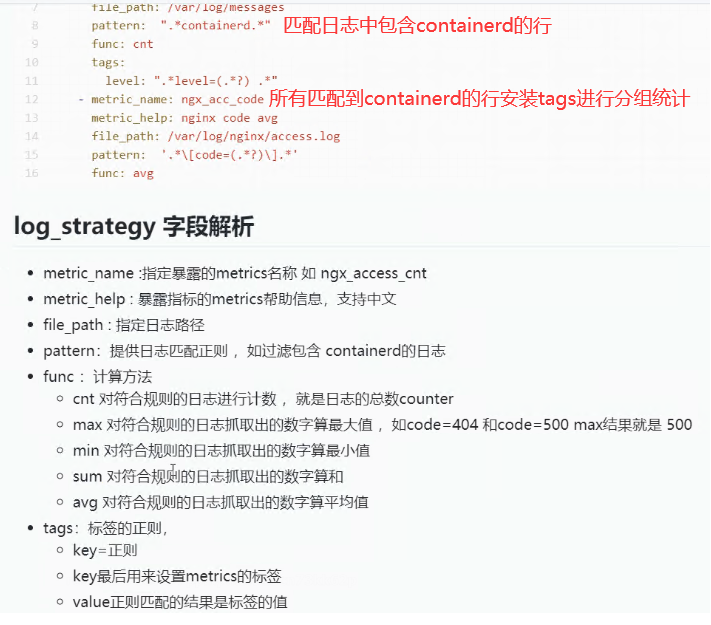
job的配置文件实例
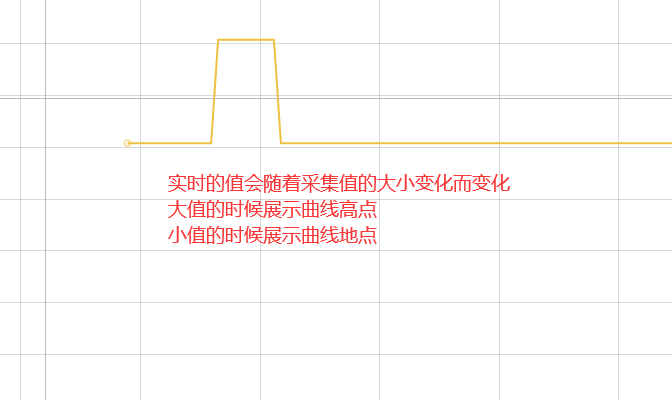
展示图表结果

python开发定制exporter


import prometheus_client as prom
import random
import time


if __name__ == '__main__':

   counter = prom.Counter('python_my_counter', 'This is my counter', ['method', 'endpoint'])
   gauge = prom.Gauge('python_my_gauge', 'This is my gauge', ['hostname', 'interface'])

   prom.start_http_server(8000)
   while True:
       counter.labels(method='get', endpoint='/').inc(random.random())
       counter.labels(method='post', endpoint='/submit').inc(random.random())
       gauge.labels(hostname='a.b.c', interface='eth0').set(random.random() * 15 - 5)
       time.sleep(1)
本文来自博客园,作者:不懂123,转载请注明原文链接:https://www.cnblogs.com/yxh168/p/15974633.html
