Prometheus监控 rate与irate的区别
对官网文档的解读
irate和rate都会用于计算某个指标在一定时间间隔内的变化速率。但是它们的计算方法有所不同:irate取的是在指定时间范围内的最近两个数据点来算速率,而rate会取指定时间范围内所有数据点,算出一组速率,然后取平均值作为结果。
所以官网文档说:irate适合快速变化的计数器(counter),而rate适合缓慢变化的计数器(counter)。
根据以上算法我们也可以理解,对于快速变化的计数器,如果使用rate,因为使用了平均值,很容易把峰值削平。除非我们把时间间隔设置得足够小,就能够减弱这种效应。
试验
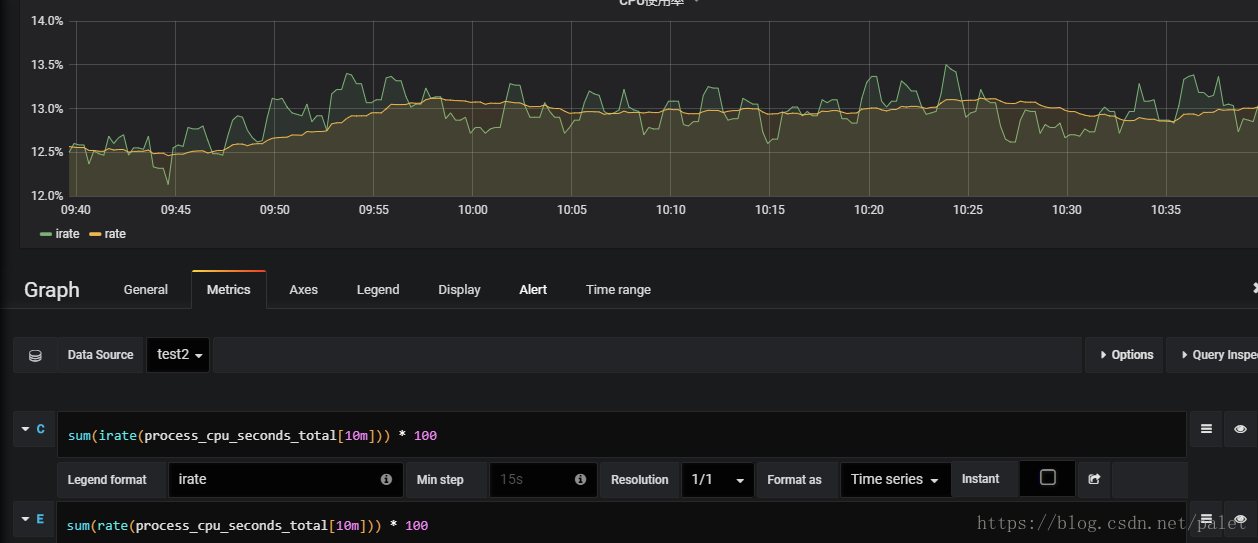
用grafana做了一个试验,创建一个测试的dashboard, 分别用 irate 和 rate 来监控CPU使用率指标,时间间隔分别用10m, 5m, 2m, 1m 。其中间隔为10分钟的表达式如下:
sum(irate(process_cpu_seconds_total[10m])) * 100
sum(rate(process_cpu_seconds_total[10m])) * 100
下图是间隔10分钟的结果,可以看到,irate的曲线比较曲折,而rate的曲线相对平缓:
下图是间隔5分钟的结果:
下图是间隔2分钟的结果,两个曲线重合了:
下图是间隔1分钟的结果,显示没有数据,应该是在这个时间间隔找不到一组数据来计算,所以没有数据:
附:官网文档
irate()
irate(v range-vector) calculates the per-second instant rate of increase of the time series in the range vector. This is based on the last two data points. Breaks in monotonicity (such as counter resets due to target restarts) are automatically adjusted for.
The following example expression returns the per-second rate of HTTP requests looking up to 5 minutes back for the two most recent data points, per time series in the range vector:
irate(http_requests_total{job="api-server"}[5m])
irate should only be used when graphing volatile, fast-moving counters. Use rate for alerts and slow-moving counters, as brief changes in the rate can reset the FOR clause and graphs consisting entirely of rare spikes are hard to read.
Note that when combining irate() with an aggregation operator (e.g. sum()) or a function aggregating over time (any function ending in _over_time), always take a irate() first, then aggregate. Otherwise irate() cannot detect counter resets when your target restarts.
rate()
rate(v range-vector) calculates the per-second average rate of increase of the time series in the range vector. Breaks in monotonicity (such as counter resets due to target restarts) are automatically adjusted for. Also, the calculation extrapolates to the ends of the time range, allowing for missed scrapes or imperfect alignment of scrape cycles with the range's time period.
The following example expression returns the per-second rate of HTTP requests as measured over the last 5 minutes, per time series in the range vector:
rate(http_requests_total{job="api-server"}[5m])
rate should only be used with counters. It is best suited for alerting, and for graphing of slow-moving counters.
Note that when combining rate() with an aggregation operator (e.g. sum()) or a function aggregating over time (any function ending in _over_time), always take a rate() first, then aggregate. Otherwise rate() cannot detect counter resets when your target restarts.
---------------------
作者:东东~
来源:CSDN
原文:https://blog.csdn.net/palet/article/details/82763695
版权声明:本文为博主原创文章,转载请附上博文链接!


 浙公网安备 33010602011771号