


Prometheus 部署
Prometheus 介绍
Prometheus(普罗米修斯)是一个最初在SoundCloud上构建的监控系统。自2012年成为社区开源项目,拥有非常活跃的开发人员和用户社区。为强调开源及独立维护,Prometheus于2016年加入云原生云计算基金会(CNCF),成为继Kubernetes之后的第二个托管项目。
网址:
https://prometheus.io
https://github.com/prometheus
Prometheus 组件与架构
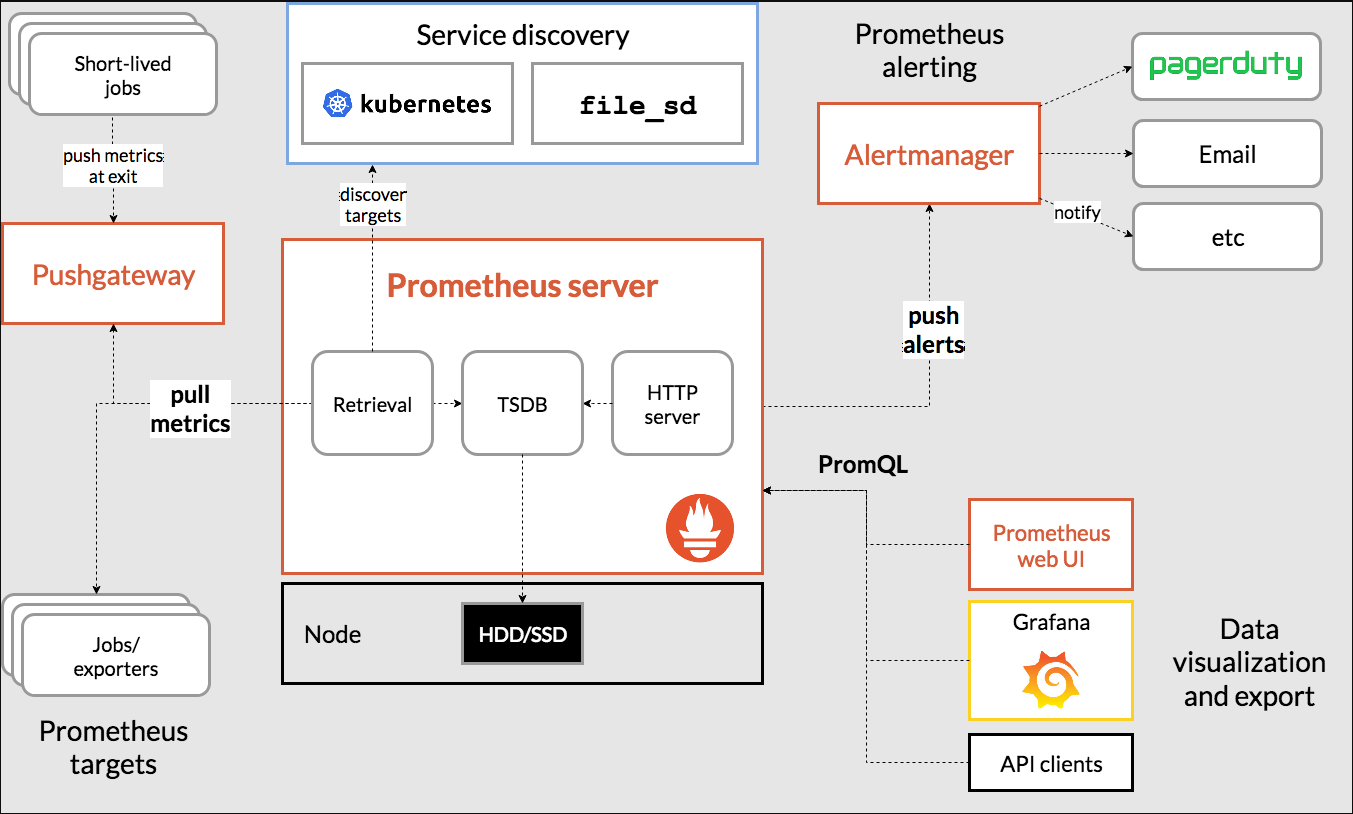
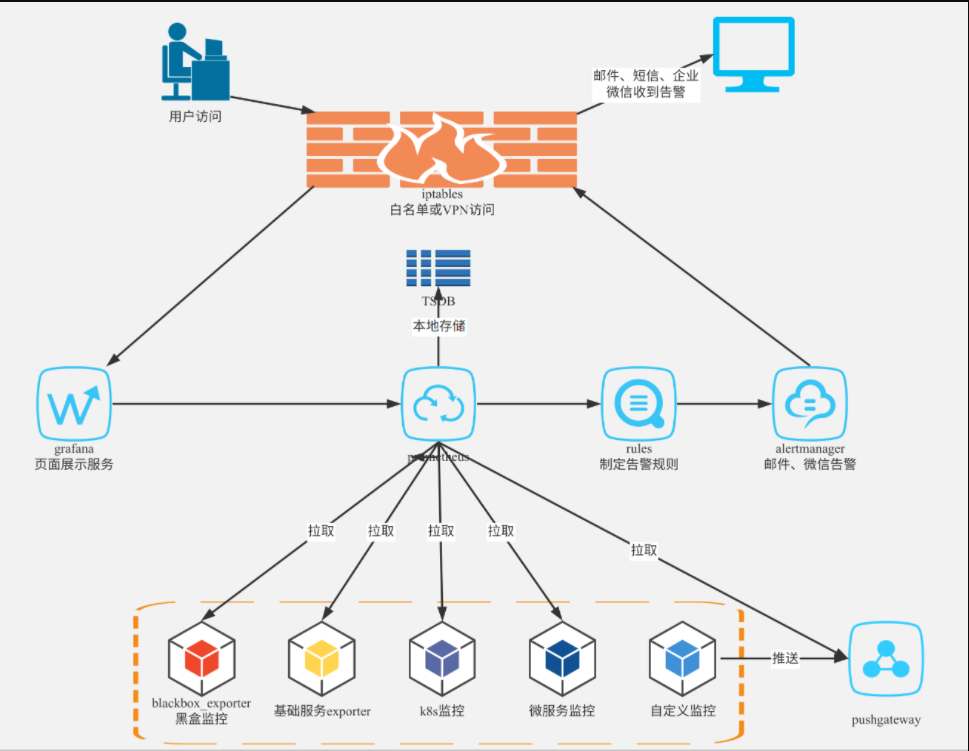
上面是官方给的架构图,不是很直观,下面给出一个架构的具体应用
四大组件
Prometheus Server : 根据配置完成数据采集,数据存储,根据告警规则产生告警并发送给Alertmanager,提供PromQL查询语言的支持。
Push Gateway : 为应对部分push场景提供的插件,这部分监控数据先推送到 Push Gateway 上,然后再由 Prometheus Server端拉取 。用于存在时间较短,可能在 Prometheus 来拉取之前就消失了的 jobs (若 Prometheus Server 采集间隔期间,Push Gateway 上的数据没有变化, Prometheus Server 将采集到2次相同的数据,仅时间戳不同)
XXX Exporters:Exporters(探针) 是Prometheus的一类数据采集组件的总称。它负责从目标处搜集数据,并将其转化为Prometheus支持的格式。它并不向中央服务器发送数据,而是等待中央服务器主动前来抓取。
Alertmanager: Prometheus server 主要负责根据基于PromQL的告警规则分析数据,如果满足PromQL定义的规则,则会产生一条告警,并发送告警信息到Alertmanager,Alertmanager则是根据配置处理告警信息并发送。常见的接收方式有:电子邮件,webhook,微信 等。Alertmanager三种处理告警信息的方式:分组,抑制,静默
Prometheus 特点:
•多维数据模型:由度量名称和键值对标识的时间序列数据
•PromQL:一种灵活的查询语言,可以利用多维数据完成复杂的查询
•不依赖分布式存储,单个服务器节点可直接工作
•基于HTTP的pull方式采集时间序列数据
•推送时间序列数据通过PushGateway组件支持
•通过服务发现或静态配置发现目标
•多种图形模式及仪表盘支持(grafana)
Prometheus 部署
•二进制部署
https://prometheus.io/docs/prometheus/latest/getting_started/
cd /opt/monitor && wget https://github.com/prometheus/prometheus/releases/download/v2.28.1/prometheus-2.28.1.linux-amd64.tar.gz
•Docker部署
https://prometheus.io/docs/prometheus/latest/installation/
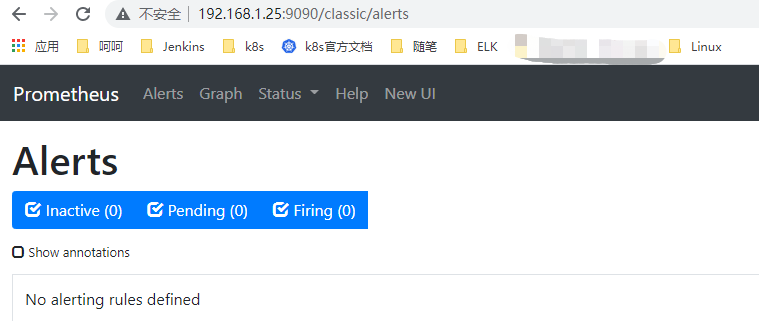
访问地址:http://IP:9090
./premetheus -h 命令行常用参数:
•--config.file="prometheus.yml" # 指定配置文件
•--web.listen-address="0.0.0.0:9090" # 监听地址和端口
•--log.level=info # 日志级别
•--alertmanager.timeout=10s # 与报警组件的超时时间
•--storage.tsdb.path="data/"# 数据目录
•--storage.tsdb.retention.time=15d# 数据保存时间,默认15天
配置为系统服务管理:
# vi /usr/lib/systemd/system/prometheus.service
[Unit]
Description=prometheus
[Service]
ExecStart=/opt/monitor/prometheus/prometheus --config.file=/opt/monitor/prometheus/prometheus.yml
ExecReload=/bin/kill -HUP $MAINPID
KillMode=process
Restart=on-failure
[Install]
WantedBy=multi-user.target
# systemctl daemon-reload
# systemctl start prometheus
# systemctl enable prometheus
Prometheus 配置文件
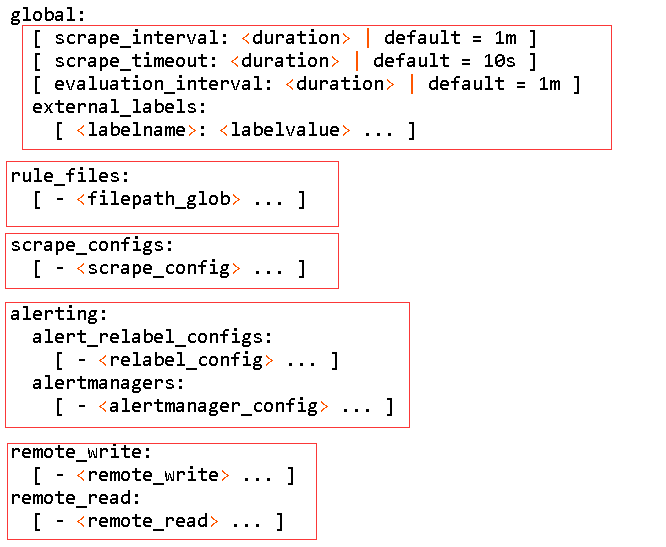
•global:全局配置
scrape_interval: 15s # 采集数据时间间隔
evaluation_interval: 15s # 评估告警规则时间间隔,默认1分钟
scrape_timeout:5s # 采集数据超时时间,默认10秒
•rule_files:告警规则
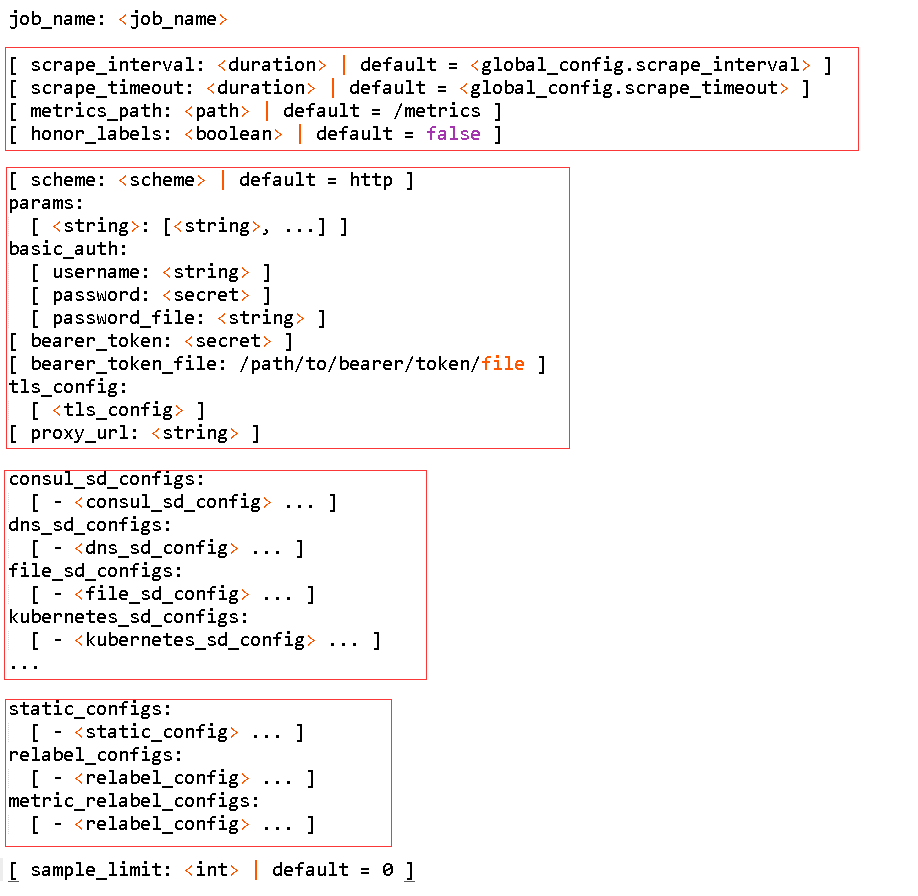
•scrape_configs:配置被监控端,称为target,每个target用job_name分组管理,又分为静态配置和服务发现
•alerting:告警配置
•remote_write/remote_read:从远程数据库读写
配置被监控端
目标(targets):被监控端
实例(Instances):每个被监控端称为实例
作业(Job):具有相同目标的实例集合称为作业
参考文档:https://prometheus.io/docs/prometheus/latest/configuration/configuration/
scrape_configs:
- job_name: 'prometheus'
static_configs:
- targets: ['localhost:9090']
- job_name: 'node'
static_configs:
- targets: ['192.168.1.10:9090']
监控指标数据模型
数据模型:
•Prometheus将所有数据存储为时间序列;
•具有相同度量名称以及标签属于同一个指标;
•每个时间序列都由度量标准名称和一组键值对(称为标签)唯一标识,通过标签查询指定指标。
指标格式:
<metric name>{<label name>=<label value>,...}


