postgresql 去重计数改写案例
最近帮忙在搞一个内网报表系统的项目,里面的逻辑比较复杂,很多视图套视图的语句。
最多的一个视图除了它本身以外,一层层嵌套了7个视图在里面,贼恶心。
SQL遇到性能问题只能每一层视图捋清对象关系来排查缓慢的原因,只看执行计划根本行不通,慢的语句根本跑不出结果。
这两天就遇到个很郁闷的问题,查询视图慢得要死,不过还是给哥解决了。
内网项目不能泄密,本案例SQL是我自己数据模拟的,大家看看就好。
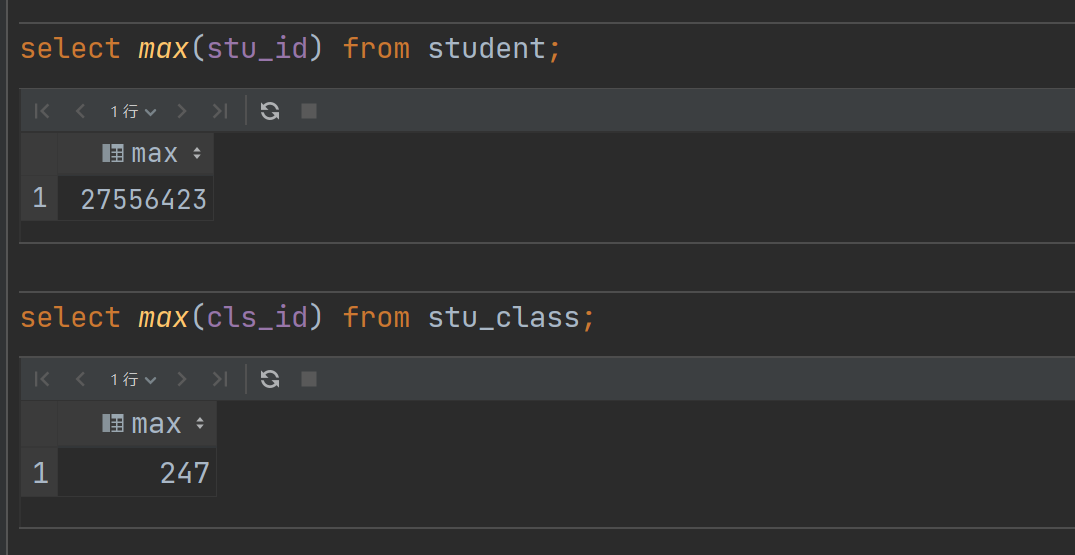
学生表 2千多万行数据、课程表 247 行数据,视图SQL如下:
-- create or replace view view_student
select
    sc.cls_id,
    count(distinct stu_date)
from student s
         left join stu_class sc on s.stu_classid = sc.cls_id
group by sc.cls_id order by 1;
其他报表SQL和这个视图关联统计根本出不来结果,我定位了好久才找到这个视图的问题,其实就是 count(distinct )的性能问题。
哥优化了这么多ORACLE的 SQL 在count(distinct ) 从来都不是瓶颈,今天就栽在PG这里了,先举个简单的例子。
explain analyze
select count(distinct stu_name) from student;

Aggregate  (cost=550713.05..550713.06 rows=1 width=8) (actual time=103819.440..103819.442 rows=1 loops=1)
  ->  Seq Scan on student  (cost=0.00..484627.44 rows=26434244 width=7) (actual time=0.015..1310.280 rows=26434261 loops=1)
Planning Time: 0.082 ms
Execution Time: 103819.479 ms
这种写法在 PG15 用103s,相同语句 ORACLE 仅用了12s (ORACLE这里学生表 3000W行数据,比PG的还更多)。
-- ORACLE
select  count(distinct stu_name) from student;

--------------------------------------------------------------------------------------------------------------------------------------------------
"| Id  | Operation            | Name     | Starts | E-Rows | A-Rows |   A-Time   | Buffers | Reads  | Writes |  OMem |  1Mem | Used-Mem | Used-Tmp|"
--------------------------------------------------------------------------------------------------------------------------------------------------
"|   0 | SELECT STATEMENT     |          |      1 |        |      1 |00:00:12.93 |     160K|  51801 |  51801 |       |       |          |         |"
"|   1 |  SORT AGGREGATE      |          |      1 |      1 |      1 |00:00:12.93 |     160K|  51801 |  51801 |       |       |          |         |"
"|   2 |   VIEW               | VW_DAG_0 |      1 |     26M|     26M|00:00:12.21 |     160K|  51801 |  51801 |       |       |          |         |"
"|   3 |    HASH GROUP BY     |          |      1 |     26M|     26M|00:00:10.74 |     160K|  51801 |  51801 |  1378M|    36M|   82M (1)|     418K|"
"|   4 |     TABLE ACCESS FULL| STUDENT  |      1 |     30M|     30M|00:00:01.40 |     160K|      0 |      0 |       |       |          |         |"
--------------------------------------------------------------------------------------------------------------------------------------------------
所以为什么刚开始我说在ORACLE上没遇到瓶颈,而在PG上就是瓶颈了,也是因为把 ORACLE 优化的思维带入到PG,搞得我排查了好久才找到是这里的性能问题。
换了一种等价的写法后,只需要20S就能跑出结果(PG15 优化器更聪明了,走了 HashAggregate,性能更好提升),但是明显这种算法也不是最好的。
explain analyze
select count(1) from (select distinct stu_name from student ) x ;

Aggregate  (cost=765972.04..765972.05 rows=1 width=8) (actual time=20448.106..20448.108 rows=1 loops=1)
  ->  HashAggregate  (cost=550713.05..646383.71 rows=9567066 width=7) (actual time=10505.357..19778.740 rows=23252100 loops=1)
        Group Key: student.stu_name
        Batches: 5  Memory Usage: 688177kB  Disk Usage: 474152kB
        ->  Seq Scan on student  (cost=0.00..484627.44 rows=26434244 width=7) (actual time=0.041..1350.891 rows=26434261 loops=1)
Planning Time: 0.145 ms
Execution Time: 20537.727 ms
这种语句最好的性能还是得走 IndexOnlyScan ,所以说人的脑袋才是最好的CBO(请允许我装一次逼 嘿嘿)
explain analyze
select
    /*+ IndexOnlyScan(student student_stu_name_index) */
    count(1)
from (select distinct stu_name from student) x;

Aggregate  (cost=882824.16..882824.17 rows=1 width=8) (actual time=5981.763..5981.765 rows=1 loops=1)
  ->  Unique  (cost=0.56..763235.83 rows=9567066 width=7) (actual time=0.024..5296.364 rows=23252100 loops=1)
        ->  Index Only Scan using student_stu_name_index on student  (cost=0.56..697150.22 rows=26434244 width=7) (actual time=0.023..2677.423 rows=26434261 loops=1)
              Heap Fetches: 0
Planning Time: 0.146 ms
Execution Time: 5981.794 ms
人为干预后,这条语句从原来 103 s 到最后 5.9 s 就能跑出结果,质的飞跃。
回到最开始视图的案例本身,先创建个索引:
create index idx_student_classid_stu_date on student(stu_classid,stu_date);
explain analyze
    -- create or replace view view_student as
select /*+ parallel(s 4 hard)  IndexOnlyScan(s idx_student_classid_stu_date) */
    sc.cls_id,
    count(distinct stu_date)
from student s
         left join stu_class sc on s.stu_classid = sc.cls_id
group by sc.cls_id order by 1;


GroupAggregate  (cost=3780941.85..3979201.27 rows=247 width=13) (actual time=11025.449..16154.259 rows=248 loops=1)
  Group Key: sc.cls_id
  ->  Sort  (cost=3780941.85..3847027.50 rows=26434260 width=9) (actual time=11007.958..13205.445 rows=26434261 loops=1)
        Sort Key: sc.cls_id
        Sort Method: external merge  Disk: 532480kB
        ->  Hash Left Join  (cost=9.56..70379.76 rows=26434260 width=9) (actual time=0.340..5058.768 rows=26434261 loops=1)
              Hash Cond: (s.stu_classid = sc.cls_id)
              ->  Gather  (cost=0.00..0.00 rows=26434260 width=8) (actual time=0.293..1290.132 rows=26434261 loops=1)
                    Workers Planned: 4
                    Workers Launched: 4
                    ->  Parallel Index Only Scan using idx_student_classid_stu_date on student s  (cost=0.00..0.00 rows=6608565 width=8) (actual time=0.108..654.199 rows=5286852 loops=5)
                          Heap Fetches: 0
              ->  Hash  (cost=6.47..6.47 rows=247 width=5) (actual time=0.042..0.043 rows=247 loops=1)
                    Buckets: 1024  Batches: 1  Memory Usage: 17kB
                    ->  Seq Scan on stu_class sc  (cost=0.00..6.47 rows=247 width=5) (actual time=0.007..0.022 rows=247 loops=1)
Planning Time: 0.260 ms
Execution Time: 16210.168 ms
这种聚合计算的SQL在报表系统里面适当添加并行对SQL也是一种很好的优化方式,加了4个并行,利用PG独特的并行索引扫描的特性,16s 就能跑出结果。
我们可以对上面的SQL进行等价改写:
explain analyze
-- create or replace view view_student as
select /*+
        parallel(s 4 hard)
        IndexOnlyScan(s idx_student_classid_stu_date)
         */
    sc.cls_id,
    count_stu_date
from (select stu_classid, count(distinct stu_date) count_stu_date
      from student s
      group by stu_classid) s
         inner join stu_class sc
                   on s.stu_classid = sc.cls_id;


Nested Loop  (cost=0.56..937074.01 rows=300 width=13) (actual time=30.679..3782.580 rows=247 loops=1)
  Join Filter: (s.stu_classid = sc.cls_id)
  Rows Removed by Join Filter: 30628
  ->  Seq Scan on stu_class sc  (cost=0.00..6.47 rows=247 width=5) (actual time=0.015..0.127 rows=247 loops=1)
  ->  Materialize  (cost=0.56..935961.26 rows=300 width=12) (actual time=0.062..15.303 rows=125 loops=247)
        ->  Subquery Scan on s  (cost=0.56..935959.76 rows=300 width=12) (actual time=15.235..3778.893 rows=248 loops=1)
              ->  GroupAggregate  (cost=0.56..935956.76 rows=300 width=12) (actual time=15.234..3778.730 rows=248 loops=1)
                    Group Key: s_1.stu_classid
                    ->  Index Only Scan using idx_student_classid_stu_date on student s_1  (cost=0.56..803782.46 rows=26434260 width=8) (actual time=0.020..1929.839 rows=21849736 loops=1)
                          Heap Fetches: 0
Planning Time: 0.185 ms
Execution Time: 3782.708 ms
等价改写完后相同并行下,该SQL只需要 3.7S 就能跑出结果,提升了13s 的时间,这种语句SQL数据量越大,效果越显著。
原来还没有优化之前跑了15分钟还没跑完,太蛋疼了。在生产环境下用这种方式改写优化以后,嵌套这个视图的SQL在 2分钟内就能返回结果。
洗洗睡了,明天还得继续搬砖,系统就快上线了 ,嘿嘿。
