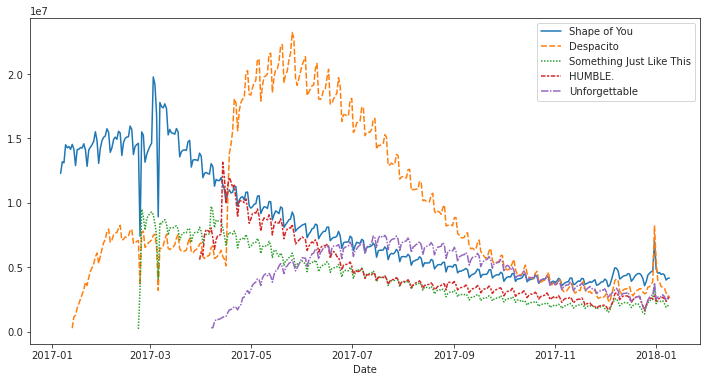
Kaggle_choose plot type and customer styles
配置文件
import pandas as pd
pd.plotting.register_matplotlib_converters()
import matplotlib.pyplot as plt
%matplotlib inline
import seaborn as sns
print("Setup Complete")
配置checking
import os
if not os.path.exists("../input/spotify.csv"):
    os.symlink("../input/data-for-datavis/spotify.csv", "../input/spotify.csv")
from learntools.core import binder
binder.bind(globals())
from learntools.data_viz_to_coder.ex6 import *
print("Setup Complete")
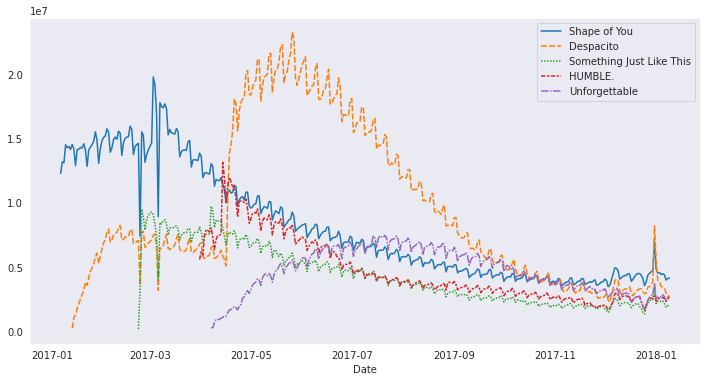
试用seaborn风格,‘dark’
# Change the style of the figure
sns.set_style("dark")

# Line chart
plt.figure(figsize=(12,6))
sns.lineplot(data=spotify_data)
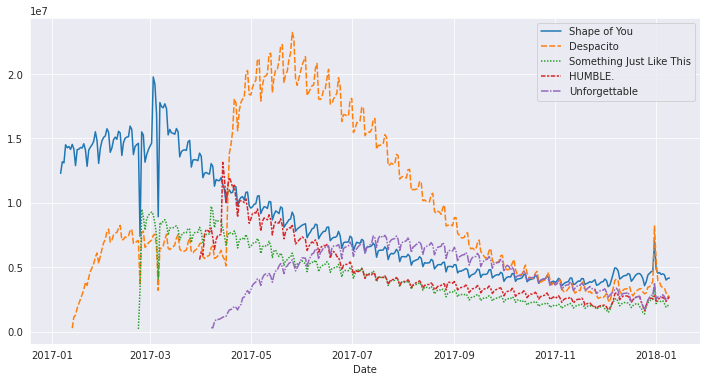
# Change the style of the figure
sns.set_style("darkgrid")

# Line chart
plt.figure(figsize=(12,6))
sns.lineplot(data=spotify_data)
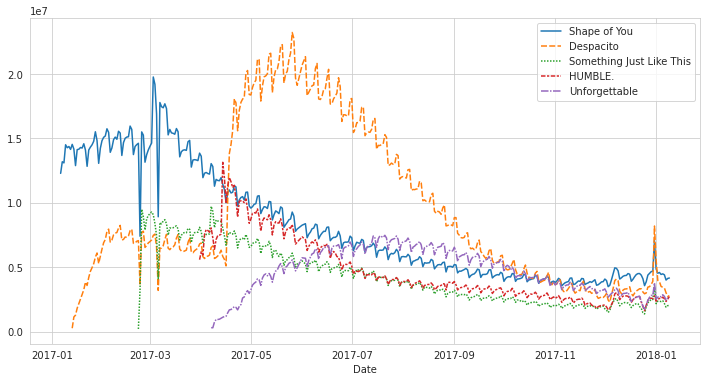
# Change the style of the figure
sns.set_style("whitegrid")

# Line chart
plt.figure(figsize=(12,6))
sns.lineplot(data=spotify_data)
# Change the style of the figure
sns.set_style("white")

# Line chart
plt.figure(figsize=(12,6))
sns.lineplot(data=spotify_data)
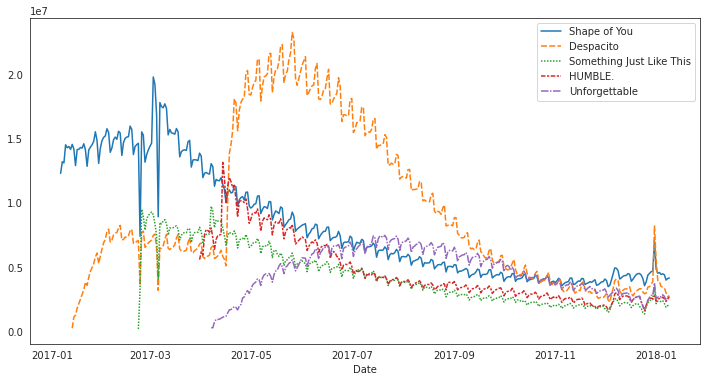
# Change the style of the figure
sns.set_style("ticks")

# Line chart
plt.figure(figsize=(12,6))
sns.lineplot(data=spotify_data)
