感知机算法python实现
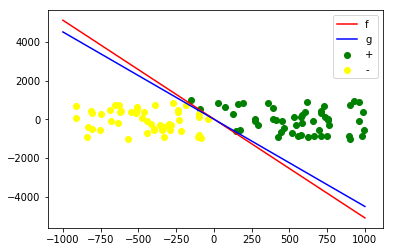
感知机算法(Perceptron Learning Algorithm)是一个很容易实现的算法。本文对PLA 算法做了一个简单的实验,在数据集线性可分时,可以证明PLA算法最终会收敛。
生成数据
首先随机生成数据点,然后随机生成目标函数 \(f\) 的权重 \(weights\)。
def generate_data(num_of_data, num_of_features):
    """Generate random data and weight vector.

    Keyword arguments:
    num_of_data -- The number of datapoints
    num_of_features -- The number of features

    Returns:
    X - The features of datapoints
    y - The labels of datapoints
    weights - Random weights
    """

    X = np.ones((num_of_data, num_of_features + 1))
    # generate random features
    X[:, 1:] = np.random.randint(-1000, 1000, (num_of_data, num_of_features))

    weights = np.random.randint(-1000, 1000, num_of_features + 1)
    weights = weights.reshape(-1, 1)
    print(weights.shape)
    y = np.dot(X, weights)
    y[y>=0] = 1
    y[y<0] = -1

    return X, y, weights
PLA 算法
PLA 算法的更新规则是:循环检测数据点是否能够被正确分类,如果分类错误,则: \(\boldsymbol{w}_{t+1}=\boldsymbol{w}_t+y_{t}\boldsymbol{x}(t)\),其中\((\boldsymbol{x}_t, y_{t})\)是被分类错误的数据点。
def sign(x):
    if x >= 0:
        return 1
    else:
        return -1


class PLA:
    """Perceptron Learning Algorithm"""
    def __init__(self):
        self.w = None

    def train(self, X, y, shuffle=False):
        num_of_data, num_of_features = X.shape

        # initialize weights
        w = np.zeros(num_of_features)

        cycle_index = [index for index in range(num_of_data)]

        # shuffle the order of datapoints


        i, num_of_iter = 0, 0

        while i < num_of_data:
            if shuffle:
                np.random.shuffle(cycle_index)

            if sign(np.sum(X[cycle_index[i]]*w)) != y[cycle_index[i]]:
                w += y[cycle_index[i]] * X[cycle_index[i]]
                i = 0
                num_of_iter += 1

            i += 1

        self.w = w

        return w, num_of_iter

    def test(self, x):
        return sign(np.dot(x, self.w))
实验操作
X, y, weights = generate_data(100, 2)
pla = PLA()
w, iternum = pla.train(X, y)
iternum

x_linspace = np.linspace(-1000, 1000, 10000)
y_real = [-weights[1]/weights[2]*x - weights[0]/weights[2] for x in x_linspace]
y_pred = [-w[1]/w[2]*x - w[0]/w[2] for x in x_linspace]

y = y.reshape(-1,)
plt.plot(x_linspace, y_real, 'r', label="f")
plt.plot(x_linspace, y_pred, 'b', label="g")
plt.scatter(X[y==1, 1], X[y==1, 2], color='green', label="+")
plt.scatter(X[y==-1, 1], X[y==-1, 2], color='yellow', label="-")
plt.legend()


