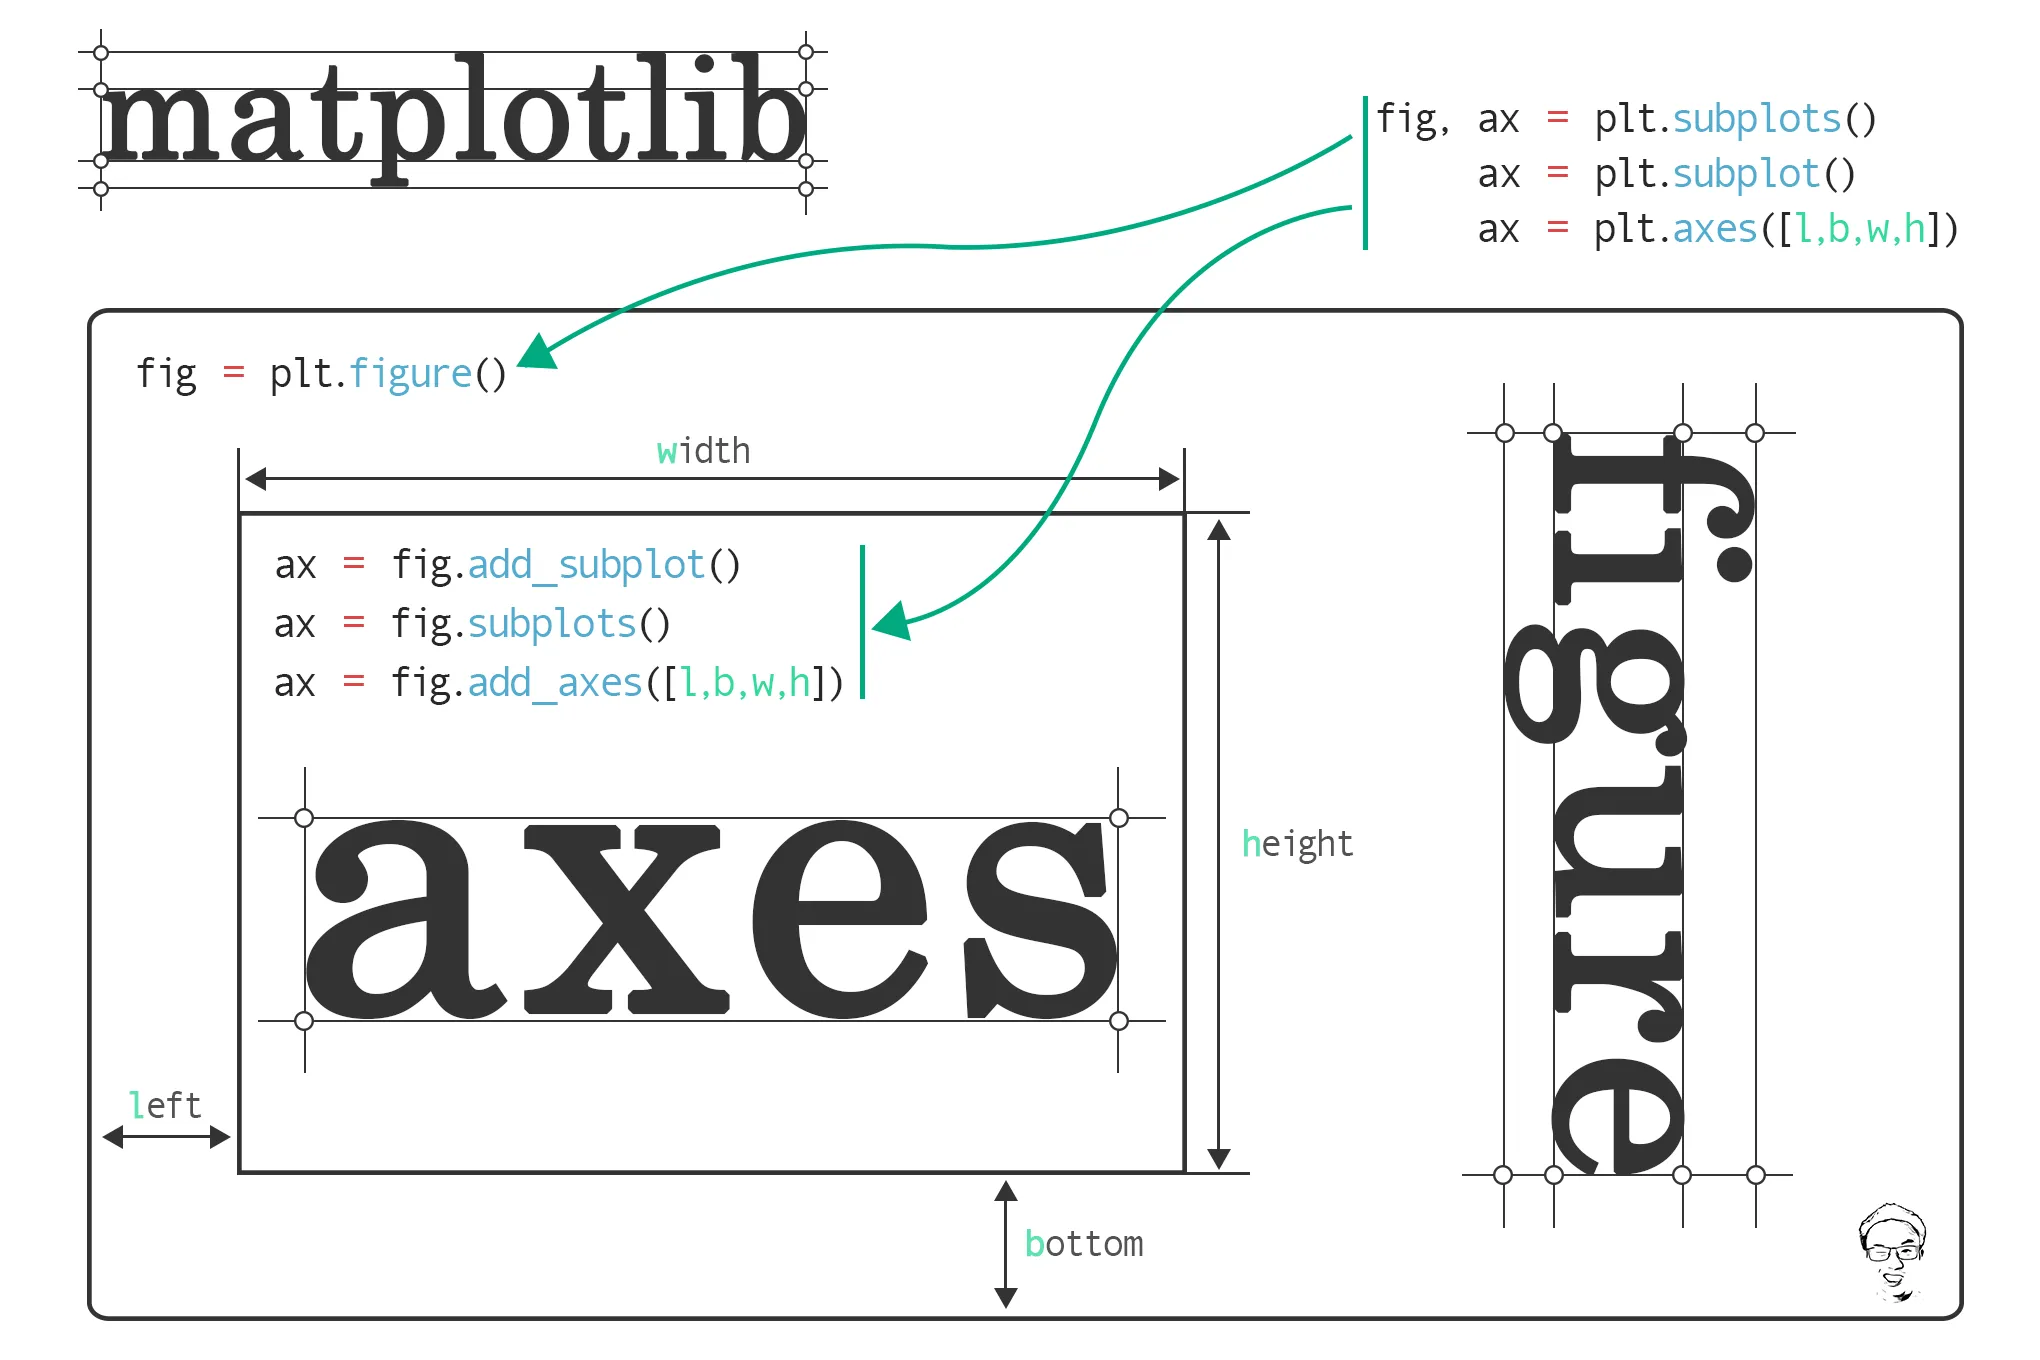
The Many Ways To Call Axes In Matplotlib
%matplotlib widget
from IPython.display import display, HTML
import re
from pathlib import Path
import cv2
import numpy as np
import matplotlib.pyplot as plt
from pprint import pprint
import clipboard
import pandas as pd
import concurrent.futures
import time
import pickle
import platform
import sys
plt.style.use("dark_background")
# import tensorflow as tf
# print(tf.__version__)
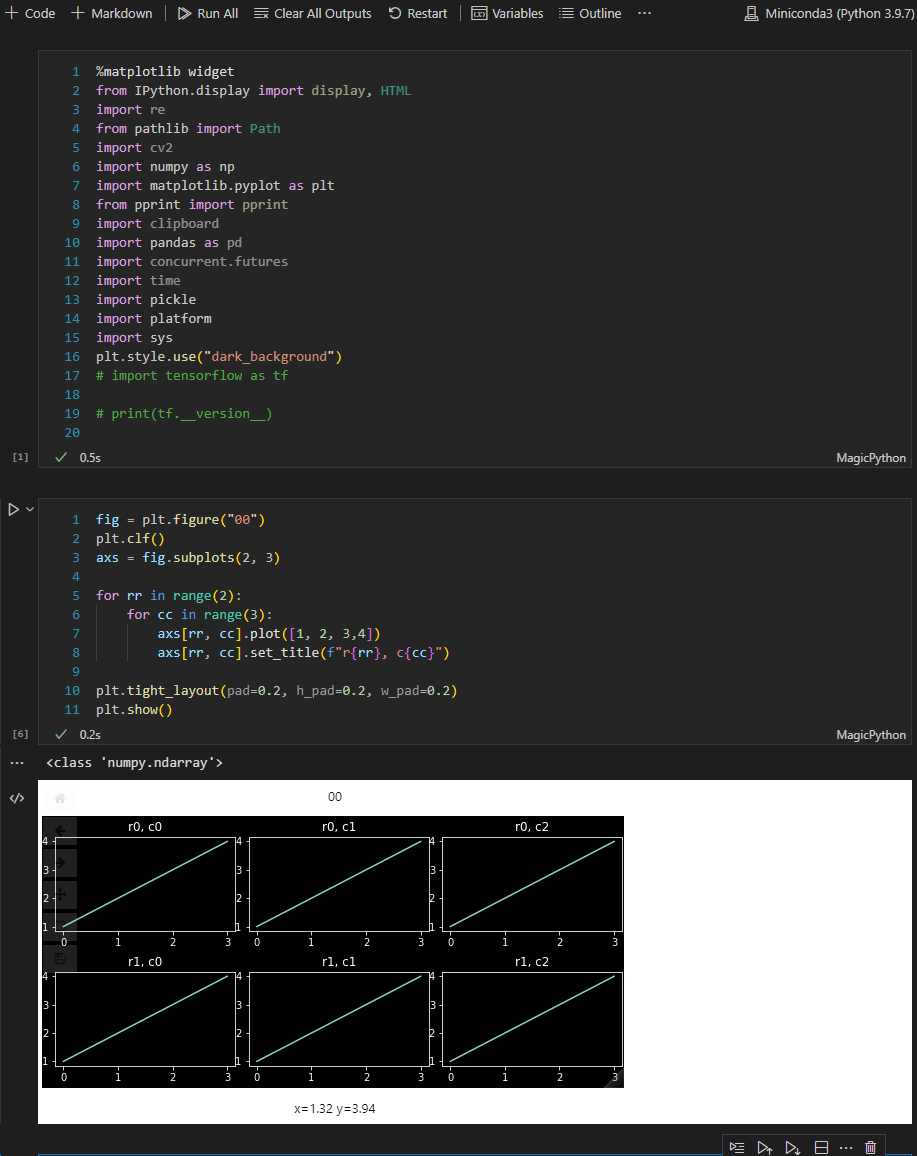
fig = plt.figure("00")
plt.clf()
axs = fig.subplots(2, 3)
for rr in range(2):
for cc in range(3):
axs[rr, cc].plot([1, 2, 3,4])
axs[rr, cc].set_title(f"r{rr}, c{cc}")
plt.tight_layout(pad=0.2, h_pad=0.2, w_pad=0.2)
plt.show()
ref
The Many Ways To Call Axes In Matplotlib | by Jun | Towards Data Science
https://towardsdatascience.com/the-many-ways-to-call-axes-in-matplotlib-2667a7b06e06#:~:text=In most circumstances%2C we instantiate,function is passed with fig.


 浙公网安备 33010602011771号