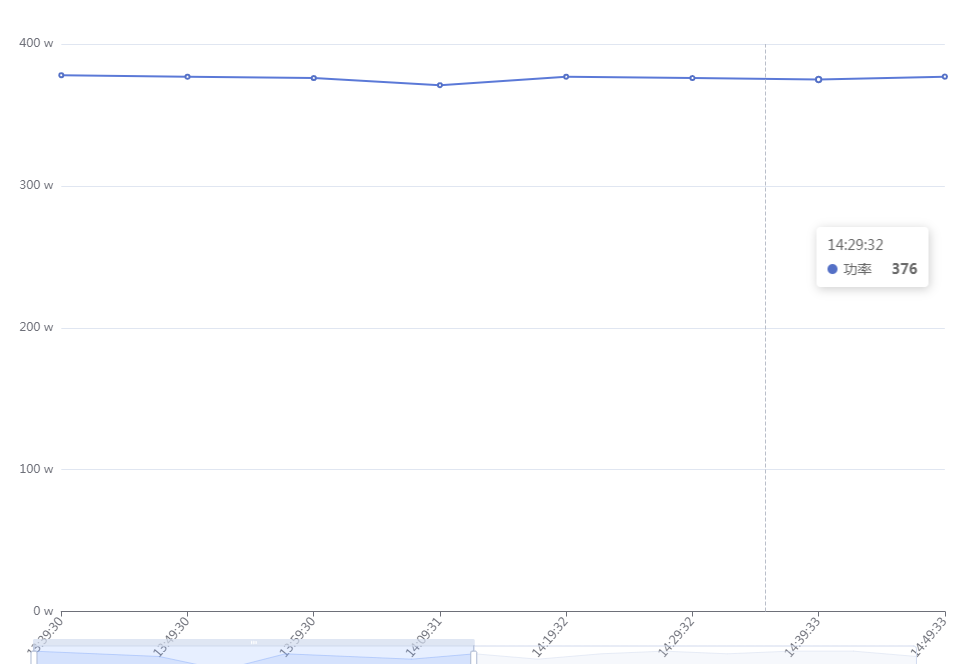
echarts -- x轴数据显示不全,添加滑动条

添加dataZoom属性即可显示滚动条
option = {
      tooltip: {
            trigger: 'axis'
        },
        grid: {
            top:"20%",
            left: '8%',
            right: '8%',
            bottom: '0',
            containLabel: true
        },
        xAxis: {
            type: 'category',
            boundaryGap: false,
            data:["13:39:30", "13:49:30", "13:59:30", "14:09:31", "14:19:32", "14:29:32", "14:39:33", "14:49:33", "14:59:34", "15:09:35", "15:19:35", "15:29:36", "15:39:36", "15:49:37"],
            axisLabel:{
                rotate : 50,
            },
            textStyle: {
              color: "#a9a9a9", //更改坐标轴文字颜色
              fontSize: 12 //更改坐标轴文字大小
            },
        },
        yAxis: {
            type: 'value',
            axisLabel: {
                formatter:'{value} w',
            },
        },
         dataZoom: [{  //添加dataZoom属性即可显示滑动条
                type: 'slider',
                show: true, //flase直接隐藏图形
                xAxisIndex: [0],
                left: '9%', //滚动条靠左侧的百分比
                bottom: -5,
                start: 0,//滚动条的起始位置
                end: 50 //滚动条的截止位置(按比例分割你的柱状图x轴长度)
          }],
        series: [
            {
                name: '功率',
                type: 'line',
                stack: 'Total',
                data:[378, 377, 376, 371, 377, 376, 375, 377, 375, 377, 378, 377, 378, 378, 376]
            }
        ]
    };


【推荐】国内首个AI IDE,深度理解中文开发场景,立即下载体验Trae
【推荐】编程新体验,更懂你的AI,立即体验豆包MarsCode编程助手
【推荐】抖音旗下AI助手豆包,你的智能百科全书,全免费不限次数
【推荐】轻量又高性能的 SSH 工具 IShell:AI 加持,快人一步
· 被坑几百块钱后,我竟然真的恢复了删除的微信聊天记录!
· 没有Manus邀请码?试试免邀请码的MGX或者开源的OpenManus吧
· 【自荐】一款简洁、开源的在线白板工具 Drawnix
· 园子的第一款AI主题卫衣上架——"HELLO! HOW CAN I ASSIST YOU TODAY
· Docker 太简单,K8s 太复杂?w7panel 让容器管理更轻松!