Matplotlib常用命令
这里主要记录下常用设置:
import numpy as np
import matplotlib.pyplot as plt

# 设定图片大小
fig, ax = plt.subplots(figsize=(8, 6))
# 设定中文字体,保证中文显示正常
plt.rcParams['font.sans-serif']='simhei'
# 定义标签字体大小
font1 = {'family' : 'simhei',
'weight' : 'normal',
'size'   : 18,}

# 生成x, y数据
x = np.arange(0., 5., 0.2)
y1 = x**2
y2 = x**3

# 设置x轴,y轴,title标签
plt.xlabel("我是X", fontdict=font1)
plt.ylabel("我是Y", fontdict=font1)
plt.title("这是一幅图", fontdict=font1)

# 设置x, y显示范围
plt.xlim(0, 5)
plt.ylim(0, max(y1))

# 设置x, y显示刻度
_xtick_labels = [i/2 for i in range(0,11)] # 把默认的每隔1改成了每隔0.5
plt.xticks(_xtick_labels)
_ytick_labels = [i for i in range(0, int(max(y1))+2)]
plt.yticks(_ytick_labels[::2]) # 如果过于密集,可以取步长,这里变成了每隔2

# 设置框线显示,不显示上边框和右边框
ax.spines['right'].set_visible(False)
ax.spines['top'].set_visible(False)

# 画图
plt.plot(x, y1, label="curve1")
plt.plot(x, y2, label="curve2")

# 显示图例
plt.legend()

# 保存图片
plt.savefig("test.png", bbox_inches = 'tight')
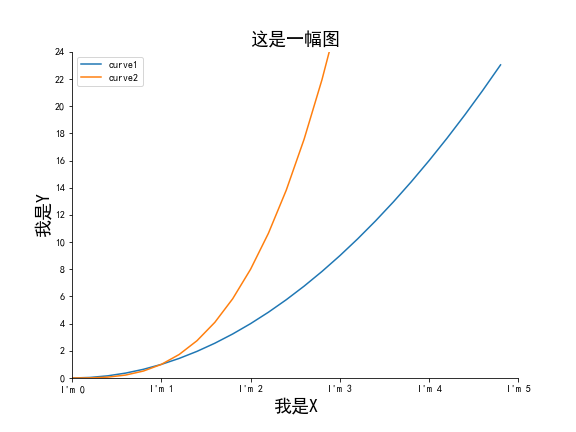
运行结果如下:

下面还可以对X,Y轴的刻度进行替换,保证_x和_xtick_labels的大小相同:
# 刻度替换
_x = range(0, 6)
_xtick_labels = ["I'm {}".format(i) for i in _x]
plt.xticks(_x, _xtick_labels)
运行结果如下:

下面再举一个散点图的例子:
import matplotlib.pyplot as plt
import random, matplotlib
fig, ax = plt.subplots(figsize=(18, 6))
x = range(1, 32)
a = [11,17,16,11,12,11,12,6,6,7,8,9,12,15,14,17,18,21,16,17,20,14,15,15,15,19,21,22,22,22,23]
b = [26,26,28,19,21,17,16,19,18,20,20,19,22,23,17,20,21,20,22,15,11,15,5,13,17,10,11,13,12,13,6]

x2 = range(41, 72)

_x = list(x)+list(x2)
xtick_labels = ["3月{}号".format(i) for i in x]
xtick_labels += ["10月{}号".format(i) for i in x]
plt.xticks(_x[::2], xtick_labels[::2], rotation=45)

plt.xlabel("时间", font1)
plt.ylabel("温度", font1)
plt.title("3月和10月温度变化", font1)

plt.scatter(x, a, label="3月份")
plt.scatter(x2, b, label="10月份")

plt.legend()
plt.savefig("test.png", bbox_inches = 'tight')
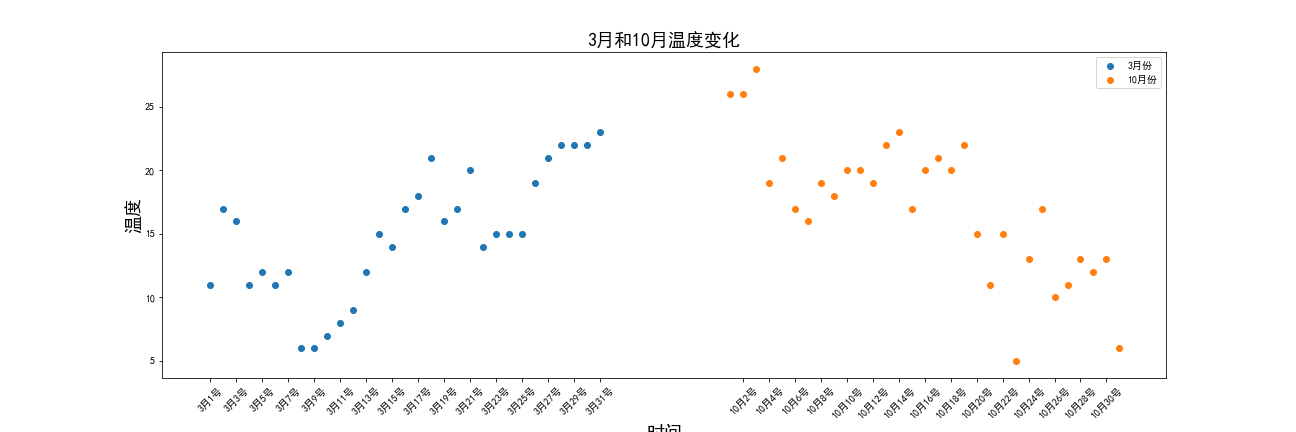
运行结果如下:

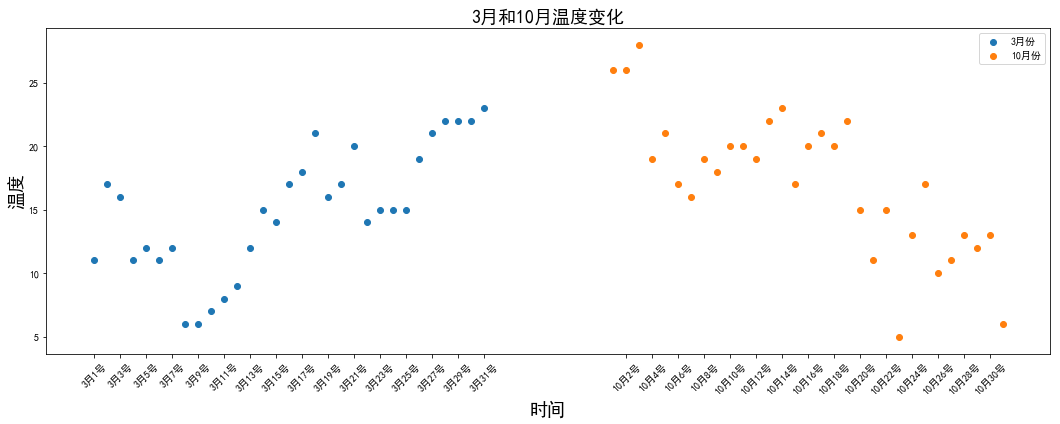
从上图可以看到保存的图片X轴标签显示不完整,我们修改plt.savefig中的参数,使用bbox_inches=‘tight’,即可正常显示:
plt.savefig("test.png", bbox_inches = 'tight')


