
9月25每日打卡
石家庄铁道大学2023年秋季
2021 级课堂测试试卷-HIVE数据分析
课程名称: 大型数据库应用技术 任课教师: 王建民 测试时间:极限测试
一、 数据说明:
样表(sales_sample_20170310)字段说明:
day_id 日期编号;
sale_nbr 卖出方代码;
buy_nbr 买入方代码;
cnt 数量
round 金额
卖出方和买入方又分为3种类型:
以'C'开头的表示类型为C,代表“航空公司”,只可以卖出,不可以买入;
以'O'开头的表示类型为O,代表“代理人”,既可以卖出,也可以买入,并且允许自己卖给自己(简单来讲:每个“代理人”代码可能对应多个售票点,售票点之前有交换票的情况,所以体现为自己卖给了自己);
'PAX'表示类型为PAX,代表“旅客”,只可以买入,不可以卖出。
举例
day_id,sale_nbr,buy_nbr,cnt,round
1,C1,O1001,1,360
卖出方为C1,类型为C;买入方为O1001,类型为O
day_id,sale_nbr,buy_nbr,cnt,round
1,O100,O100,4,2000
卖出方为O100,类型为O;买入方为O100,类型为O(即自己卖给自己是允许的)
day_id,sale_nbr,buy_nbr,cnt,round
1,O100,PAX,4,2000
卖出方为O100,类型为O;买入方为PAX,类型为PAX
二、 测试题目:
1、数据导入:
建表:
create table sales_sample_20170310 (
`day_id` string comment '时间',
`sale_nbr` string comment '卖出方',
`buy_nbr` string comment '买入方',
`cnt` int comment '数量',
`round` int comment '金额')
row format delimited
fields terminated by ','
lines terminated by '\n';
csv数据导入:
导入成功后验证
2、数据清洗:
3、数据分析处理:
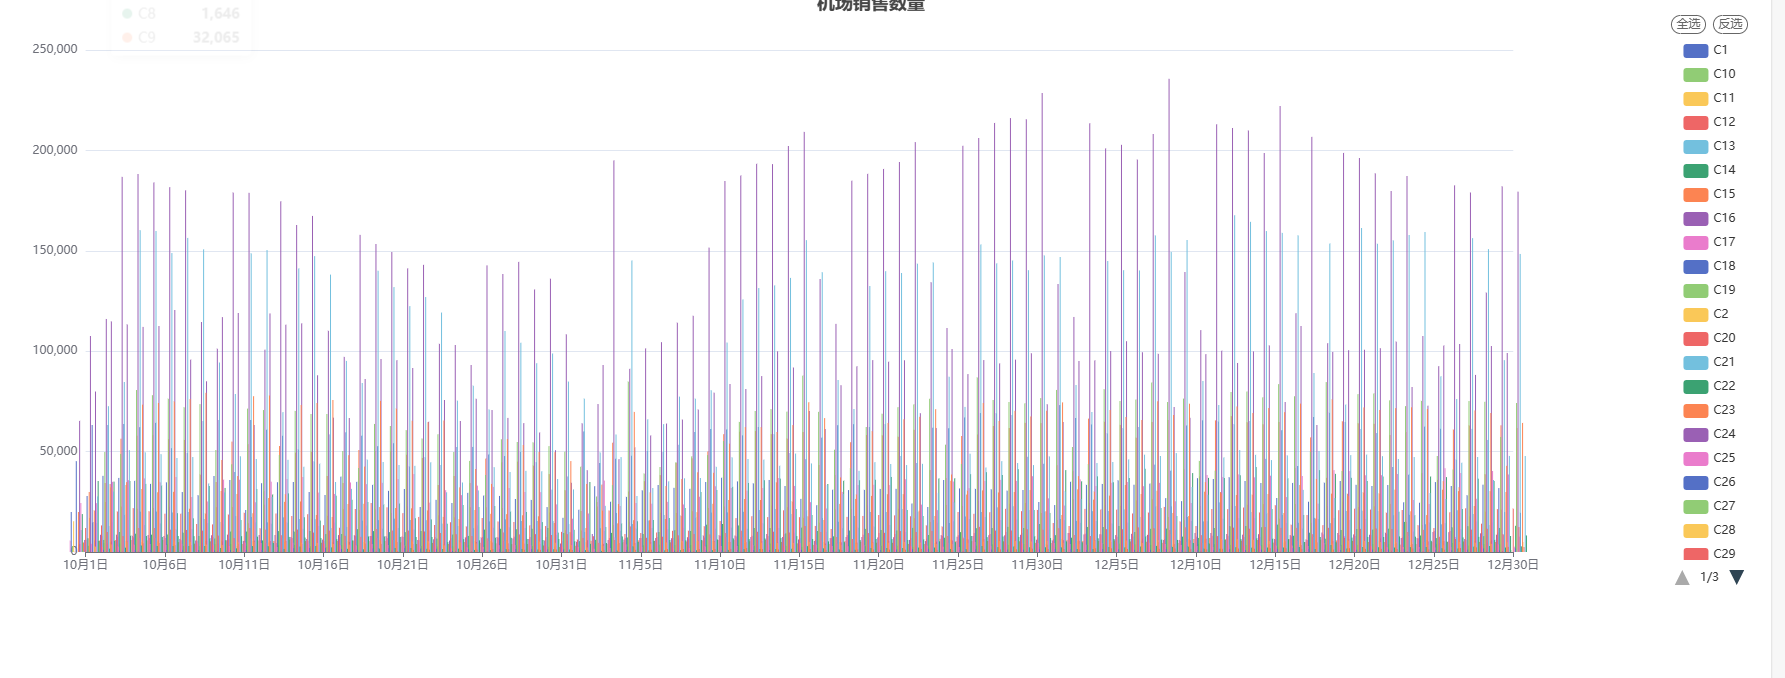
(1)统计每天各个机场的销售数量和销售金额。
-- 统计航空公司
create table sale_hangkong as
select
day_id,sale_nbr,sum(cnt) as cnt,sum(round) as round from sales_sample_20170310 where sale_nbr like 'C%' group by day_id, sale_nbr;
select * from sale_hangkong limit 1000;
(2)统计每天各个代理商的销售数量和销售金额。
select
day_id,
sale_nbr,
sum(cnt) as cnt_max,
sum(round) as round_max
from sales_sample111
where day_id between '2022-10-01' and '2022-10-20'
group by sale_nbr,day_id;
select * from day_sale limit 1000;
(3)统计每天各个代理商的销售活跃度。
create table huoyuedu as
select
day_id,
sale_nbr,
count(*) as sale_number
from sales_sample111
where day_id between '2022-10-01' and '2022-10-20'
group by sale_nbr,day_id;
select * from huoyuedu limit 1000;
(4)汇总统计9月1日到9月15日之间各个代理商的销售利润。
--计算代理商买入数量金额
drop table mairu;
create table mairu as
select
day_id,
buy_nbr,
sum(cnt) as cnt,
sum(round) as round
from sales_sample111
where buy_nbr like 'O%'
group by day_id, buy_nbr;
select * from mairu limit 1000;
create table maichu as
select
day_id,
sale_nbr,
sum(cnt) as cnt,
sum(round) as round
from sales_sample111
where sale_nbr like 'O%'
group by day_id, sale_nbr;
select * from maichu limit 1000;
(5)设计分析代理商的市场地位根据市场交易次数、交易对象个数、销售机票数量、销售利润等。(选做题)
create table lirun as
select a.day_id as day_id,
b.sale_nbr as nbr,
a.cnt as cnt_buy,
a.round as rount_buy,
b.cnt as cnt_sale,
b.round as round_sale,
b.round-a.round as liren
from mairu a join maichu b on a.buy_nbr = b.sale_nbr and a.day_id = b.day_id
where a.day_id between '2022-10-01' and '2022-10-15';
select * from lirun limit 1000;
4、处理结果入库:
create table jm0922_day_id as select distinct day_id from sale_hangkong;
create table jm0922_1_sale_nbr as select distinct sale_nbr from sale_hangkong;
5、数据可视化展示:
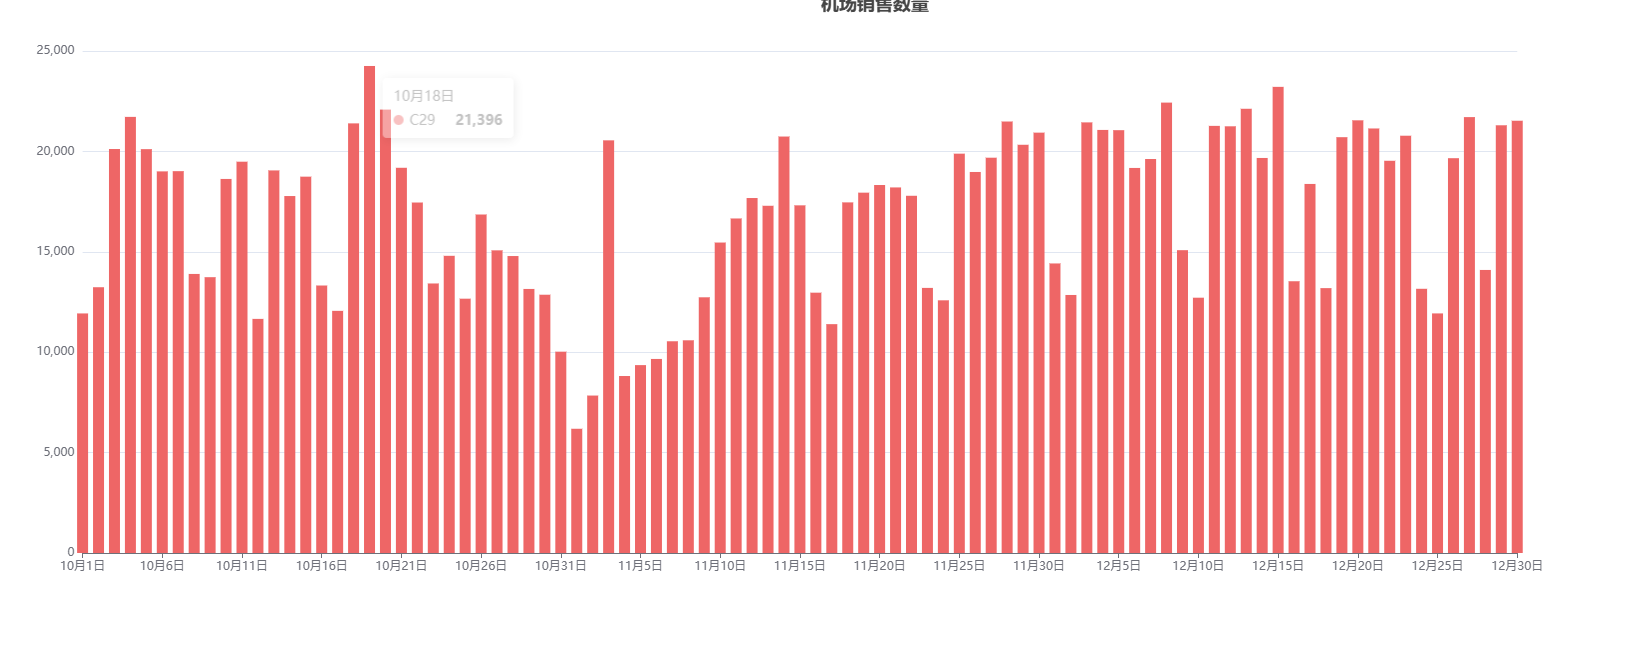
反选:C29
源码;
<%@page import="util.DBUtil"%>
<%@page import="java.sql.*"%>
<%@ page language="java" contentType="text/html; charset=UTF-8"
pageEncoding="UTF-8"%>
<!DOCTYPE html>
<html>
<head>
<meta charset="utf-8">
<title>机场销售数量</title>
<!-- 引入 echarts.js -->
<script src="https://cdn.staticfile.org/echarts/5.4.3/echarts.min.js"></script>
</head>
<body>
<!-- 为ECharts准备一个具备大小(宽高)的Dom -->
<div id="main" style="width: 100%; height: 600px;"></div>
<script type="text/javascript">
// 基于准备好的dom,初始化echarts实例
var myChart = echarts.init(document.getElementById('main'));
// 指定图表的配置项和数据
option = {
title : {
left: 'center',
text: '机场销售数量'
},
tooltip : {
trigger : 'axis'
},
legend : {
selector: true,
type: 'scroll',
orient: 'vertical',
right: 10,
top: 20,
bottom: 20,
},
grid : {
left : '3%',
right : '14%',
bottom : '3%',
containLabel : true
},
toolbox : {
feature : {
}
},
xAxis : {
type : 'category',
boundaryGap : false,
data : [ '10月1日', '10月2日', '10月3日', '10月4日', '10月5日', '10月6日',
'10月7日', '10月8日', '10月9日', '10月10日', '10月11日',
'10月12日', '10月13日', '10月14日', '10月15日', '10月16日',
'10月17日', '10月18日', '10月19日', '10月20日', '10月21日',
'10月22日', '10月23日', '10月24日', '10月25日', '10月26日',
'10月27日', '10月28日', '10月29日', '10月30日', '10月31日',
'11月1日', '11月2日', '11月3日', '11月4日', '11月5日', '11月6日',
'11月7日', '11月8日', '11月9日', '11月10日', '11月11日',
'11月12日', '11月13日', '11月14日', '11月15日', '11月16日',
'11月17日', '11月18日', '11月19日', '11月20日', '11月21日',
'11月22日', '11月23日', '11月24日', '11月25日', '11月26日',
'11月27日', '11月28日', '11月29日', '11月30日', '12月1日',
'12月2日', '12月3日', '12月4日', '12月5日', '12月6日', '12月7日',
'12月8日', '12月9日', '12月10日', '12月11日', '12月12日',
'12月13日', '12月14日', '12月15日', '12月16日', '12月17日',
'12月18日', '12月19日', '12月20日', '12月21日', '12月22日',
'12月23日', '12月24日', '12月25日', '12月26日', '12月27日',
'12月28日', '12月29日', '12月30日' ]
},
yAxis : {
type : 'value'
},
series : [
<%
try{
Connection connection = DBUtil.getConnection();
PreparedStatement preparedStatement = null;
ResultSet rs = null;
String sql = "select * from jm0922_day_id join jm0922_1_sale_nbr left join sale_hangkong on jm0922_day_id.day_id = sale_hangkong.day_id and jm0922_1_sale_nbr.sale_nbr = sale_hangkong.sale_nbr order by jm0922_1_sale_nbr.sale_nbr ,jm0922_day_id.day_id";
preparedStatement = connection.prepareStatement(sql, ResultSet.TYPE_SCROLL_INSENSITIVE, ResultSet.CONCUR_READ_ONLY);
rs = preparedStatement.executeQuery();
while(rs.next()){
%>
{
name : '<%=rs.getObject("jm0922_1_sale_nbr.sale_nbr")%>',
type : 'bar',
connectNulls:true,
smooth: false,
data : [
<%
if(rs.getObject("cnt")!=null){
out.print(""+rs.getObject("cnt"));
}
rs.next();
for(int i=0;i<90;i++){
out.print(",");
if(rs.getObject("cnt")!=null){
out.print(""+rs.getObject("cnt"));
}
rs.next();
}
rs.previous();
%>
]
},
<%
}
}catch(Exception e){
%>
]
},
<%
}
%>
]
};
// 使用刚指定的配置项和数据显示图表。
myChart.setOption(option);
</script>
</body>
</html>


【推荐】国内首个AI IDE,深度理解中文开发场景,立即下载体验Trae
【推荐】编程新体验,更懂你的AI,立即体验豆包MarsCode编程助手
【推荐】抖音旗下AI助手豆包,你的智能百科全书,全免费不限次数
【推荐】轻量又高性能的 SSH 工具 IShell:AI 加持,快人一步
· Ollama——大语言模型本地部署的极速利器
· 使用C#创建一个MCP客户端
· 分享一个免费、快速、无限量使用的满血 DeepSeek R1 模型,支持深度思考和联网搜索!
· ollama系列1:轻松3步本地部署deepseek,普通电脑可用
· 按钮权限的设计及实现