python matplotlib
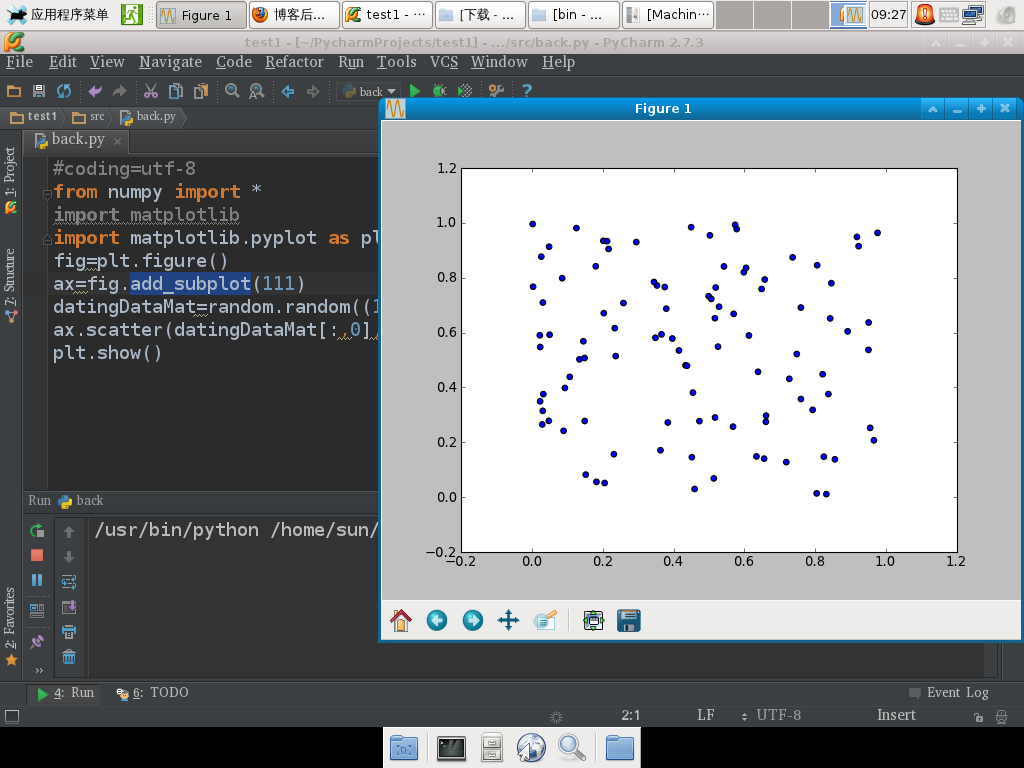
#coding=utf-8
from numpy import *
import matplotlib
import matplotlib.pyplot as plt
fig=plt.figure()
ax=fig.add_subplot(111)
datingDataMat=random.random((100,2))
ax.scatter(datingDataMat[:,0],datingDataMat[:,1])
plt.show()
#coding=utf-8 from numpy import * import matplotlib import matplotlib.pyplot as plt fig=plt.figure() ax=fig.add_subplot(111) datingDataMat=random.random((100,2)) ax.scatter(datingDataMat[:,0],datingDataMat[:,1]) plt.show()
