


Springboot+Prometheus+grafana 制作自己的业务监控
目录
//@desc:Springboot+Prometheus+grafana 制作自己的业务监控
//@desc:码字不宜,转载请注明出处
//@author:张慧源 <turing_zhy@163.com>
//@date:2022/09/09
知识储备
Prometheus 中文文档 : https://prometheus.fuckcloudnative.io/
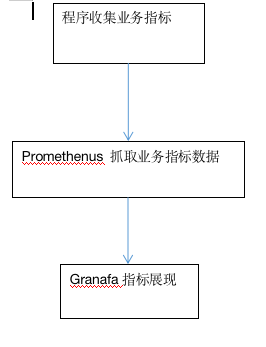
系统架构
开始实现
生成业务指标
经典实现方法
经典的实现方法网上有很多案例,即利用切面在接口发生调用的时候写入指标数据
详见:https://www.jb51.net/article/202726.htm
自己的实现方案
由于自己的业务是为服务架构,第一期打算先实现从无到有,于是采用了定时任务跑指标的方案
引入依赖
<!--prometheus-->
        <dependency>
            <groupId>io.micrometer</groupId>
            <artifactId>micrometer-registry-prometheus</artifactId>
            <version>1.8.4</version>
        </dependency>

        <!--定时任务-->
        <dependency>
            <groupId>org.springframework.boot</groupId>
            <artifactId>spring-boot-starter-quartz</artifactId>
            <version>2.6.6</version>
        </dependency>

        <!--actuator 监控-->
        <dependency>
            <groupId>org.springframework.boot</groupId>
            <artifactId>spring-boot-starter-actuator</artifactId>
            <version>2.7.2</version>
        </dependency>
配置文件
#监控路径
management:
  endpoints:
    web:
      exposure:
        include: "*"
注册自己的指标[我这里用的是guaua格式数据]
package cn.hexcloud.m82.monitoring.service.monitor;

import io.micrometer.prometheus.PrometheusMeterRegistry;
import io.prometheus.client.Gauge;
import org.springframework.stereotype.Service;

import javax.annotation.PostConstruct;
import javax.annotation.Resource;

/**
 * 优惠相关监控
 *
 * @author abner<huiyuan.zhang @ hex-tech.net>
 * @date 2022-09-08 17:09:14
 */
@Service
public class PromotionMonitor {
    /**
     * 核券数量
     */
    public static Gauge VERIFY_COUPON_COUNT;

    /**
     * 核券金额
     */
    public static Gauge VERIFY_COUPON_AMOUNT_SUM;

    /**
     * 核活动数量
     */
    public static Gauge VERIFY_ACTIVITY_COUNT;

    /**
     * 核活动金额
     */
    public static Gauge VERIFY_ACTIVITY_AMOUNT_SUM;

    /**
     * 构造函数
     *
     * @author abner<huiyuan.zhang @ hex-tech.net>
     * @date 2022-09-08 11:33:56
     */
    @PostConstruct
    private void init() {
        VERIFY_COUPON_COUNT = initVerifyCouponCount();
        VERIFY_COUPON_AMOUNT_SUM = initVerifyCouponAmountSum();
        VERIFY_ACTIVITY_COUNT = initVerifyActivityCount();
        VERIFY_ACTIVITY_AMOUNT_SUM = initVerifyActivityAmountSum();
    }

    @Resource
    private PrometheusMeterRegistry prometheusMeterRegistry;

    /**
     * 获取 verify coupon count 句柄
     *
     * @author abner<huiyuan.zhang @ hex-tech.net>
     * @date 2022-09-08 11:47:45
     */
    public Gauge getVerifyCouponCount() {
        return VERIFY_COUPON_COUNT;
    }

    /**
     * 获取 verify coupon amount sum 句柄
     *
     * @author abner<huiyuan.zhang @ hex-tech.net>
     * @date 2022-09-08 11:47:45
     */
    public Gauge getVerifyCouponAmountSum() {
        return VERIFY_COUPON_AMOUNT_SUM;
    }

    /**
     * 获取 experience count 句柄
     *
     * @author abner<huiyuan.zhang @ hex-tech.net>
     * @date 2022-09-08 11:47:45
     */
    public Gauge getVerifyActivityCount() {
        return VERIFY_ACTIVITY_COUNT;
    }

    /**
     * 获取 verify activity amount sum 句柄
     *
     * @author abner<huiyuan.zhang @ hex-tech.net>
     * @date 2022-09-08 11:47:45
     */
    public Gauge getVerifyActivityAmountSum() {
        return VERIFY_ACTIVITY_AMOUNT_SUM;
    }

    /**
     * 核券数量
     */
    public Gauge initVerifyCouponCount() {
        Gauge verifyCouponCount = Gauge.build().name("verify_coupon_count").labelNames("partner_id").help("verify coupon count").register();
        prometheusMeterRegistry.getPrometheusRegistry().register(verifyCouponCount);
        return verifyCouponCount;
    }

    /**
     * 核券金额
     */
    public Gauge initVerifyCouponAmountSum() {
        Gauge verifyCouponAmountSum = Gauge.build().name("verify_coupon_amount_sum").labelNames("partner_id").help("verify coupon amount sum").register();
        prometheusMeterRegistry.getPrometheusRegistry().register(verifyCouponAmountSum);
        return verifyCouponAmountSum;
    }

    /**
     * 核销活动数量
     */
    public Gauge initVerifyActivityCount() {
        Gauge verifyActivityCount = Gauge.build().name("verify_activity_count").labelNames("partner_id").help("verify activity count").register();
        prometheusMeterRegistry.getPrometheusRegistry().register(verifyActivityCount);
        return verifyActivityCount;
    }

    /**
     * 核活动金额
     */
    public Gauge initVerifyActivityAmountSum() {
        Gauge verifyActivityAmountSum = Gauge.build().name("verify_activity_amount_sum").labelNames("partner_id").help("verify activity amount sum").register();
        prometheusMeterRegistry.getPrometheusRegistry().register(verifyActivityAmountSum);
        return verifyActivityAmountSum;
    }
}
写入指标
log.info("VerifyActivityCount-partnerId:{}-count:{}",partnerCountAmountActivityDto.getPartnerId(),partnerCountAmountActivityDto.getCount());
                promotionMonitor.getVerifyActivityCount().labels(partnerCountAmountActivityDto.getPartnerId()).set(partnerCountAmountActivityDto.getCount());

                float verifyCouponAmount = partnerCountAmountActivityDto.getAmount()
                        .divide(BigDecimal.TEN.multiply(BigDecimal.TEN), 2, RoundingMode.HALF_UP)
                        .floatValue();
                log.info("VerifyActivityAmountSum-partnerId:{}-amount:{}",partnerCountAmountActivityDto.getPartnerId(),verifyCouponAmount);
                promotionMonitor.getVerifyActivityAmountSum().labels(partnerCountAmountActivityDto.getPartnerId()).set(verifyCouponAmount);
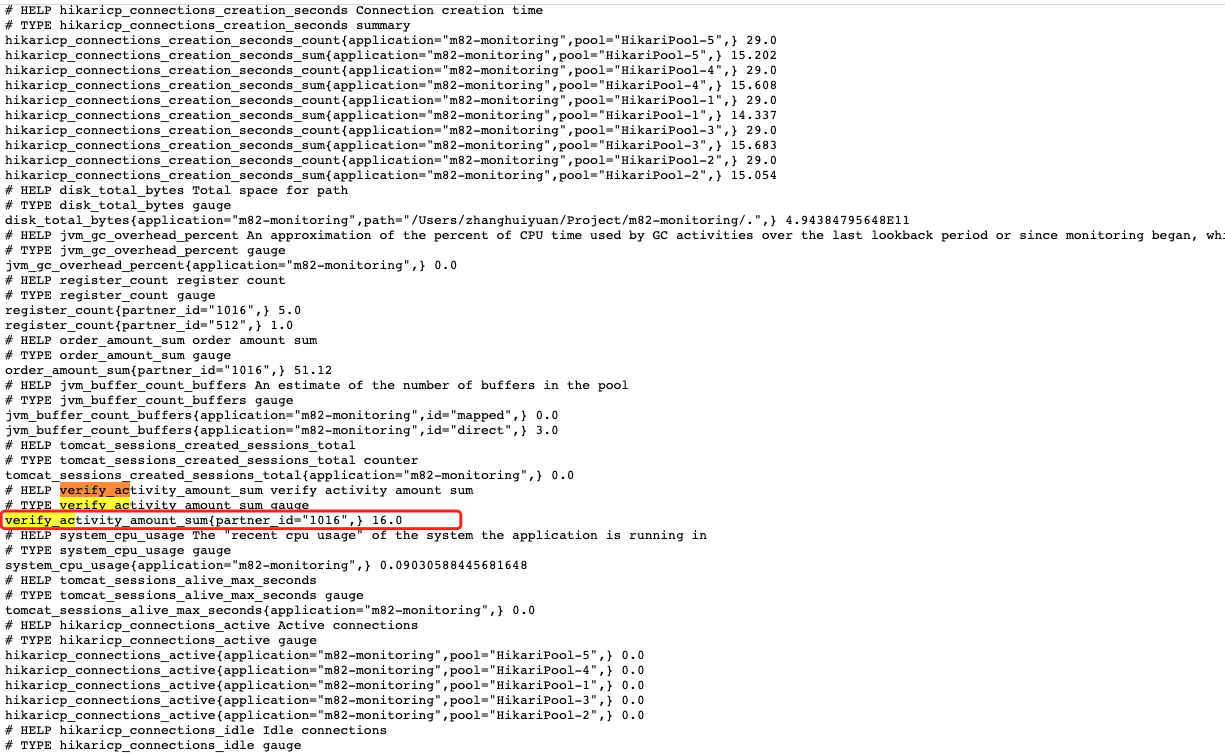
效果展示
路径:http://localhost:8080//actuator/prometheus
配置prometheus 抓取上面的指标
** 可以搭建自己的prometheus服务也可以使用阿里云的prometheus**
我是使用阿里云的prometheus
抓取配置
# my global config
global:
  scrape_interval:     15s # Set the scrape interval to every 15 seconds. Default is every 1 minute.
  evaluation_interval: 15s # Evaluate rules every 15 seconds. The default is every 1 minute.
  # scrape_timeout is set to the global default (10s).

# Alertmanager configuration
alerting:
  alertmanagers:
  - static_configs:
    - targets:
      # - alertmanager:9093

# Load rules once and periodically evaluate them according to the global 'evaluation_interval'.
rule_files:
  # - "first_rules.yml"
  # - "second_rules.yml"

# A scrape configuration containing exactly one endpoint to scrape:
# Here it's Prometheus itself.
scrape_configs:
  # The job name is added as a label `job=` to any timeseries scraped from this config.
  - job_name: 'prometheus'

    # metrics_path defaults to '/metrics'
    # scheme defaults to 'http'.

    static_configs:
    - targets: ['localhost:9090']
配置自己的图表
我的业务需要分租户展示,kennel跟大家的不太一样,稍微展示下吧
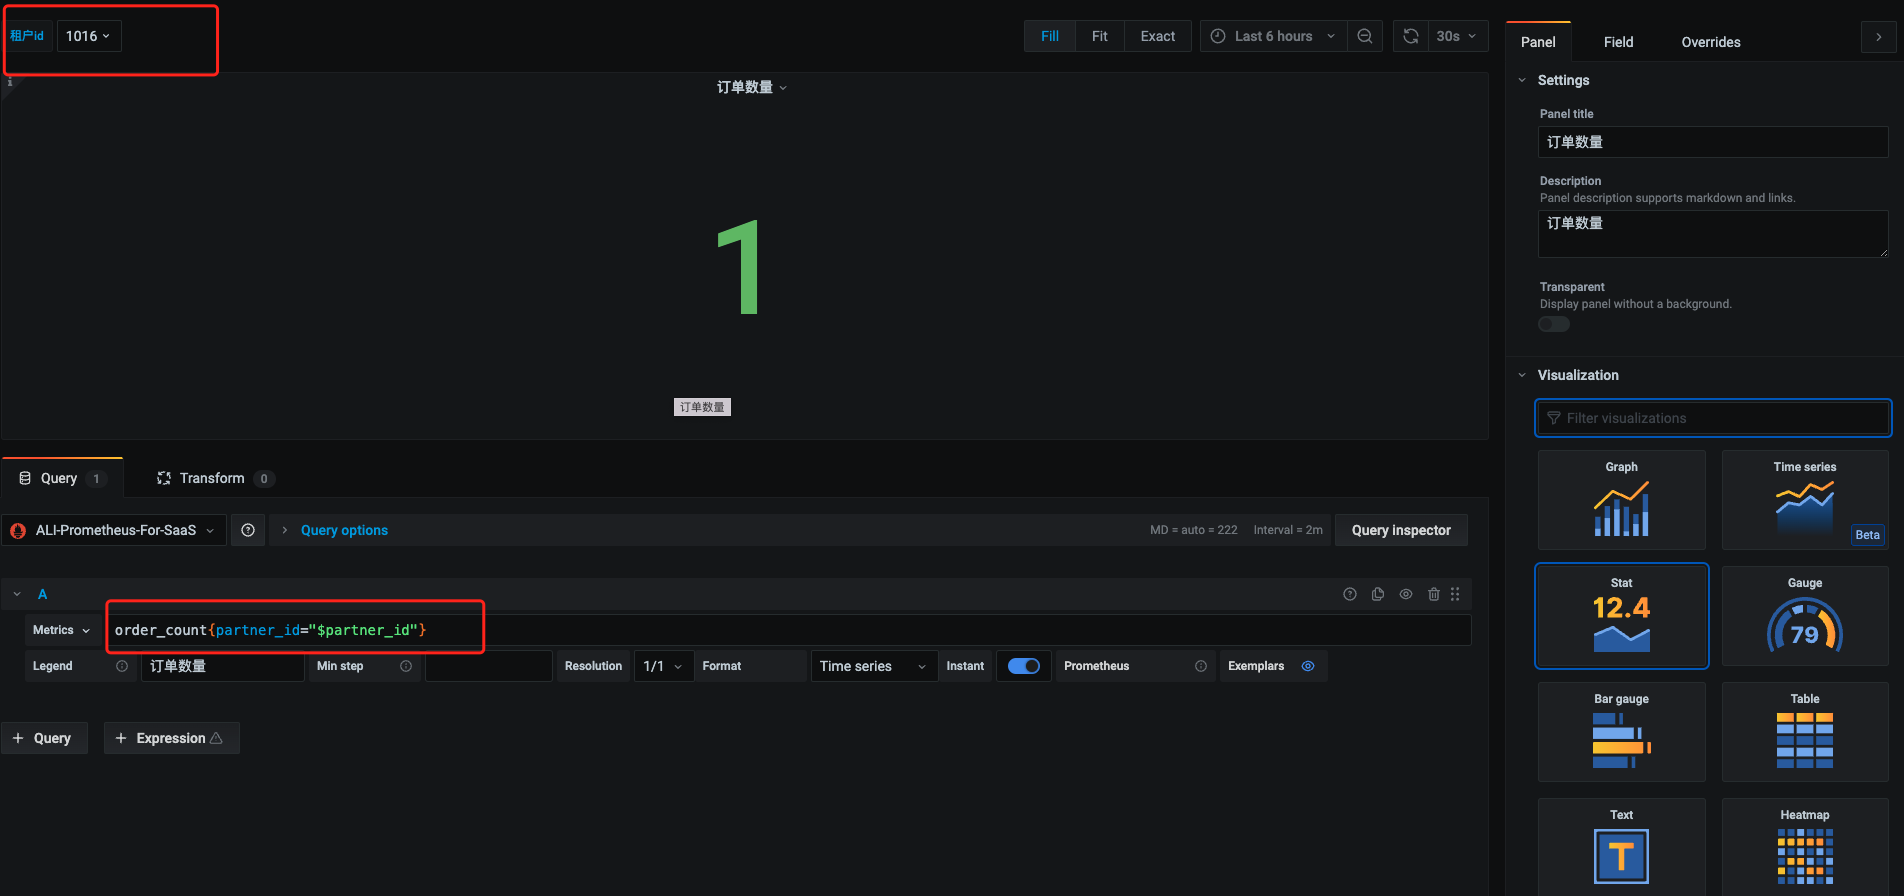
最终效果展示

