


7.3 The Sampling Distribution of the Sample Mean
population:1000;Scale are normally distributed with mean 100 and standard deviation 16
sample:4;可以得到样本均值的分布图如下:
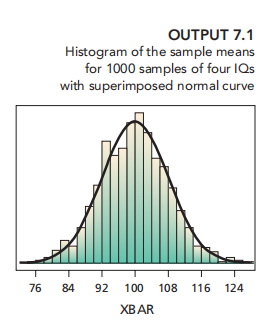
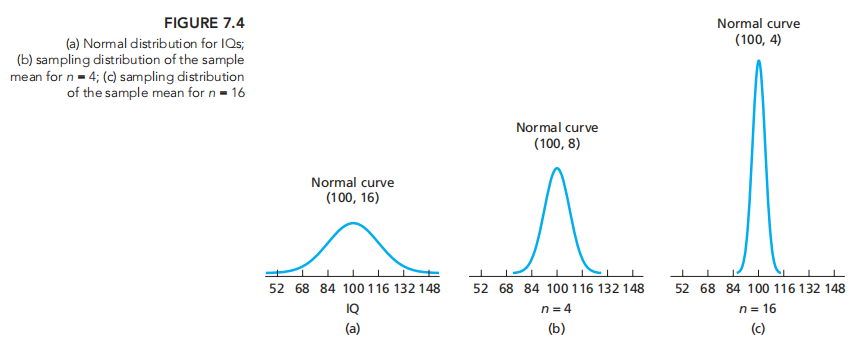
与通过公式计算得到的mean 和 标准差一致:μx¯ = μ = 100 and σx¯ = σ/√n = 16/√4 = 8;
由图可知The histogram is shaped roughly like a normal curve (with parameters 100 and 8)
所以:

由此得到:

即在大数据量的情况下,虽然变量可能不是正态分布的,但是该变量的mean值一定是正态分布的,也就是中心极限定理:
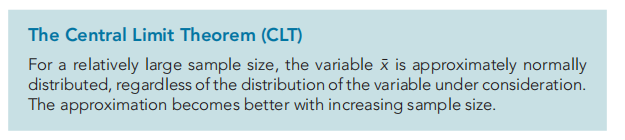
Usually, however, a sample size of 30 or more (n ≥ 30) is large enough
example:
统计每户房子占有人数:可知该变量属于右偏分布:
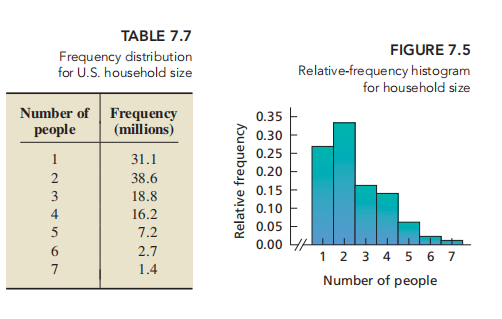
household size is far from being normally distributed; it is right skewed. Nonetheless, according to the central limit theorem, the sampling distribution of the sample mean can be approximated by a normal distribution when the sample size is relatively large. Use simulation to make that fact plausible for a sample size of 30
可以计算得到该样本mean的均值和方差:
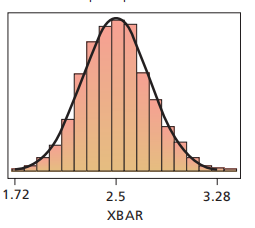
We simulated 1000 samples of 30 households each, determined the sample mean of each of the 1000 samples, and obtained a histogram (Output 7.2) of the 1000 sample means.
从1000个样本中抽出30个样本,计算这三十个样本的均值,得到上图(即样本均值分布图,验证了中心极限定理,即该分布也是正态分布的)
变量分布/变量mean 分布(在n逐渐变大的趋势下)/
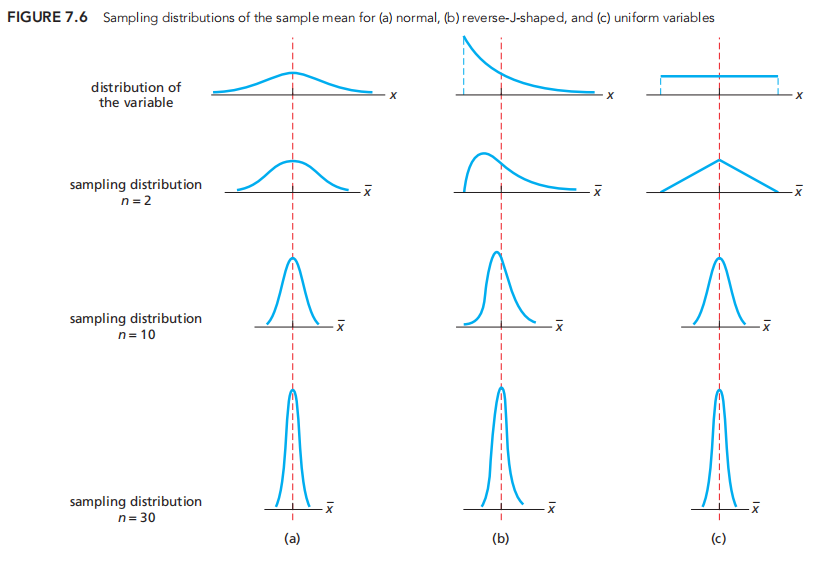
可见,SE也在逐渐变小
所以,取样越大,数据越集中在均值附近,相应的SE越小。

